1. Introduction
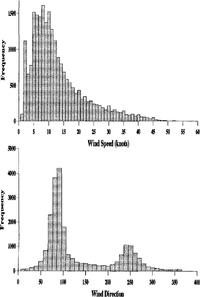
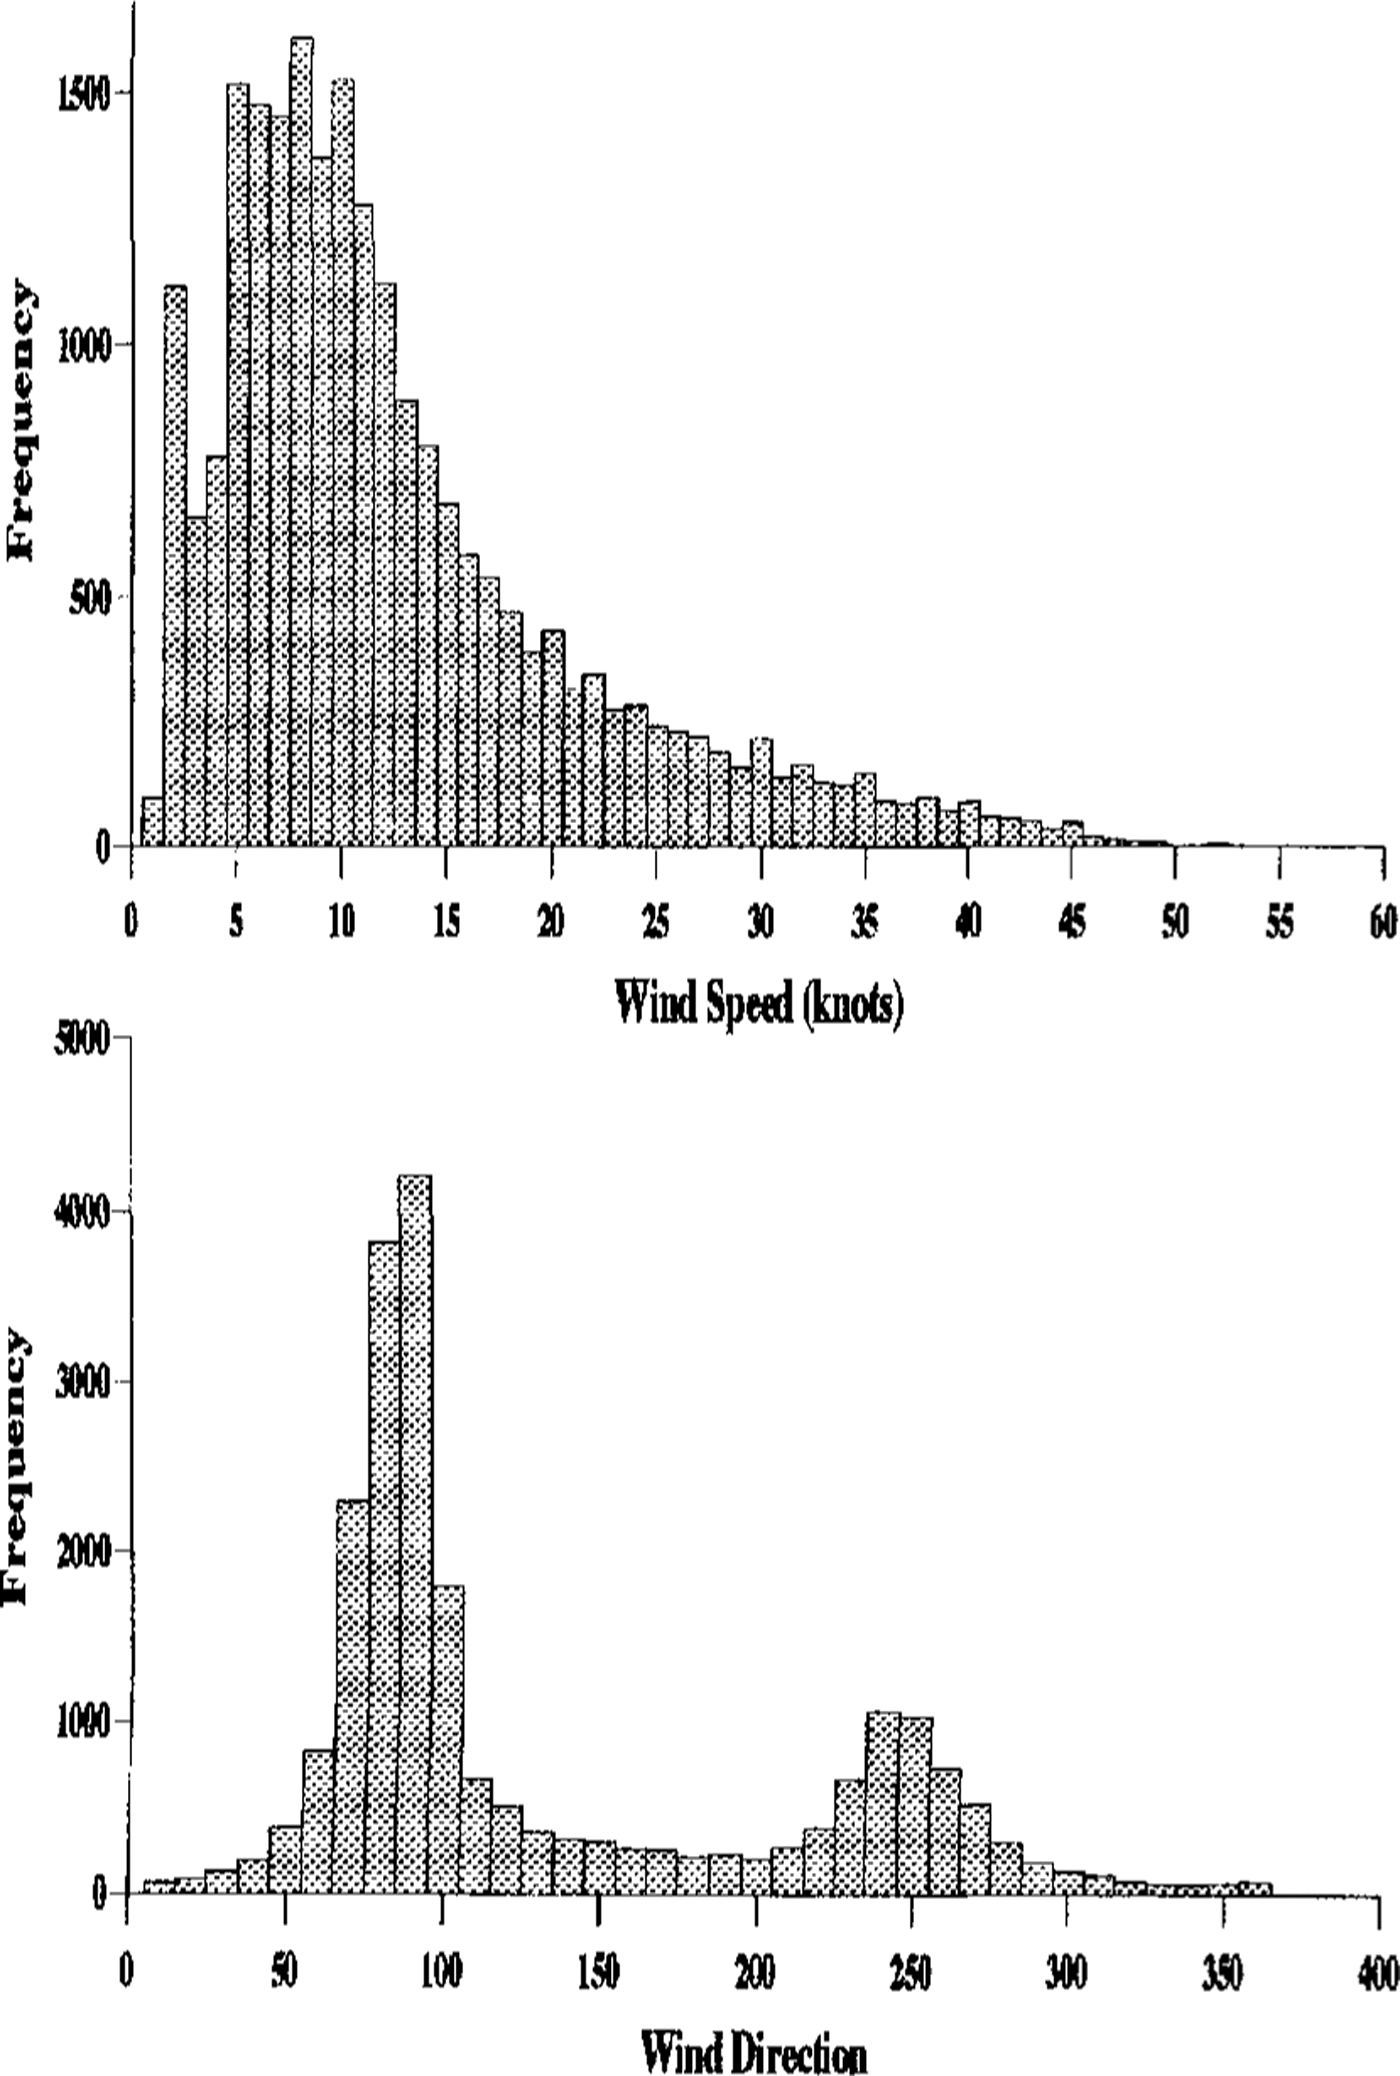
The Brunt Ice Shelf is a large, flat ice shelf a few hundred metres thick projecting over the Weddell Sea from the Antarctic land mass. Figure 1 shows histograms of wind speed and direction from the Halley area. The observations were taken at 3h intervals between 1984 and 1991 at a height of 10 m above the ground. The mean wind speed is 13 kt though gusts of 30–40kt are not uncommon. The prevailing direction is easterly and there is a secondary bias towards winds from the west. More detailed examination of the data shows that nearly all the strong winds (above about 20 kt at 10 m) come from these two directions.
Histograms of 10 m wind speed and direction at Halley. Directions are in degrees from the north, so that the modal directions are easterly and westerly.
The first two Halley stations were of conventional design and built on the ice surface, whilst the third and fourth were tubular and were initially partially buried. Both designs of building became totally covered with snow within a few years. Access tunnels prolonged their useful lives slightly but the weight of snow soon made the buildings unsafe.
The present station consists of three buildings, the largest of which is the accommodation building (ACB) which is approximately 65 m by 15 m and 5 m high. Its base is maintained at between 3 and 5 m from the ground by jacking and inserting extra sections of leg as required. The other buildings are the ice and climate building (ICB) and space sciences building (SSB) which are both about 15 m by 15 m and 5m high. Each building is a few hundred metres from the others and contour maps of the area show that the drift patterns associated with each building form independently. All three buildings are orientated with their largest dimension perpendicular to the prevailing wind.
This paper presents a mathematical model which predicts the shape and rate of drift formation around one building of the type described above. The model is described, including details of the approximations made, the governing equations are developed and then an outline of the numerical procedure is presented. This is followed by model results for a particular situation and a comparison is made between these and some appropriate real data. In the final section, some conclusions are drawn.
2. The model
The aim is to obtain a sequence of drift shapes as time progresses. In order to do this, it is necessary to determine the flow and blowing-snow density fields around the buildings. The precise geometry of the buildings is very complicated, as is the nature of the wind. Several assumptions have been made regarding this in the interests of simplicity and solvability, namely
Independent buildingsThe buildings are far enough apart that the flow and snow–density fields near one building are not noticeably influenced by the presence of the other buildings. For this reason, one building is considered in isolation and the model parameters may be changed to simulate each of the three buildings.
Steady flow. For simplicity, we consider the situation in which a steady wind blows from a constant direction and for which the flow and snow-density fields have reached their steady values. The lower–boundary topography is initially flat and of infinite extent. From initial site plans, this is a very good approximation. This topography is assumed to change so slowly that, for each successive boundary profile, the flow' field may be determined by assuming a constant ground profile.
Cuboidal building. This is a good approximation and greatly simplifies the numerical solution as a rectangular grid can be used.
Two dimensions.This greatly reduces the computational time required to obtain a solution, although a three-dimensional building will be investigated later. This is expected to be a better approximation for the accommodation building, whose width is four times its streamwise length and 13 times its height, than for the other buildings where the ratios become 1 and 3, respectively. The legs of the building are neglected as otherwise they Would form an impenetrable barrier.
The volume concentration of snow in the air is very small (typically of the order of 0.1% near the ground)and decreases very rapidly with height. For this reason, the snow is modelled as a passive contaminant and the fluid-flow problem is solved first, assuming that no snow is present. The snow-density field is determined afterwards using this knowledge of the flow field.
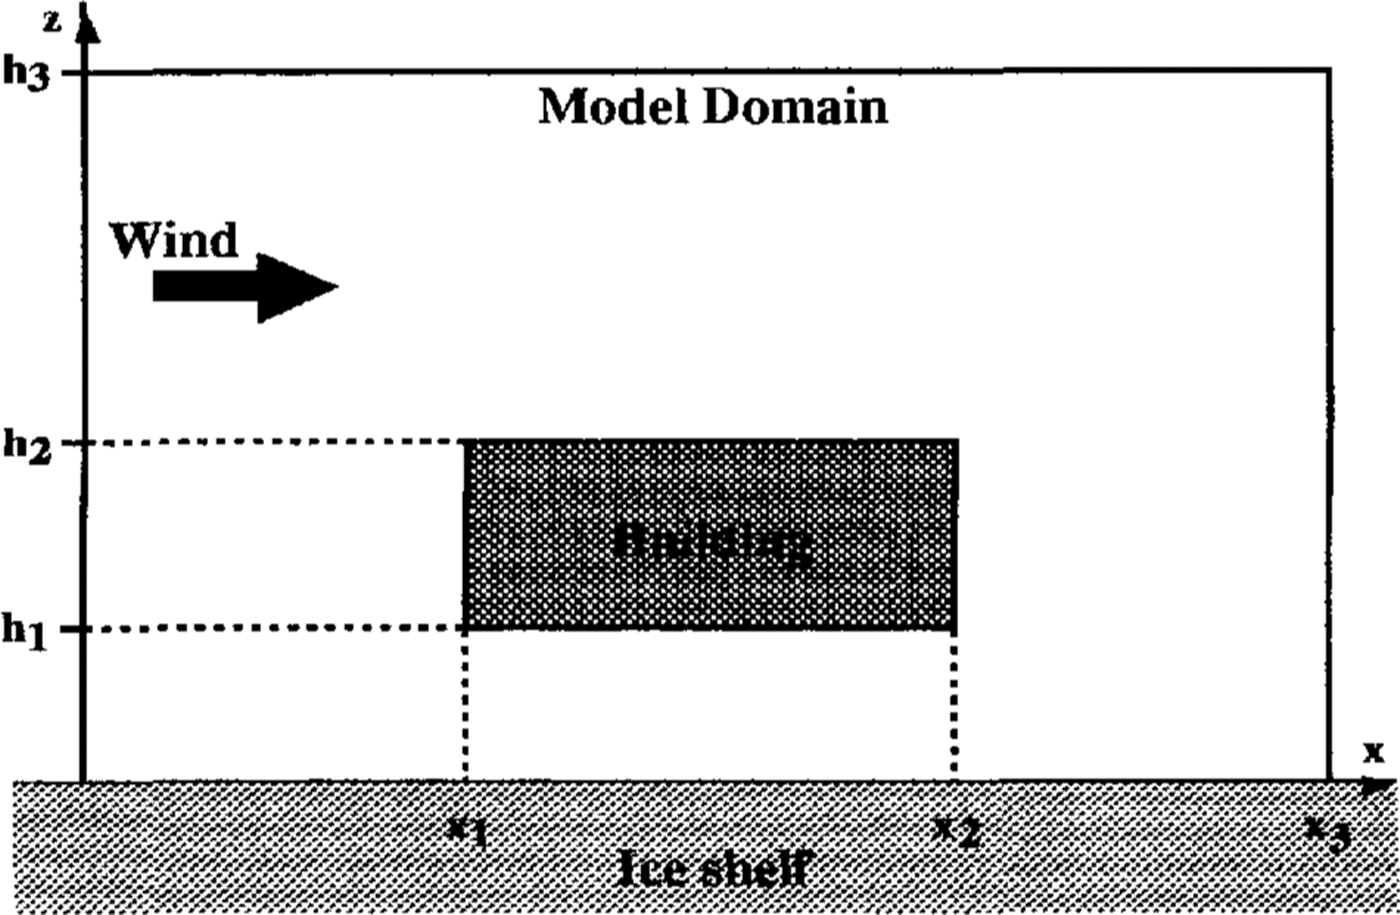
Figure 2 shows the domain in which the model problem is solved. The domain height, h3 , is high enough that there is never any (non-precipitating) snow at this height and the influence of the building on the flow is negligible. The upstream and downstream boundaries are also far enough from the building that its influence on the flow and snow-density fields is not significant.
The two-dimensional solution domain..
2.1. Fluid flow field
The fluid flow is found by solving the Navier-Stokes equation in a rotating frame of reference (rotating with the Earth). The flow is turbulent and a first-order closure (eddy-viscosity) model of turbulence is used. This model was chosen for its simplicity but more complex turbulence models may be investigated later. The eddy viscosity, v, is assumed to depend on the mixing length, l, which is the length scale of the largest eddies, and the velocity shear, S. The air is taken to be incompressible and to have constant temperature and density, ρa, all of which are good approximations for the region of the atmosphere under consideration. The flow is driven by a geostrophic wind, ug,which effectively provides the top and upstream boundary conditions for the model. (It would have been possible, though not necessarily simpler, to impose an upstream-boundary condition based on experimental observations and to ignore the Carioles terms, which are not important for these length scales but are convenient as a driving mechanism.) The Navier-Stokes equations can then be written in the form


In the above, u is the velocity field, f is twice the angular velocity of the Earth, is a pressure term, lo
is the limiting mixing length, k is von Kármán's constant, 8 is the distance to the nearest obstacle and
 is the velocity gradient.
(Equation 1)and(2)have now to be solved subject to the following boundary conditions:
Top of domainA constant wind of Ug = (u g, v g, 0)which is in the prevailing direction is specified.
Far upstreamTwo alternatives have been investigated. The first, which gives quicker convergence, was to solve the problem without the building (i.e. the one-dimensional problem) and to use this as a fixed upstream velocity. The second was to insist on no variation in the x direction, this condition being more adaptable to the situation in which the ground topography is changed. However, virtually no differences in the solutions were observed between the two cases.
Far downstream All quantities are assumed to be independent of x, the horizontal coordinate in the planc of the model.
Ground. Standard atmospheric boundary-layer theory based on dimensional arguments associated with a constant stress layer predicts a logarithmic profile for the velocity with height, z. In this layer, the fluid velocity is horizontal and of constant direction. Its magnitude is given by

Here, the friction velocity,  , is a velocity representative of the surface stress, τ; k is von Kármán's constant (0.4) and ZO is the roughness length (10 4m for ice). Experiments (Reference KingKing, 1990) have shown this profile (Equation 6) is a good approximation for heights above several roughness lengths and below a few tens of metres at least (in the absence of obstructions such as the building). Near the ground, (Equation 6) is assumed to hold and this gives a boundary condition on the velocity. Some authors (e.g. Reference Pomeroy and GrayPomeroy and Gray, 1990) have given empirical expressions relating ZO to u*. in the presence of saltating snow and the incorporation of such a dependence will be considered in the future.
Building.The arguments involved in deriving the logarithmic velocity profile near the ground are also valid near the building, except in the vicinity of the corners. For the computations in this paper, a logarithmic boundary condition was used normal to the faces of the building; though some tests have been done with other conditions (such as no slip) and only very local differences have been observed. The roughness length for the building may be different to that for the ground.
(Equations 1)and(2)were solved using the SIMPLEC method. This method is a modification of the SIMPLE method of Reference PatankarPatankar (1980) Reference Van Doormaal and Raithbydue to Van Doormaal and Raithby (1984). It involves dividing the solution domain into rectangular cells (control volumes) and balancing momentum fluxes across the faces of the cells against volume forces and pressure gradients.
2.2. Particle field
The particle field is determined after the velocity field has been obtained. A steady solution for the snow-particle density is sought. Antarctic snow particles are not flakes but are roughly spherical, having a density of about 0.9 Mgm -3. They range in size up to 5 x 10 4m radius. Even at Antarctic temperatures, ice sublimes but, for simplicity, this effect will be neglected (though it may be included in the future) as it is not thought to have much effect on drift formation. In this case, there is no mechanism for snow particles to change size and so the particles are divided into classes according to their radii and a representative radius is associated with each class. The distributions of the different sizes of particle are then calculated independently. A fall velocity,W, is associated with each panicle size by balancing the viscous drag on a particle with its weight. This is done assuming the particles to be spherical, though observations (e.g. Reference Takahashi, Ohmae, Ishmikawa, katsushima and NishioTakahashi and others, 1984) have shown that non-spherical panicles fall considerably slower than spherical ones, and allowance for this may be made later. The distribution of particles is assumed to obey an advection–diffusion equation with diffusivity equal to that for the velocity field, namely

where n is the particle-number density and ez is the unit vertical vector. This is solved Subject to the following boundary conditions:
Top of domain. Particles from the ground are never lifted as high as 1500 m and hence only precipitating particles are to be found at this altitude. The situation without precipitation is considered in this paper, though its effect will be investigated later. A boundary condition of zero snow-particle density is therefore applied.
Far upstream. As for the velocity field, both the one-dimensional profile and vanishing x–derivative conditions have been used and the results are almost indistinguishable.
Far downstream. All quantities are assumed to be independent of x.
Ground. Reference BuddBudd (1966) assumed the logarithmic profile (Equation 6) for velocity (from which the eddy viscosity can be calculated), then solved the one-dimensional equivalent of (Equation 7) to obtain a power-law expression relating particle-number density with height, namely
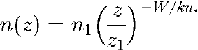
where nl is the particle-number density at some reference height Z1. The snow density in the saltation layer has been related to u*. by Reference PomeroyPomeroy (1988) and this is converted to a number density for a particular size range using an empirical size distribution (Reference Buddsee Budd (1966) and Reference Budd, Dingle and RadokSchmidt (1982)). This gives the boundary condition when we choose Z1. to be the top of the saltation layer. Empirical alternatives to (Equation 8) and to the relationship between u* and the particle-number density in the saltation layer (Reference Budd, Dingle and RadokBudd and others, 1966) have been proposed but data from the region support the above formulation (Reference DoverDover, 1993) for the conditions at Halley.
Building. It is not physically very clear what the boundary conditions at the building should be. On the vertical faces and underside of the building the condition used is that there should be no flux of particles into the building. Since there is no flow into the building, this manifests itself as no diffusion into the building, i.e. the normal derivative of n should vanish. On top of the building, this condition still implies a flux across the boundary as particles settle on to the building and are blown along it, re-entering the flow at the trailing edge. In order to model this, the flux on to the top of the building is estimated and an equal-source term is placed at the trailing edge. The particle-number density on top of the building is set equal to that far upstream. This is reasonable as, although this region is sheltered from snow rising from below, it has a greater input from upwind as the flow rises over the building. Tests have been performed using other boundary conditions which resulted in only local differences.
The equations arc solved using the tri-diagonal matrix algorithm (TDMA or Thomas method) on each vertical column of cells and sweeping through the columns from upstream to downstream.
2.3 Saltation layer and deposition flux
Near the ground, particles tend to skip along the ice surface. On impact, they may displace other particles and it is thought that this process is the main mechanism for the removal of snow from the ice surface in preference to wind drag. These skipping particles form a relatively dense layer a few centimetres high, known as the saltation layer, and panicles in this layer may be entrained into the turbulent flow above by eddies close to the ground. This process is opposed by gravitational settling into the saltation layer.
The calculation of the flux of snow on to the ground gives an indication of the shape of the drift that will form. The lowest cell is divided into the saltation layer and the main flow. Following (Reference Pomeroy and GrayPomeroy and Gray 1990), the horizontal mass flux in the whole saltation layer is given by

provided this is positive, and hence the fluxes in the saltation layer can be estimated using the size distributions mentioned with respect to the boundary condition at the ground. In this equation, u*t is the critical friction velocity below which no snow is raised into saltation, and g is the acceleration due to gravity.
The horizontal flux in the main flow is given by

The total horizontal flow into the bottom cell due to the main flow is calculated by integrating this expression using the logarithmic profile in (Equation 6) for u and the power-law profile in (Equation 8) for n.
The flux out of the top of the bottom cell is given by

and this is simply multiplied by the cell width to get the total flow rate as variations in x are slow.
The number flux from the ground is then obtained by balancing these fluxes, and the mass flux is obtained by summing over the various particle sizes.
3. Results
Table 1 gives the values of parameters used to simulate the accommodation building. Note that a high geos-trophic wind has been chosen to ensure drifting occurs.
Parameter values used in simulation of ACB
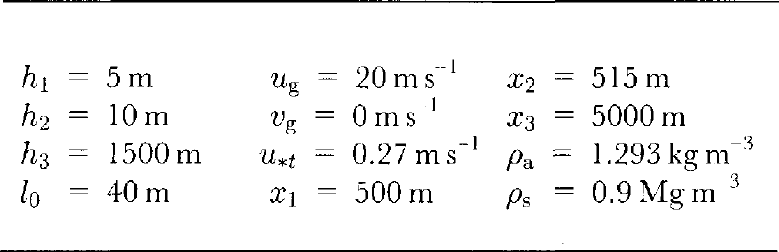
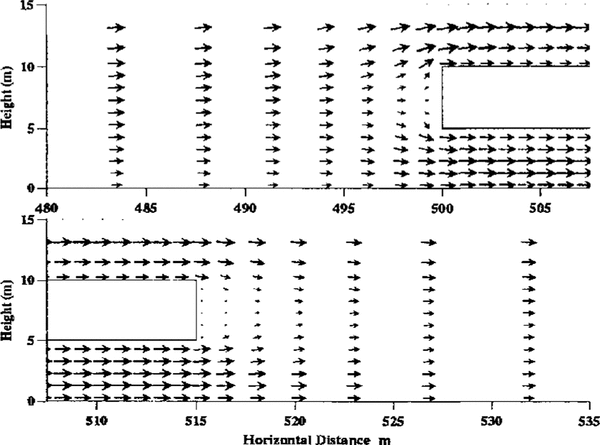
Figure 3 shows the velocity field near the bulding. In the interests of clarity, the arrows do not represent the full resolution of the model. The grid used had 40 cells upstream of the building, 30 cells along the building and 50 cells downstream, with ten cells below the building, ten in its height and 40 above the building. As expected, the flow divides upstream of the building and the flow beneath the building is accelerated to accommodate the increased volume flux. Downstream of the building, the fluid flow converges again behind a quiescent wake. With sufficient resolution in cell size, two eddies can be seen in this region, each being a few metres long. The small size of these eddies is due to the turbulence, which greatly increases the effective viscosity and hence reduces the Reynolds number
Velocity field near the building.

The friction-velocity, u* profile is shown as a function of x in Figure 4 Regions of high u*, correspond to high surface stress and hence high rates of erosion from the ground and increased saltation. It is seen that this occurs underneath the building, with low-stress regions just upwind and downwind.
Profile oj fiction velocity, u againstx near the building. The marks indicate the position oj the building.

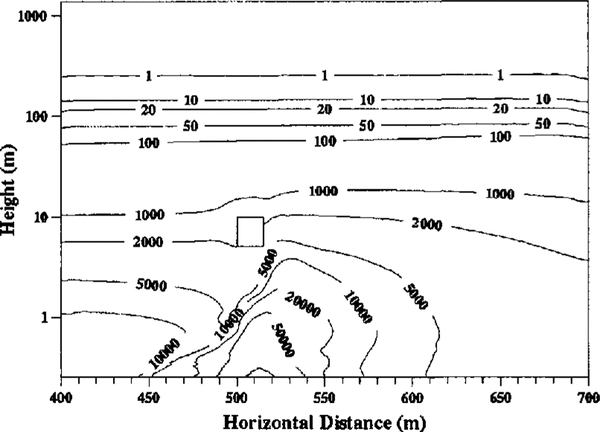
Figure 5 shows the particle-number density distribution for one size (4 × 10⁻⁵m to 5 × 10⁻⁵m radius) of panicle. It is observed that the number density decreases very rapidly with height and that particles are concentrated underneath and downwind of the building. This is expected as the increased surface stress removes particles from the ice sheet into the saltation layer underneath the building, from where they are carried downstream either in the saltation layer or after entrainment into the flow. Comparing distributions for different particle sizes shows that, as expected, the lighter the particle, the slower the decrease in its number density with height.
Snow-particle number density field for mid-sized particles. Contour values are in number of particles per cubic metre.
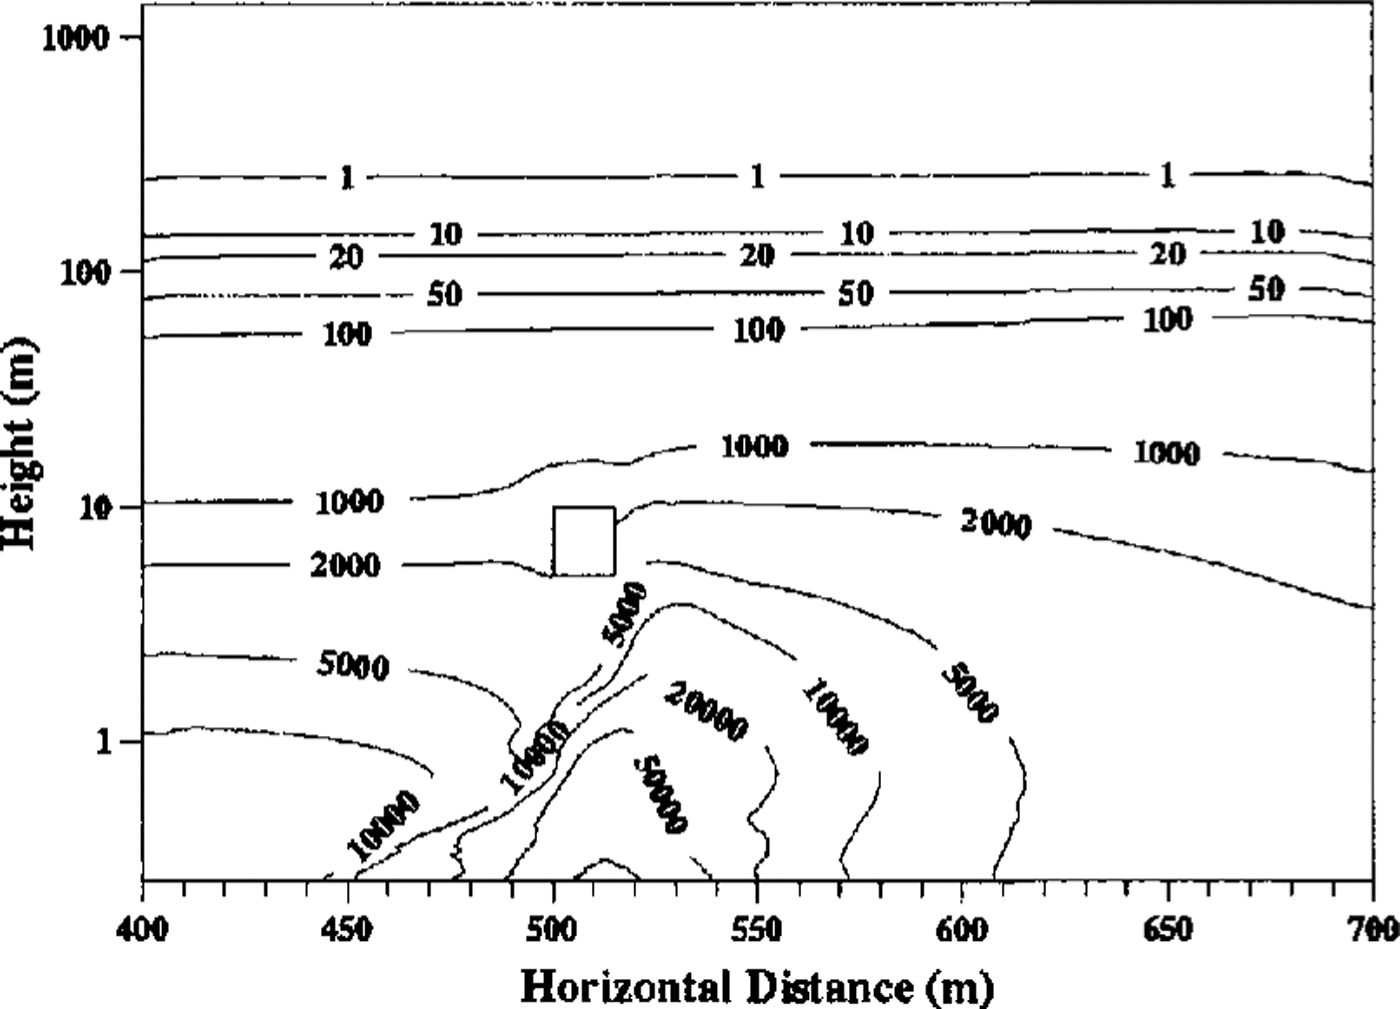
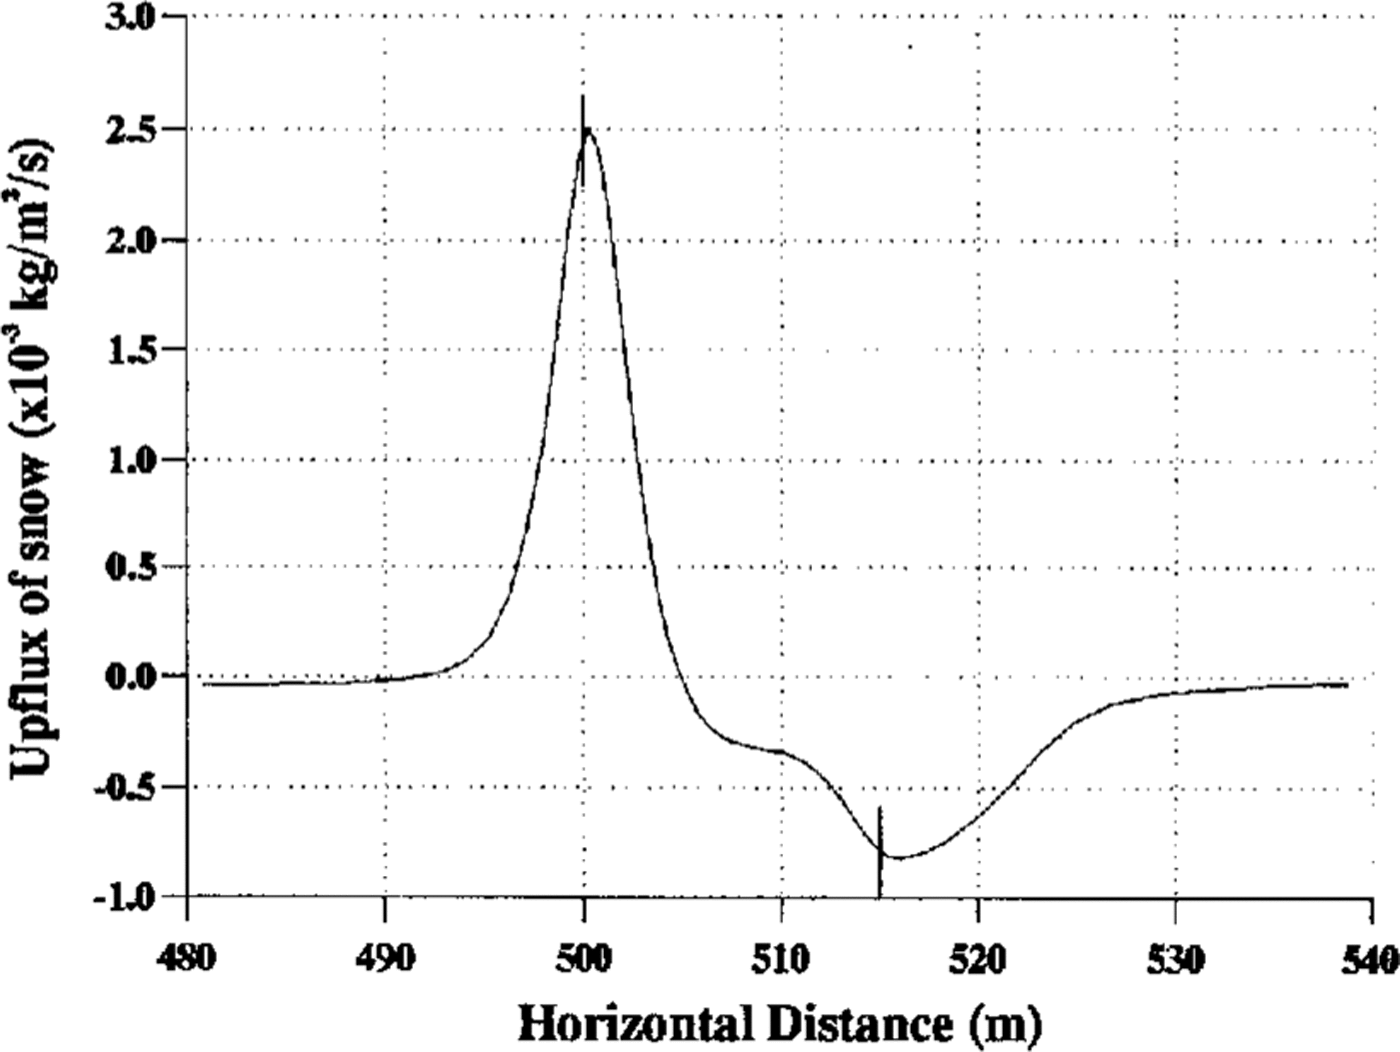
Figure 6 shows the upflux of snow from the ground as a function of x and its image in the horizontal axis gives a qualitative indication of the shape of drift formation. An erosive region is seen towards the leading edge of the building, followed by a large drift downwind. A much smaller drift exists upwind and is seen more clearly in Figure 7. It should be remembered that, although deposition of snow is uninhibited by previous deposition, the rate of erosion depends greatly on the age and hence compactness of the snow, so the upflux maxima and minima cannot be taken as an indication of the relative heights of the drift and eroded regions. The maximum rate of deposition on the downwind drift corresponds to an accumulation rate of 35 m year-1, which seems high until it is remembered that the geostrophic wind was chosen to be very high and that for most of the time, in practice, it is much lower.
Profile of snow upflux from the ground near the building. The marks indicate the position of the building.
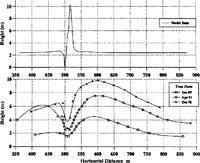
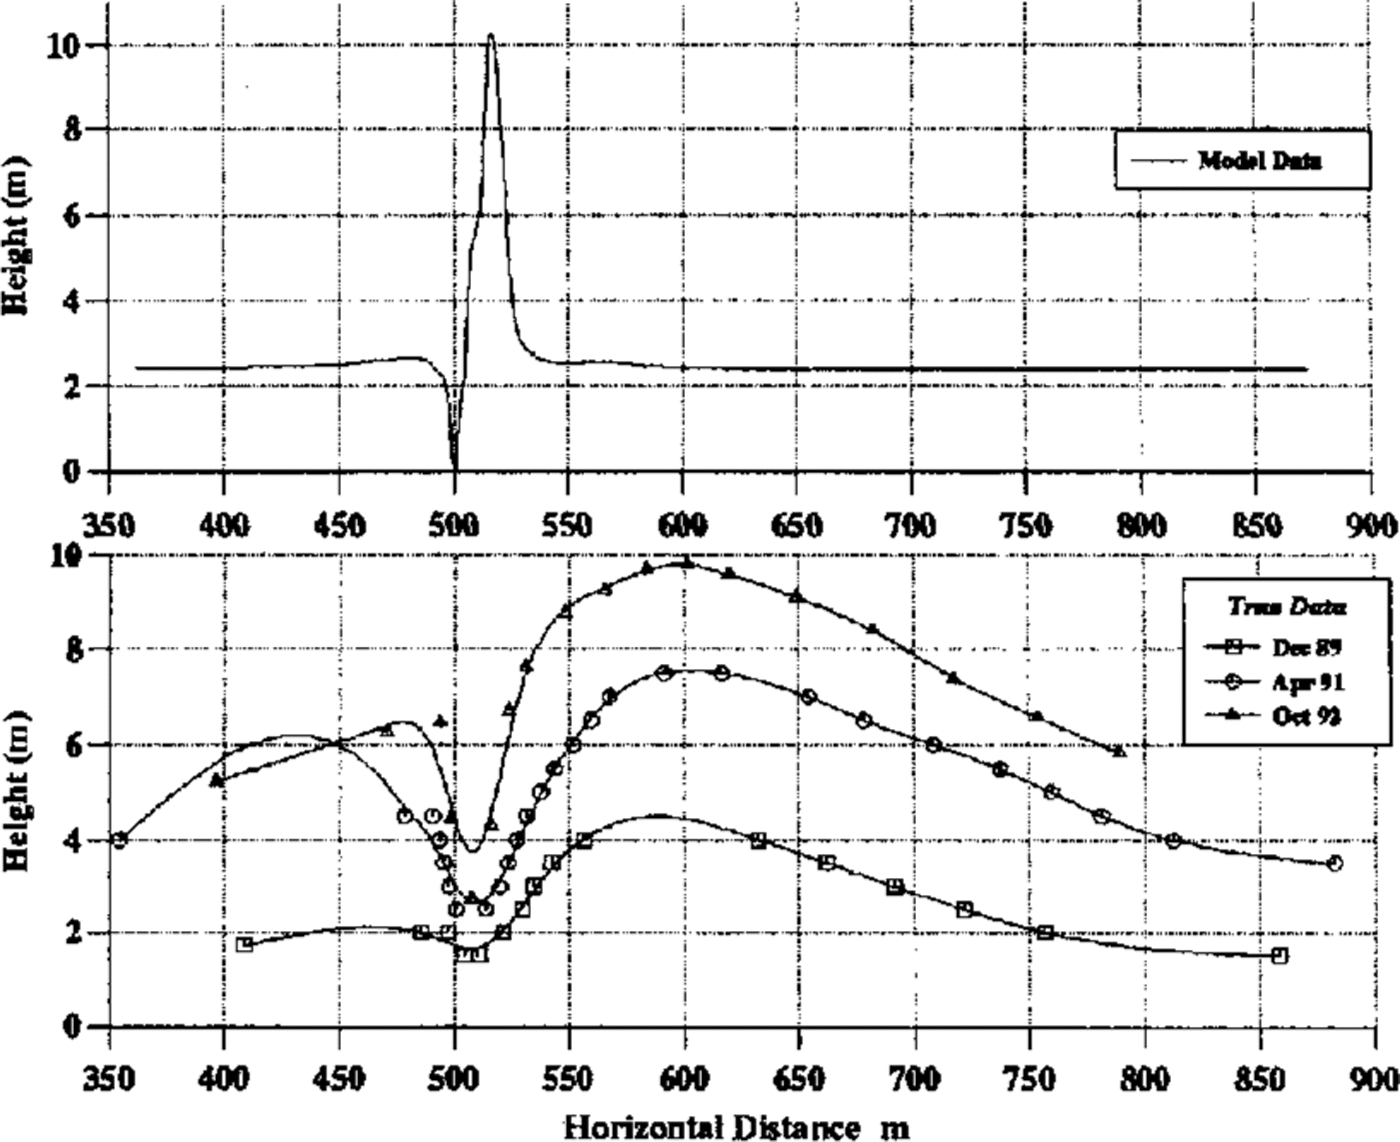
Comparison of model and real drift cross-sections. The building is between 500 and 515 m.
4. Comparison With Experimental Data
A model drift profile can be obtained by dividing the upflux profile by the density of settled snow and multiplying by the time elapsed. This assumes that the ground topography remains constant during this period. Deposition of snow and erosion of recently deposited snow are both much easier than erosion from an old, hard-packed surface and, for this reason, the eroded region is scaled down so that the ratio of drift height to erosive depth is similar to that observed in practice. An added complication is that side winds can play a major role in filling any scour holes that might develop, but no attempt is made to model this at present. In work at present being undertaken, this new ground topography becomes the model topography at the beginning of the next time step, and the new fluid flow and snow-density distributions over this topography are calculated in order to determine a modified upflux profile, and hence ground topographyFigure 7 compares the model profile with some data from Halley, these data being taken from poles placed along the symmetry line of the accommodation building (i.e. in the plane of the model). The time elapsed in calculating the model profile has been chosen to produce overall magnitudes similar to those observed in practice. An experiment is currently in progress around the ice and climate building in which wind speeds and particle counts are being measured at various points near the building and subsequent comparisons will use these data. The figure shows some qualitative agreement, in that both have a small upstream drift, followed by an eroded region and then a larger downstream drift. There are two main quantitative discrepancies.
Relative heights of driftsThe ratio of upstream- to downstream-drift heights in the model is around 5%, whilst in reality it is around 50%. This may be due to the fact that, although the prevailing wind is easterly, there is a secondary bias towards winds from the west and, at these times, the whole situation is reversed. It is noted that the relative drift heights are in a similar proportion to the modal frequencies in Figure I.
Position of drift peak. The distance of the peak of the downwind drift from the building in the model is only a few metres, whilst in reality it is around 100 m. From progressive (real) profiles, it is clearly seen that, as the drift builds up, its peak moves downwind. The model assumed a flat ground topography, which represents the situation immediately after the buildings were erected. It is hoped that, once the model has been adapted to cope with a partially formed drift as the lower–boundary topography, then subsequent upflux profiles will show progression of the peak downwind. It should also be noted that fill velocities have been calculated assuming spherical particles, and those for very irregular particles can be up to a factor of 2 smaller. This would result in increased lifting and greater downwind transport of snow before the particles settle, hence moving the drift peak downwind.
5. Conclusions
The model successfully predicts the qualitative properties of drift formation.
The rate of accumulation of snow seems reasonable. though more analysis of its dependence on wind strength and of the frequency distribution of wind strength and direction at Halley is required before a true comparison can be made.
Quantitative discrepancies in drift shape may be explained by the incorporation of wind-direction frequencies and by changes in ground topography with time.
The model described in this paper is part of continuing research in this subject area and more sophisticated models are being developed. Short-term aims are for the terrain-following model, and for improved turbulence models, such as the k;–E model.
Acknowledgements
Many thanks go to the U.K. SERC and the British Antarctic Survey for financial support, and to the latter for the use of their data from the Halley region.