I. INTRODUCTION
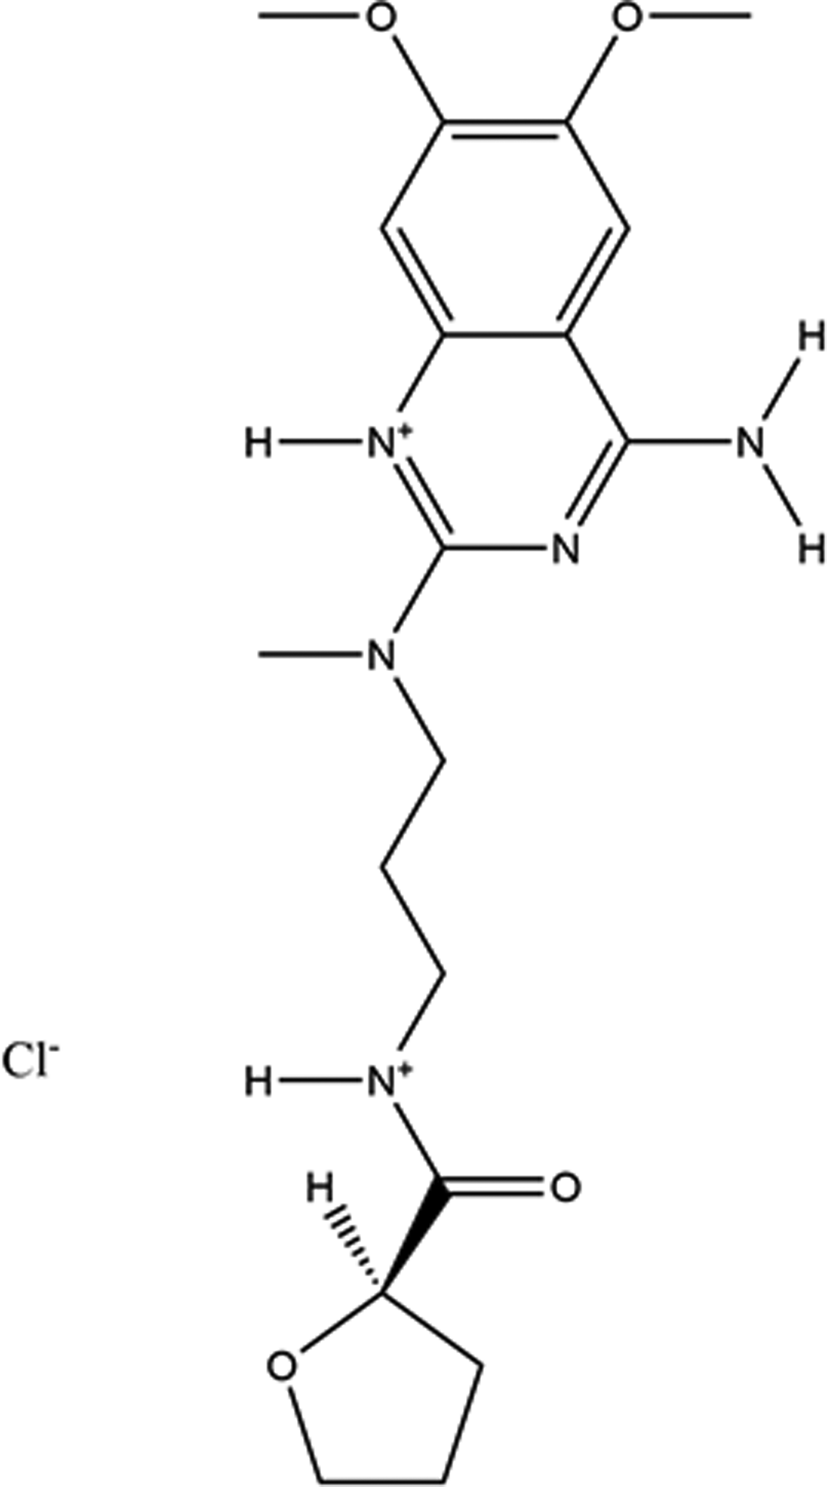
Alfuzosin hydrochloride (sold under the brand name Uroxatral®, among others) is used in men to treat symptoms of an enlarged prostate (benign prostatic hyperplasia or BPH), which include difficulty urinating (hesitation, dribbling, weak stream, and incomplete bladder emptying), painful urination, and urinary frequency and urgency. Alfuzosin is in a class of medications called alpha blockers. It works by relaxing the muscles in the prostate and bladder to allow urine to flow more easily (https://medlineplus.gov/druginfo/meds/a604002.html). The IUPAC name (CAS Registry Number 81403-68-1) is N-[3-[(4-amino-6,7-dimethoxyquinazolin-2-yl)-methylamino]propyl]oxolane-2-carboxamide hydrochloride. A two-dimensional molecular diagram is shown in Figure 1.
The 2D molecular structure of alfuzosin hydrochloride.

A star-quality powder pattern of “alfuzosin hydrochloride dihydrate” is included in the Powder Diffraction File (Gates-Rector and Blanton, Reference Gates-Rector and Blanton2019) as entry 00-060-1193 (Vickers, Reference Vickers2009). Alfuzosin hydrochloride dihydrate is claimed in US Patent 5,545,738 (Borrega and Kitamura, Reference Borrega and Kitamura1996; Synthelabo). Powder diffraction patterns of the alfuzosin hydrochloride dihydrate, trihydrate, and tetrahydrate, as well as for the anhydrous compound, are reported. A monohydrate is also mentioned, but no diffraction data are reported for it. Powder patterns for Form I and Form II of alfuzosin hydrochloride, as well as for an anhydrous crystalline form, are reported in International Patent Application WO 2006/090268 A2 (Joshi et al., Reference Joshi, Ramam and Rao2006; Glenmark Pharmaceuticals Ltd.). The powder pattern of a non-solvated crystalline form of alfuzosin hydrochloride is reported in International Patent Application WO 2007/063556 A2 (Satyanarayana Reddy et al., Reference Satyanarayana Reddy, Kishore Kumar, Kondal Reddy and Venkatesh2007; MSN Laboratories Ltd.). Powder patterns of crystalline Forms II, II, and IV, as well as anhydrous alfuzosin hydrochloride Form I are reported in US Patent Application 2007/0049756 A1 (Anumula et al., Reference Anumula, Alla, Madivada and Gilla2007; Dr. Reddy's Laboratories Inc.). Both a unit cell search of the cell of 00-060-1193 and a connectivity search in the Cambridge Structural Database (Groom et al., Reference Groom, Bruno, Lightfoot and Ward2016) yielded no hits for crystal structures of alfuzosin derivatives.
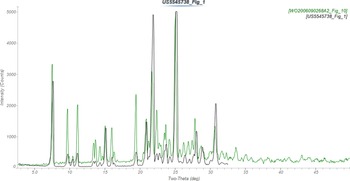
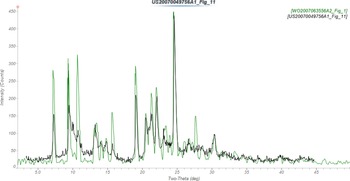
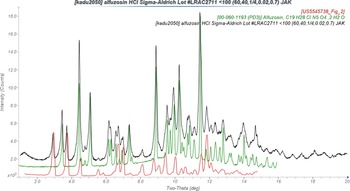
A cluster analysis of the patent patterns using PolySNAP 3 (Barr et al., Reference Barr, Dong and Gilmore2004) indicated that, although the anhydrous patterns from Synthelabo and Glenmark are similar (Figure 2), as well as the anhydrous Form I from Dr Reddy's and the non-solvated form from MSN (Figure 3), most of the forms are unique. The polymorph landscape of alfuzosin hydrochloride is rich. It is noteworthy that the PDF pattern 00-060-1193 for alfuzosin hydrochloride dihydrate does not match that reported by Synthelabo for the same compound (Figure 4).
Comparison of the powder pattern of anhydrous alfuzosin hydrochloride from US Patent 5,545,738 (Borrega and Kitamura, Reference Borrega and Kitamura1996; black) to that reported in WO 2006/090268 A2 (Joshi et al., Reference Joshi, Ramam and Rao2006; green). The published patterns (measured using CuKα radiation) were digitized using UN-SCAN-IT (Silk Scientific, 2013). Image generated using JADE Pro (MDI, 2021).

Comparison of the powder pattern of alfuzosin hydrchloride Form I from US Patent Application 2007/0049756 A1 (Anumula et al., Reference Anumula, Alla, Madivada and Gilla2007; black) to that of the non-solvated crystalline form of alfuzosin hydrochloride from International Patent Application WO 2007/063556 A2 (Satyanarayana Reddy et al., Reference Satyanarayana Reddy, Kishore Kumar, Kondal Reddy and Venkatesh2007; green). The published patterns (measured using CuKα radiation) were digitized using UN-SCAN-IT (Silk Scientific, 2013). Image generated using JADE Pro (MDI, 2021).

Comparison of the powder pattern of Sigma-Aldrich alfuzosin hydrochloride (measured using MoKα radiation; black) to those of “alfuzosin hydochloride dihydrate” from PDF entry 00-060-1193 (Vickers, Reference Vickers2009; green) and alfuzosin hydrochloride dihydrate from US Patent 5,545,738 (Borrega and Kitamura, Reference Borrega and Kitamura1996; red). The published patterns (measured using CuKα radiation) were digitized using UN-SCAN-IT (Silk Scientific, 2013) and converted to MoKα using JADE Pro (MDI, 2021). Image generated using JADE Pro (MDI, 2021).

II. EXPERIMENTAL
An alfuzosin molecule was downloaded from PubChem (Kim et al., Reference Kim, Chen, Cheng, Gindulyte, He, He, Li, Shoemaker, Thiessen, Yu, Zaslavsky, Zhang and Bolton2019) as Conformer3D_CID_2092.sdf. It was converted to a .mol2 file using Mercury (Macrae et al., Reference Macrae, Sovago, Cottrell, Galek, McCabe, Pidcock, Platings, Shields, Stevens, Towler and Wood2020) and to a Fenske–Hall Z-matrix using Open Babel (O'Boyle et al., Reference O'Boyle, Banck, James, Morley, Vandermeersch and Hutchison2011).
PDF entry 00-060-1193 includes the raw data. The pattern was indexed on a primitive triclinic unit cell, which was converted into the reduced cell of a = 9.321, b = 9.399, c = 12.567 Å, α = 108.01, β = 100.18, γ = 90.38° using the tools in the database. Since the cell volume corresponded to Z = 2, the space group was assumed to be P-1. The structure was solved using Monte Carlo simulated annealing techniques as implemented in EXPO2014 (Altomare et al., Reference Altomare, Cuocci, Giacovazzo, Moliterni, Rizzi, Corriero and Falcicchio2013) with alfuzosin, a Cl atom, and 2 O atoms as fragments. One of the O atoms was too close to the cation and was discarded, suggesting that the compound was in fact a monohydrate. The further work described below (using more-extensive data) demonstrated that the compound of this PDF entry was actually anhydrous. Published NMR data suggested that N6 was protonated (Ashour et al., Reference Ashour, Chehna and Bayram2006), so a hydrogen atom was added to that atom. The limited data extent (2θ max = 35° with CuKα radiation) resulted in a modest-quality refinement, with a poorer agreement with a DFT optimization than is typical for correct structures.
A sample of alfuzosin hydrochloride was purchased from Sigma-Aldrich (Lot #LRAC2711) to obtain a more-extensive data set. The pattern (measured from a 0.7 mm diameter capillary specimen on PANalytical Empyrean diffractometer equipped with an incident-beam focusing mirror and an X'Celerator detector from 1 to 50° 2θ, 0.0083557° steps, 4 sec/step, 1/ 4° divergence slit, 0.02 radian Soller slits, using MoKα radiation; Figure 4) revealed that the sample was a mixture – of PDF entry 00-060-1193 (which appeared to be the monohydrate, but is really anhydrous) and the dihydrate from Figure 2 of US Patent 5,545,738.
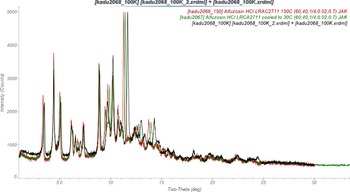
The dihydrate peaks could be eliminated by heating a 0.7 mm capillary specimen at 423 K in an Oxford Cryostream Plus. The same specimen was measured in situ at 423, 301, and 100 K (Figure 5). Visual inspection showed that changes in lattice parameters were anisotropic. Initial Rietveld refinements using the three data sets indicated that the fractional occupancy of the water molecule was approximately 0.3, 0.2, and 0.1 at 100, 301, and 423 K respectively – but that the water molecule moved to a position unreasonably-close to the alfuzosin cation. Anhydrous alfuzosin hydrochloride was thus prepared by heating at 423 K.
Comparison of the powder patterns of anhydrous alfuzosin hydrochloride, measured at 100 K (black), 301 K (green), and 423 K (red). Image generated using JADE Pro (MDI, 2021).

Analysis of potential N–H⋯Cl hydrogen bonds in the refined structure suggested that N7 was protonated, and H58 was added there. In the DFT-optimized structure, the Cl56⋯N7 and Cl56⋯N9 distances were similar, so the possibility that the extra proton was on N9 was also examined. The N9 structure was 43.5 kJ mol−1 higher in energy, so the proton seems to reside on N7, and this structure is the one discussed here.
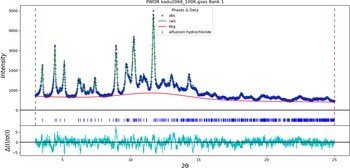
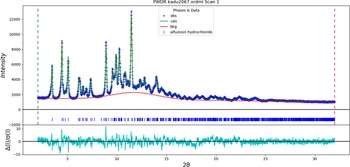
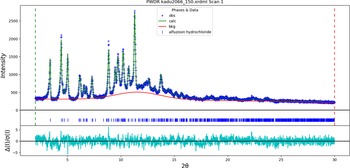
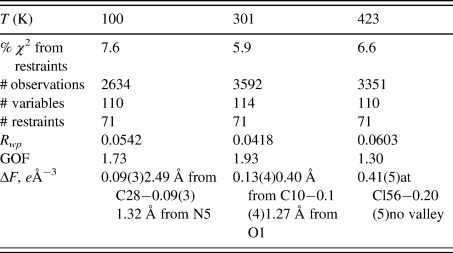
Rietveld refinements were carried out using GSAS-II (Toby and Von Dreele, Reference Toby and Von Dreele2013). All non-H-bond distances and angles were subjected to restraints, based on a Mercury/Mogul Geometry Check (Bruno et al., Reference Bruno, Cole, Kessler, Luo, Motherwell, Purkis, Smith, Taylor, Cooper, Harris and Orpen2004; Sykes et al., Reference Sykes, McCabe, Allen, Battle, Bruno and Wood2011). The Mogul average and standard deviation for each quantity were used as the restraint parameters. The hydrogen atoms were included in calculated positions, which were recalculated during the refinement using Materials Studio (Dassault, 2021). The Uiso of the heavy atoms were grouped by chemical similarity. The Uiso for the H atoms were fixed at 1.3× the Uiso of the heavy atoms to which they are attached. The peak profiles were described using the isotropic microstrain model. The background was modeled using a 3-term shifted Chebyshev polynomial, along with a peak to model the scattering from the glass capillary and any amorphous component. The final refinements yielded the residuals reported in Table I. The largest errors in the difference plots (Figures 6–8) are small and exhibit no clear patterns.
The Rietveld plot for the refinement of alfuzosin hydrochloride at 100 K. The blue crosses represent the observed data points, and the green line is the calculated pattern. The cyan curve is the normalized error plot, and the red line is the background curve.

The Rietveld plot for the refinement of alfuzosin hydrochloride at 301 K. The blue crosses represent the observed data points, and the green line is the calculated pattern. The cyan curve is the normalized error plot, and the red line is the background curve.

The Rietveld plot for the refinement of alfuzosin hydrochloride at 423 K. The blue crosses represent the observed data points, and the green line is the calculated pattern. The cyan curve is the normalized error plot, and the red line is the background curve.

Refinement residuals for alfuzosin hydrochloride

The crystal structure at all three temperatures was optimized using VASP (Kresse and Furthmüller, Reference Kresse and Furthmüller1996) (fixed experimental unit cells) through the MedeA graphical interface (Materials Design, 2016). The calculations were carried out on 16 2.4 GHz processors (each with 4 Gb RAM) of a 64-processor HP Proliant DL580 Generation 7 Linux cluster at North Central College. The calculations used the GGA-PBE functional, a plane wave cutoff energy of 400.0 eV, and a k-point spacing of 0.5 Å−1 leading to a 2 × 2 × 2 mesh. Single-point density functional calculations (fixed experimental cells) and population analyses were carried out using CRYSTAL17 (Dovesi et al., Reference Dovesi, Erba, Orlando, Zicovich-Wilson, Civalleri, Maschio, Rerat, Casassa, Baima, Salustro and Kirtman2018). The basis sets for the H, C, N, and O atoms in the calculation were those of Gatti et al. (Reference Gatti, Saunders and Roetti1994), and that for Cl was that of Peintinger et al. (Reference Peintinger, Vilela Oliveira and Bredow2013). The calculations were run on a 3.5 GHz PC using 8 k-points and the B3LYP functional.
Attempts to index the pattern of alfuzosin hydrochloride dihydrate from US 5,545,738 (Figure 2) and ten resolved peaks for this phase from the Sigma-Aldrich mixture both yielded primitive orthorhombic unit cells having a ~ 27.5 and b ~ 11.9 Å, but the c-axis was short, varying from 3.1 to 4.9 Å. While the 4.9 Å cell yielded a reasonable Le Bail fit to the pattern of the mixture, ultimately there is not enough information currently to characterize this phase adequately. The patent patterns for the trihydrate and tetrahydrate were too poor to obtain any plausible unit cells.
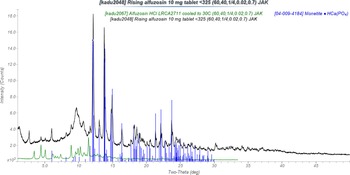
A 10 mg alfuzosin tablet (Uroxatral®) from Rising Pharmaceuticals was ground in a mortar and pestle and sieved to <325 mesh. The tablets weigh 360 mg, so the concentration of API is 2.8%. The product literature indicates that the tablets also contain: carbomer homopolymer type b (cross-linked allyl sucrose), silicon dioxide, anhydrous dibasic calcium phosphate, hydrogenated cottonseed oil, hypromellose 2208, hypromellose 2910, magnesium stearate, povidone k30, propylene glycol, and titanium dioxide – most of which are poorly-crystalline. The powder pattern (measured from a 0.7 mm diameter capillary specimen on PANalytical Empyrean diffractometer equipped with an incident-beam focusing mirror and an X'Celerator detector from 1–50° 2θ, 0.0083557° steps, 4 sec/step, 1/4° divergence slit, 0.02 radian Soller slits, using MoKα radiation (Figure 9) indicated that the major phase was monetite (04-009-4184), CaHPO4 and that anhydrous alfuzosin hydrochloride was present. (The package contained a desiccant.)
The powder pattern of a 10 mg alfuzosin hydrochloride tablet (black) from Rising Pharmaceuticals, showing the presence of monetite (blue sticks) and anhydrous alfuzosin hydrochloride (green). Image generated using JADE Pro (MDI, 2021).

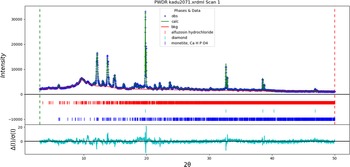
Another tablet was ground, sieved to <325 mesh, and blended by hand until the color was uniform with 32.3 wt% Alfa-Aesar 40–60 μm diamond powder as an internal standard. The three crystalline phases monetite, alfuzosin hydrochloride, and diamond were included in a Rietveld refinement (Figure 10). The background was described by a 6-term shifted Chebyshev polynomial, as well as three peaks: one at 9.99° 2θ to describe mainly the scattering from the capillary, and two others at 9.70 and 13.21° to model scattering from the excipients, probably the croscarmellose sodium and polyvinylpyrrolidone. By the normal statistical measures, a good refinement was obtained: Rwp = 0.03855 and GOF = 1.96. The largest errors in the fit are at the diamond peaks, particularly in the ratio of the Kα 1 and Kα 2 peaks. This observation suggests that this phase suffered from granularity and that some optimization will be necessary to choose the best diamond internal standard. Other errors occur at monetite peaks and suggest that this phase is anisotropic in some way.
The Rietveld plot for the refinement of an alfuzosin hydrochloride tablet with a diamond internal standard at 301 K. The blue crosses represent the observed data points, and the green line is the calculated pattern. The cyan curve is the normalized error plot, and the red line is the background curve. The rows of blue, cyan, and red tick marks indicate the calculated reflection positions for monetite, diamond, and alfuzosin hydrochloride, respectively.

The refined scale factors yielded the quantitative phase analysis: 29.6(1) % monetite, 2.4(1)% alfuzosin hydrochloride, and 68.9(2)% “amorphous”, which includes everything not included in the Rietveld model, including the semi-crystalline excipients. The absolute error in the alfuzosin hydrochloride concentration is −0.4 wt%, which might be considered an excellent result. The difference, however, corresponds to a relative concentration error of 14%, which might not be considered acceptable. Perhaps a PONKCS analysis might be a better way to approach quantitative analysis of such a complex system with many poorly-crystalline excipients, but such an analysis requires pure reference samples of all of the components.
III. RESULTS AND DISCUSSION
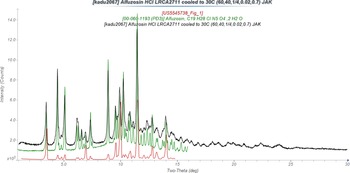
The pattern of anhydrous alfuzosin hydrochloride agrees well with that of “alfuzosin hydrochloride dihydrate” from PDF entry 00-060-1193 (Figure 11). It exhibits some similarities to that of anhydrous alfuzosin hydrochloride from US 5,545,738 Figure 1, but it is not clear if the two patterns represent the same material. Anhydrous alfuzosin hydrochloride accounts for the API peaks in a commercial formulation, despite this phase being previously described as “alfuzosin hydrochloride dihydrate”.
Comparison of the powder pattern of anhydrous alfuzosin hydrochloride (measured using MoKα radiation at 301 K; black) to those of “alfuzosin hydrochloride dihydrate” from PDF entry 00-060-1193 (Vickers, Reference Vickers2009; green) and anhydrous alfuzosin hydrochloride from US Patent 5,545,738 (Borrega and Kitamura, Reference Borrega and Kitamura1996; red). The published patterns (measured using CuKα radiation) were digitized using UN-SCAN-IT (Silk Scientific, 2013) and converted to MoKα using JADE Pro (MDI, 2021). Image generated using JADE Pro (MDI, 2021).

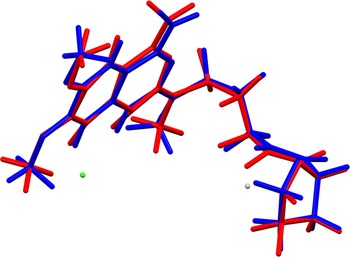
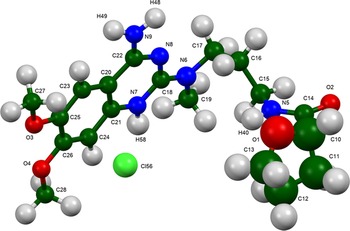
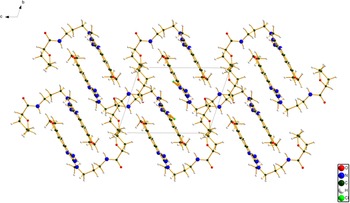
The root-mean-square Cartesian displacement between the room-temperature Rietveld-refined and DFT-optimized structures is 0.144 Å (Figure 12), within the normal range for correct structures (van de Streek and Neumann, Reference van de Streek and Neumann2014). This discussion concentrates on the DFT-optimized structures, especially at 301 K. The asymmetric unit (with atom numbering) is illustrated in Figure 13. The best view of the crystal structure is down the a-axis (Figure 14). The crystal structure is characterized by a stack of parallel planar fused rings along the b-axis, and layers of the more-corrugated portion of the molecule parallel to the ab-plane. The plane of the fused ring system is 1(−9)(13).
Comparison of the Rietveld-refined (red) and VASP-optimized (blue) structures of the cation in alfuzosin hydrochloride. The rms Cartesian displacement is 0.144 Å.

The asymmetric unit of alfuzosin hydrochloride with the atom numbering. The atoms are represented by 50% probability spheroids. Image generated using Mercury (Macrae et al., Reference Macrae, Sovago, Cottrell, Galek, McCabe, Pidcock, Platings, Shields, Stevens, Towler and Wood2020).

The crystal structure of alfuzosin hydrochloride, viewed down the a-axis. Image generated using Diamond (Crystal Impact, 2022).

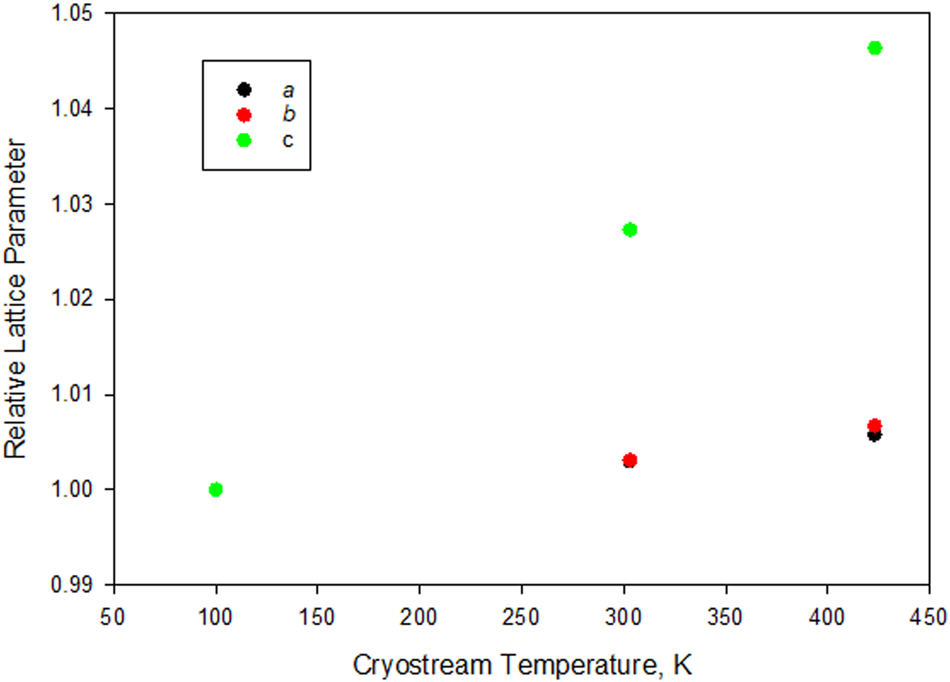
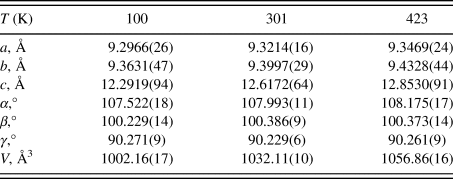
The thermal expansion of alfuzosin hydrochloride is anisotropic (Table II and Figure 15). The expansion along the c-axis is approximately 8× greater than that along a and b, which are comparable. Given the stacking of the molecules, it seems visually reasonable that the intermolecular interactions along the c-axis would be weaker.
Thermal expansion of alfuzosin hydrochloride.

Thermal expansion of alfuzosin hydrochloride.

Space group P-1.
All of the bond distances and angles fall within the normal ranges indicated by a Mercury Mogul Geometry check (Macrae et al., Reference Macrae, Sovago, Cottrell, Galek, McCabe, Pidcock, Platings, Shields, Stevens, Towler and Wood2020). Only the C17–C16–C15–N5 torsion angle of −154.6° is flagged as unusual. This angle lies on the tail of a minor trans population of a mainly gauche distribution of similar torsion angles. This torsion angle relates the two halves of the molecule, so its unusual value indicates that solid-state interactions may be important in determining the molecular conformation.
Quantum chemical geometry optimization of the alfuzosin cation (DFT/B3LYP/6-31G*/water) using Spartan ‘18 (Wavefunction, 2020) indicated that the observed solid-state conformation is 7.6 kcal mol−1 higher in energy than the local minimum-energy conformation of an isolated cation. Although the overall shapes are similar, the angle between the two halves of the molecule is smaller in the solid state. The global minimum-energy conformation is 13.8 kcal mol−1 lower in energy, and contains an intramolecular N14–H35⋯O2 hydrogen bond; the molecule folds onto itself. This difference shows that cation–anion and inter-cation interactions are important in determining the observed solid-state conformation.
Analysis of the contributions to the total crystal energy of the structure using the Forcite module of Materials Studio (Dassault, 2021) suggests that bond, angle, and torsion distortion terms contribute about equally to the intramolecular deformation energy. The intermolecular energy is dominated by electrostatic attractions, which in this force field analysis also includes hydrogen bonds. The hydrogen bonds are better analyzed using the results of the DFT calculation.
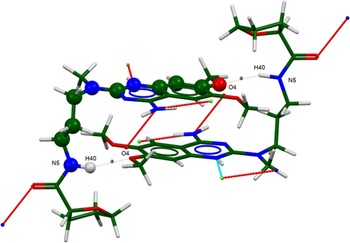
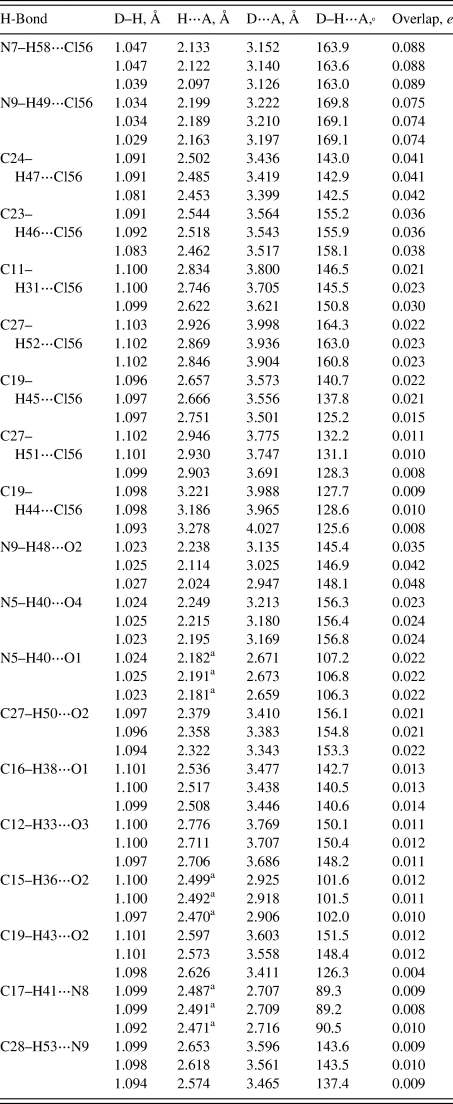
Hydrogen bonds are prominent in the structure (Table III). As expected, there are strong N–H⋯Cl hydrogen bonds. Both the protonated N7–H58 and the neutral N9–H49 act as donors in discrete hydrogen bonds to Cl56. The amino group N9–H48 also acts as a donor to the carbonyl group O2. The N–H⋯Cl hydrogen bonds link the fragments along the a-axis, and the N9–H48⋯O2 H-bonds link these chains parallel to the c-axis. N5–H40⋯O4 hydrogen bonds link the cations into dimers (Figure 16), with a graph set (Etter, Reference Etter1990; Bernstein et al., Reference Bernstein, Davis, Shimoni and Chang1995; Shields et al., Reference Shields, Raithby, Allen and Motherwell2000) R2,2(24) > a > a. N5–H40 also acts as a donor in an intramolecular hydrogen bond to the ether oxygen atom O1. Seven C–H⋯Cl hydrogen bonds contribute to determining the location of the chloride anion, and C–H⋯O and C–H⋯N hydrogen bonds also contribute to the lattice energy. The C11–H31⋯Cl56, N9–H48⋯O2, and C19–H43⋯O2 hydrogen bonds vary significantly with temperature.
The dimers are generated by the N5–H40⋯O4 hydrogen bonds. The graph set is R2,2(24) > a > a, showing that the pattern contains 24 atoms, 2 donors, and 2 acceptors, and that the sense of the donor⋯acceptor pair is the same for each pair. Image generated by Mercury (Macrae et al., Reference Macrae, Sovago, Cottrell, Galek, McCabe, Pidcock, Platings, Shields, Stevens, Towler and Wood2020).

Hydrogen bonds (CRFYSTAL17) in alfuzosin hydrochloride.

Top = 423 K, middle = 301 K, bottom = 100 K.
a Intramolecular.
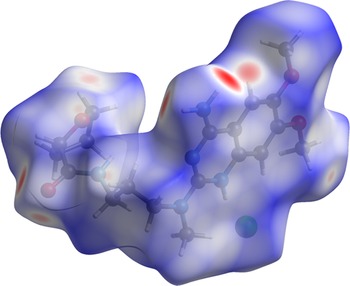
The volume enclosed by the Hirshfeld surface (Figure 17, Hirshfeld, Reference Hirshfeld1977; Turner et al., Reference Turner, McKinnon, Wolff, Grimwood, Spackman, Jayatilaka and Spackman2017) is 507.10 Å3, 98.26% of 1/2 the unit cell volume. The packing density is thus fairly typical. The only significant close contacts (red in Figure 17) involve the hydrogen bonds. The volume/non-hydrogen atom is normal, at 17.8 Å3.
The Hirshfeld surface of alfuzosin hydrochloride. Intermolecular contacts longer than the sums of the van der Waals radii are colored blue, and contacts shorter than the sums of the radii are colored red. Contacts equal to the sums of radii are white. Image generated by CrystalExplorer17 (Turner et al., Reference Turner, McKinnon, Wolff, Grimwood, Spackman, Jayatilaka and Spackman2017).

The Bravais–Friedel–Donnay–Harker (Bravais, Reference Bravais1866; Friedel, Reference Friedel1907; Donnay and Harker, Reference Donnay and Harker1937) morphology suggests that we might expect plate-like morphology for alfuzosin hydrochloride, with {001} as the principal faces. The [001] direction is the direction of the largest thermal expansion and weakest intermolecular interactions, so the anisotropy is reasonable. A second-order spherical harmonic model was included in the refinements. The texture indices varied from 1.004 to 1.009, indicating that the preferred orientation was slight for these rotated capillary specimens.
IV. DEPOSITED DATA
The Crystallographic Information Framework (CIF) files containing the results of the Rietveld refinements (including the raw data) and the DFT geometry optimizations were deposited with the ICDD. The data can be requested at info@icdd.com.
ACKNOWLEDGMENT
I thank Naveen Divakaruni of Advocate Aurora Healthcare for motivating this study.
CONFLICT OF INTEREST
The author has no conflicts of interest to declare.