Background
A substantial body of evidence indicates abnormal brain morphology in those with a psychotic illness (Karlsgodt et al. Reference Karlsgodt, Sun and Cannon2010). Reduced cortical gray-matter volume is among the most commonly reported abnormality in this population (Ellison-Wright & Bullmore, Reference Ellison-Wright and Bullmore2010; Bora et al. Reference Bora, Fornito, Radua, Walterfang, Seal, Wood, Yücel, Velakoulis and Pantelis2011; De Peri et al. Reference De Peri, Crescini, Deste, Fusar-Poli, Sacchetti and Vita2012). Cortical gray-matter volume is a composite measure comprised of cortical thickness and total cortical surface area. Further, total cortical surface area is the sum of the area of the gyral surface of the cortex and the area of the cortex within the sulci and is therefore influenced by the degree cortical folding or gyrification. The use of gray-matter volume as an index of cortical integrity can obscure potentially important abnormalities in these three underlying components.
The three components of the cortex show distinct maturational patterns (Giedd & Rapoport, Reference Giedd and Rapoport2010; Raznahan et al. Reference Raznahan, Shaw, Lalonde, Stockman, Wallace, Greenstein, Clasen, Gogtay and Giedd2011). Maximum gyrification is achieved before 2 years of age whereas surface area and cortical thickness peak shortly before puberty (Giedd & Rapoport, Reference Giedd and Rapoport2010; Zilles et al. Reference Zilles, Palomero-Gallagher and Amunts2013). All three measures show a shallow global reduction during adolescence and early adulthood (Raznahan et al. Reference Raznahan, Shaw, Lalonde, Stockman, Wallace, Greenstein, Clasen, Gogtay and Giedd2011) but changes may accelerate during later adulthood (Bonnici et al. Reference Bonnici, Moorhead, Stanfield, Harris, Owens, Johnstone and Lawrie2007; Palaniyappan et al. Reference Palaniyappan, Mallikarjun, Joseph, White and Liddle2011; Lemaitre et al. Reference Lemaitre, Goldman, Sambataro, Verchinski, Meyer-Lindenberg, Weinberger and Mattay2012) and may be observed in specific cortical regions in younger samples (Sun et al. Reference Sun, Stuart, Jenkinson, Wood, McGorry, Velakoulis, van Erp, Thompson, Toga, Smith, Cannon and Pantelis2009; Palaniyappan et al. Reference Palaniyappan, Mallikarjun, Joseph, White and Liddle2011, Reference Palaniyappan, Crow, Hough, Voets, Liddle, James, Winmill and James2013a , b). This developmental variability suggests that the timing of any disruption to cortical maturation may differentially affect the three measures. The early maturation of gyrification suggests that abnormalities in this measure may reflect pre- or perinatal adverse events. On the other hand, the development of surface area throughout childhood and relative stability thereafter suggests abnormali-ties reflect either obstetrical or childhood influences. Finally, the sensitivity of cortical thickness to environmental influences (Merkley et al. Reference Merkley, Bigler, Wilde, McCauley, Hunter and Levin2008; Habets et al. Reference Habets, Marcelis, Gronenschild, Drukker and van Os2011) suggests that this measure may be a poor index of obstetrical complications (OCs).
The cognitive, behavioral and psychiatric consequences of OCs are well documented (Rees & Inder, Reference Rees and Inder2005; Gluckman et al. Reference Gluckman, Hanson, Cooper and Thornburg2008; Volpe, Reference Volpe2012). Two distinct complications that are associated with an increased risk for psychosis are intra-uterine growth retardation (IUGR) and perinatal hypoxia. The consequences of these two complications can be developmentally similar but neuroanatomically distinct (Rees & Inder, Reference Rees and Inder2005; Volpe, Reference Volpe2012). IUGR can result from a range of factors during gestation and is associated with reduced brain growth. Some (Hultman et al. Reference Hultman, Sparen, Takei, Murray and Cnattingius1999; Dalman et al. Reference Dalman, Thomas, David, Gentz, Lewis and Allebeck2001; Gunnell et al. Reference Gunnell, Rasmussen, Fouskakis, Tynelius and Harrison2003) but not all (Jones et al. Reference Jones, Rantakallio, Hartikainen, Isohanni and Sipila1998; Ichiki et al. Reference Ichiki, Kunugi, Takei, Murray, Baba, Arai, Ohshima, Okagami, Sato, Hirose and Nanko2000) studies suggest IUGR increases the risk for psychosis. Perinatal hypoxia can also result from a range of factors but exerts its influence on the fully developed neonatal brain. Several studies suggest an increased risk for psychosis in those who experienced perinatal hypoxia (Zornberg et al. Reference Zornberg, Buka and Tsuang2000; Clarke et al. Reference Clarke, Harley and Cannon2006; Byrne et al. Reference Byrne, Agerbo, Bennedsen, Eaton and Mortensen2007).
Studies of pediatric populations indicate an association between slow fetal growth and a range of neurodevelopmental difficulties (Indredavik et al. Reference Indredavik, Vik, Heyerdahl, Kulseng and Brubakk2005; Schlotz & Phillips, Reference Schlotz and Phillips2009). This risk is not limited to significantly low birthweight (<2500 g) but appears to operate across the full range of weights (Haukvik et al. Reference Haukvik, Rimol, Roddey, Hartberg, Lange, Vaskinn, Melle, Andreassen, Dale and Agartz2013). Perinatal hypoxia is also associated with developmental problems (Zornberg et al. Reference Zornberg, Buka and Tsuang2000; Dalman et al. Reference Dalman, Thomas, David, Gentz, Lewis and Allebeck2001; Lindström et al. Reference Lindström, Lagerroos, Gillberg and Fernell2006; Millichap, Reference Millichap2008). Relatively brief periods of perinatal hypoxia may result in neuronal death, white- and gray-matter damage and reduced neuronal growth (Rees & Inder, Reference Rees and Inder2005; Volpe, Reference Volpe2012). This can lead to developmental delays and cognitive impairment in the absence of gross structural brain abnormalities and motor disorders (Rennie et al. Reference Rennie, Hagmann and Robertson2007). Both slow fetal growth and perinatal hypoxia are associated with cortical abnormalities (Rees & Inder, Reference Rees and Inder2005; Volpe, Reference Volpe2012). What is less clear is which aspects of cortical morphology are affected by these two complications and whether or not these complications differ in the effect they have on cortical morphology. Pediatric studies that have investigated cortical morphology indicate an association between slow fetal growth and reductions in cortical gray-matter volume, cortical surface area and gyrification but not global cortical thickness (Martinussen et al. Reference Martinussen, Fischl, Larsson, Skranes, Kulseng, Vangberg, Vik, Brubakk, Haraldseth and Dale2005; Dubois et al. Reference Dubois, Benders, Borradori-Tolsa, Cachia, Lazeyras, Leuchter, Sizonenko, Warfield, Mangin and Huppi2008; De Bie et al. Reference De Bie, Oostrom, Boersma, Veltman, Barkhof, Delemarre-van de Waal and van den Heuvel2011; Raznahan et al. Reference Raznahan, Greenstein, Lee, Clasen and Giedd2012; Walhovd et al. Reference Walhovd, Fjell, Brown, Kuperman, Chung, Hagler, Roddey, Erhart, McCabe, Akshoomoff, Amaral, Bloss, Libiger, Schork, Darst, Casey, Chang, Ernst, Frazier, Gruen, Kaufmann, Murray, van Zijl, Mostofsky and Dale2012). There have been relatively few studies of these associations in patients with psychosis.
Patients with psychosis show reductions in cortical surface area both regionally (Goghari et al. Reference Goghari, Rehm, Carter and MacDonald2007; Voets et al. Reference Voets, Hough, Douaud, Matthews, James, Winmill, Webster and Smith2008; Gutierrez-Galve et al. Reference Gutierrez-Galve, Wheeler-Kingshott, Altmann, Price, Chu, Leeson, Lobo, Barker, Barnes, Joyce and Ron2010; Rimol et al. Reference Rimol, Nesvag, Hagler, Bergmann, Fennema-Notestine, Hartberg, Haukvik, Lange, Pung, Server, Melle, Andreassen, Agartz and Dale2012) and globally (Palaniyappan et al. Reference Palaniyappan, Mallikarjun, Joseph, White and Liddle2011; Colibazzi et al. Reference Colibazzi, Wexler, Bansal, Hao, Liu, Sanchez-Pena, Corcoran, Lieberman and Peterson2013). A study of the relationship between surface area and OCs in patients with psychosis indicated less surface area in those with lower birthweight (Haukvik et al. Reference Haukvik, Rimol, Roddey, Hartberg, Lange, Vaskinn, Melle, Andreassen, Dale and Agartz2013). Cortical thickness also tends to be reduced in patients with psychosis (Goldman et al. Reference Goldman, Pezawas, Mattay, Fischl, Verchinski, Chen, Weinberger and Meyer-Lindenberg2009; Schultz et al. Reference Schultz, Koch, Wagner, Roebel, Nenadic, Gaser, Schachtzabel, Reichenbach, Sauer and Schlosser2010; Takayanagi et al. Reference Takayanagi, Takahashi, Orikabe, Mozue, Kawasaki, Nakamura, Sato, Itokawa, Yamasue, Kasai, Kurachi, Okazaki and Suzuki2011). Cortical thickness is sensitive to a range of environmental risks during childhood and adolescence but not with pre- or perinatal events (Merkley et al. Reference Merkley, Bigler, Wilde, McCauley, Hunter and Levin2008; Haukvik et al. Reference Haukvik, Lawyer, Bjerkan, Hartberg, Jonsson, McNeil and Agartz2009; Woodward et al. Reference Woodward, Schaer, Kaloupek, Cediel and Eliez2009; Kuhn et al. Reference Kuhn, Schubert and Gallinat2010, Reference Kuhn, Schubert and Gallinat2011; Habets et al. Reference Habets, Marcelis, Gronenschild, Drukker and van Os2011; Lopez-Larson et al. Reference Lopez-Larson, Bogorodzki, Rogowska, McGlade, King, Terry and Yurgelun-Todd2011).
Studies of gyrification in psychosis indicate an increase in regions of the frontal lobes (Vogeley et al. Reference Vogeley, Tepest, Pfeiffer, Schneider-Axmann, Maier, Honer and Falkai2001; Narr et al. Reference Narr, Bilder, Kim, Thompson, Szeszko, Robinson, Luders and Toga2004; Falkai et al. Reference Falkai, Honer, Kamer, Dustert, Vogeley, Schneider-Axmann, Dani, Wagner, Rietschel, Muller, Schulze, Gaebel, Cordes, Schonell, Schild, Block, Traber, Steinmetz, Maier and Tepest2007; Harris et al. Reference Harris, Moorhead, Miller, McIntosh, Bonnici, Owens, Johnstone and Lawrie2007; Wisco et al. Reference Wisco, Kuperberg, Manoach, Quinn, Busa, Fischl, Heckers and Sorensen2007) with an overall reduction in global cortical folding (Sallet et al. Reference Sallet, Elkis, Alves, Oliveira, Sassi, Campi de Castro, Busatto and Gattaz2003; Jou et al. Reference Jou, Hardan and Keshavan2005; Cachia et al. Reference Cachia, Paillere-Martinot, Galinowski, Januel, Bellivier, Artiges, Andoh, Bartres-Faz, Duchesnay, Riviere, Plaze, Mangin and Martinot2008; Palaniyappan & Liddle, Reference Palaniyappan and Liddle2012). Two studies included measures of both gyrification and OCs (Falkai et al. Reference Falkai, Honer, Kamer, Dustert, Vogeley, Schneider-Axmann, Dani, Wagner, Rietschel, Muller, Schulze, Gaebel, Cordes, Schonell, Schild, Block, Traber, Steinmetz, Maier and Tepest2007; Haukvik et al. Reference Haukvik, Schaer, Nesvag, McNeil, Hartberg, Jonsson, Eliez and Agartz2012) and both defined OCs as the total number of complications. No significant association was found in one study (Falkai et al. Reference Falkai, Honer, Kamer, Dustert, Vogeley, Schneider-Axmann, Dani, Wagner, Rietschel, Muller, Schulze, Gaebel, Cordes, Schonell, Schild, Block, Traber, Steinmetz, Maier and Tepest2007) whereas the other indicated a significant correlation between more OCs and less frontal gyrification (Haukvik et al. Reference Haukvik, Schaer, Nesvag, McNeil, Hartberg, Jonsson, Eliez and Agartz2012).
Only one study of psychosis included measures of cortical morphology and both hypoxia and IUGR (Cannon et al. Reference Cannon, Jones and Murray2002b ). This report indicated reduced cortical gray-matter volume in those with perinatal hypoxia and this effect was greater if IUGR was included in the analysis. However, cortical gray-matter volume was not separated into its two component parts – surface area and thickness. A related study (Haukvik et al. Reference Haukvik, Lawyer, Bjerkan, Hartberg, Jonsson, McNeil and Agartz2009) failed to detect an association between hypoxia and cortical thickness suggesting that reduced surface area might explain the significant findings of Cannon et al. (Reference Cannon, Jones and Murray2002b ). No previous reports have assessed the relationship between perinatal hypoxia and either cortical surface area or cortical gyrification.
The first goal of this study was to determine the associations between two distinct OCs and cortical gray-matter volume. The second goal was to assess the relationship between these two OCs and the three components of global cortical anatomy. Specifically, slow fetal growth and perinatal hypoxia should be associated with early-maturing aspects of the cortex such as gyrification and surface area but not with late-maturing aspects such as cortical thickness.
Method
Participants
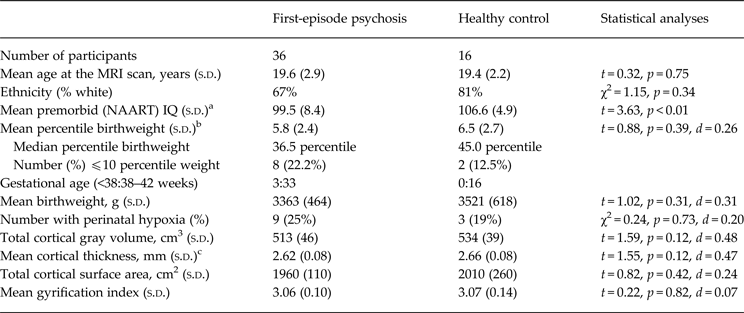
Thirty-six males aged 14–26 years were recruited from an early-psychosis intervention program (Table 1). At the time of the MRI scan, 11 (31%) had never received an antipsychotic medication and 25 received risperidone (N = 16), olanzapine (N = 8) or quetiapine (N = 1) for a mean duration of 6.7 weeks (s.d. = 3.1, range 1–14 weeks). Exclusion criteria were substance-induced psychosis, significant head injury, neurological disorder, a history of steroid drug use, or mental retardation. Consensus DSM-IV diagnoses were based on a Structured Clinical Interview for DSM-IV (SCID), a comprehensive assessment at referral and after 6–12 months, and an interview with at least one family member. Twenty-three patients (64%) received a diagnosis of schizophrenia or schizophreniform disorder and 13 (36%) were diagnosed schizoaffective, bipolar or major depression with psychosis. Patients who were using stimulant drugs at presentation were reassessed after 1 month of abstinence to help rule out substance-induced psychosis. Twenty-four patients (67%) were white, five (14%) South Asian, four (11%) East Asian, and three (8%) Native American. Sixteen healthy male controls were similar to patients in age and ethnicity. Controls had no history of psychosis in themselves or in a first-degree relative and other exclusion criteria were the same as for patients. All participants provided written, fully informed consent.
Demographic characteristics and brain measures in patients and controls

a North American Adult Reading Test.
b Values are the square root of percentile birthweight for gestational age.
c Estimated marginal means after covarying for age.
Ethical Standards
The authors assert that all procedures contributing to this work comply with the ethical standards of the University of British Columbia Ethics Review Board and with the Helsinki Declaration of 1975, as revised in 2008.
Pregnancy and birth complications
Birth history for all participants was assessed using a detailed structured maternal interview (Smith et al. Reference Smith, Flynn, McCarthy, Meistrich, Ehmann, MacEwan, Altman, Kopala and Honer2001). The present dataset was included in a previous study in which hospital birth records were used to determine the accuracy of maternal report (Smith et al. Reference Smith, Wong, MacEwan, Kopala, Ehmann, Thornton, Lang, Barr, Procyshyn, Austin, Flynn and Honer2009). In agreement with previous studies (Rice et al. Reference Rice, Lewis, Harold, van den Bree, Boivin, Hay, Owen and Thapar2007; Adegboye & Heitmann, Reference Adegboye and Heitmann2008) the correlation between birth records and maternal report was very high for birthweight [intra-class correlation coefficient (ICC) = 0.99] and gestational age (ICC = 0.94). Each patient was assigned a percentile birthweight based on gender-specific birthweight-for-gestational-age values (Oken et al. Reference Oken, Kleinman, Rich-Edwards and Gillman2003). A rating of probable hypoxia indicated that one or more of the following problems occurred during labor and delivery and was ‘potentially clearly harmful or relevant’ (scored ⩾ 4) according to the McNeil–Sjorstrom Scale (McNeil & Sjöström, Reference McNeil and Sjöström1994); emergency cesarean section, breech delivery, labor greater than 18 h, or difficulty breathing at birth. Agreement between birth records and maternal report for this hypoxia rating was high (κ = 0.70).
Brain imaging
Image acquisition and preparation
All scans were acquired with a GE Signa Excite 1.5 T scanner (GE Medical Systems, USA). A T1 weighted 3D FSPGR IR prepped series for volumetric assessment was performed for ROI seeding in structural space with the following parameters: TR = 11.5 ms, TE = 5 ms, FOV 26 cm2, NEX = 1, 124 slices, acquisition and reconstruction matrices = 256 × 256, voxel dimensions = 1.1056 × 1.1056 × 1.6 mm, and inter-slice thickness = 1.5 mm. All image processing was performed on an Apple MacPro Tower Quad Core Intel computer, OS X v. 10.5.8. Raw images were converted to NIFTI format with MICRON dcm2nii (Mac OS X version) shareware before they were processed. All images were skull-stripped and run through brain extraction pipelines in FSL with the brain extraction tool (BET). Whole brain volume was extracted from the skull using FSL Brain Extraction Tool, v. 4.0.5 (Smith et al. Reference Smith, Zhang, Jenkinson, Chen, Matthews, Federico and De Stefano2002). Preprocessing of images was performed using the methods of Dale et al. (Reference Dale, Fischl and Sereno1999).
Cortical surface area, thickness and gyrification
Measures of cortical gray-matter volume, cortical surface area, cortical thickness, and gyrification index were obtained using FreeSurfer v. 4.3 (http://freesurfer.net/). The total cortical surface area of each hemisphere was obtained using the FreeSurfer pipeline. After affine registration and signal intensity normalization, images were spherically transformed or inflated to reveal the sulcal surface, and then the entire surface was opened or flattened across the hemispheres. This transformed image was used to compute hemisphere cortical (pial) surface area. Global cortical surface area was the sum of the two hemispheres. Following cortical surface inflation, mean cortical thickness for each hemisphere was automatically derived from a deformable template based on a generalized gray-white tissue boundary (Fischl & Dale, Reference Fischl and Dale2000). FreeSurfer was used to calculate the gyrification index in each hemisphere. Briefly, the gyrification index algorithm measures the pial surface area of the hemisphere and divided this by the outer smoothed surface area of the hemisphere, which excluded the area contained within sulci. The mean of the left and right hemisphere measurements were used for global cortical thickness and global gyrification index.
Analyses
All analyses and the evaluation of statistical assumptions were performed using PASW statistical package, v. 18 for Mac (www.spss.com.hk/statistics/). All brain measures were normally distributed in both groups and variances did not significantly deviate from homogeneity. A significant association was found between greater age and thinner cortical gray matter (r = −0.56, p < 0.01) and age served as a covariate for analyses of cortical thickness. Total cortical gray-matter volume, total cortical surface area and the gyrification index were not significantly associated with age.
Percentile weight-for-gestational age was normally distributed in the control sample but positively skewed in patients (Shapiro-Wilk: p = 0.04). No outliers were present and the distribution was normalized using a square root transformation (Shapiro-Wilk: p = 0.50). Only three patients and no controls were born before 38 weeks of gestation and a statistical analysis of prematurity was not feasible. In order to assess whether the three prematurely born patients influenced the results, analyses were computed both with and without these patients. Birthweight was normally distributed in the control sample but not in patients (Shapiro-Wilk: p < 0.01). Inspection of the data revealed one patient with a birthweight of 1049 g whereas all other participants ranged from 2608 to 4819 g. In order to control the effects of this outlier, birthweight for this case was adjusted upwards as recommended by Tabachnick & Fidell (Reference Tabachnick and Fidell2007). Birthweight for this case was changed from 1049–2558 g (50 g below the next lowest birthweight). With this adjustment, which retains the ordinal structure of the data, birthweight was normally distributed in patients (Shapiro-Wilk: p = 0.50). The association between percentile birthweight and each brain measure was assessed using Pearson correlations.
Nine patients had a history of perinatal hypoxia but only three controls had this birth complication. Because of the limited number controls with hypoxia, analyses were computed between three groups (patients with hypoxia, N = 9; patients with no hypoxia, N = 27; controls with no hypoxia, N = 13). There was no significant variability between these groups for age. Post-hoc analyses were made using Tukey's honestly significant difference (HSD) contrasts. Finally, sequential regression analyses were computed in order to determine whether perinatal hypoxia explains variance in the brain measures after accounting for the effects of percentile birthweight.
Results
Preliminary analyses
No differences were found between patients and controls for age, ethnicity, percentile birthweight, absolute birthweight, or perinatal hypoxia (Table 1). Each of the four cortical measures (volume, surface area, thickness, gyrification) tended to be smaller in patients than in controls but differences were not statistically significant. No cortical measure was associated with the duration of untreated psychosis, or duration of antipsychotic treatment (all Spearman r < 0.2). Further, there were no significant group differences in mean percentile birthweight, mean absolute birthweight, or in the proportion with perinatal hypoxia. In addition, there were no diagnostic group differences (schizophrenia v. schizoaffective/mood) in any cortical or obstetrical measure. Perinatal hypoxia was not significantly associated with percentile birthweight (point-biseral r = 0.05) or birthweight (point-biseral r = −0.11). Inter-correlations between the four cortical measures were similar in patients and controls. Patients with a history of perinatal hypoxia were more likely to smoke cigarettes than patients without this history (78% v. 30%, χ2 = 6.44, p = 0.02). However, cigarette smoking was not significantly related to any cortical measure or to percentile birthweight (all p values > 0.20).
Percentile birthweight
Lower percentile birthweight in patients was associated with less cortical gray-matter volume (r = 0.41, p = 0.01, Cohen's d = 0.89). Importantly, an analysis of the relationship between percentile birthweight and the three components of gray-matter volume revealed a significant association with reduced cortical surface area (r = 0.34, p = 0.04, d = 0.72) but not with cortical thickness (partial r = 0.12, p = 0.50, d = 0.24) or gyrification (r = 0.23, p = 0.18, d = 0.47). Associations between percentile birthweight and the cortical measures in the control sample were all low and non-significant (cortical volume: r = 0.05, surface area: r = −0.08, cortical thickness: r = 0.01, gyrification: r = 0.11).
Hypoxia
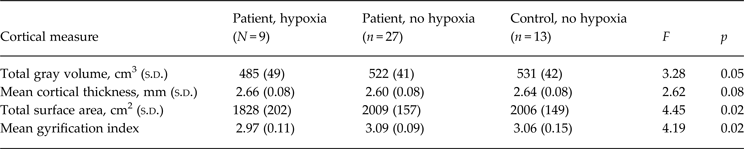
A one-way ANOVA revealed significant variation in cortical gray-matter volume across perinatal hypoxia groups (Table 2). Post-hoc comparisons using Tukey's HSD test indicated significantly less cortical gray matter in patients with perinatal hypoxia than in the controls with no hypoxia (p = 0.05, d = 1.02). There tended to be less cortical gray matter in patients with perinatal hypoxia than patients with no hypoxia but this difference did not reach statistical significance (p = 0.08, d = 0.86). The volume of gray matter in patients and controls with no hypoxia was similar (Table 2).
Association between perinatal hypoxia and each cortical measure

Values for cortical thickness are estimated marginal means obtained after covarying for age.
Of the three components of cortical gray-matter volume, perinatal hypoxia was associated with significantly decreased cortical surface area and less gyrification but not with cortical thickness (Table 2). Post-hoc contrasts revealed less total cortical surface area in patients with hypoxia than in either patients (p = 0.02, d = 1.07) or controls (p = 0.04, d = 1.03) with no hypoxia. Gyrification was lower in patients with hypoxia than in patients with no hypoxia (p = 0.02, d = 1.26) but not lower than in controls with no hypoxia (p = 0.16, d = 0.67).
The cumulative effects of lower percentile birthweight and perinatal hypoxia
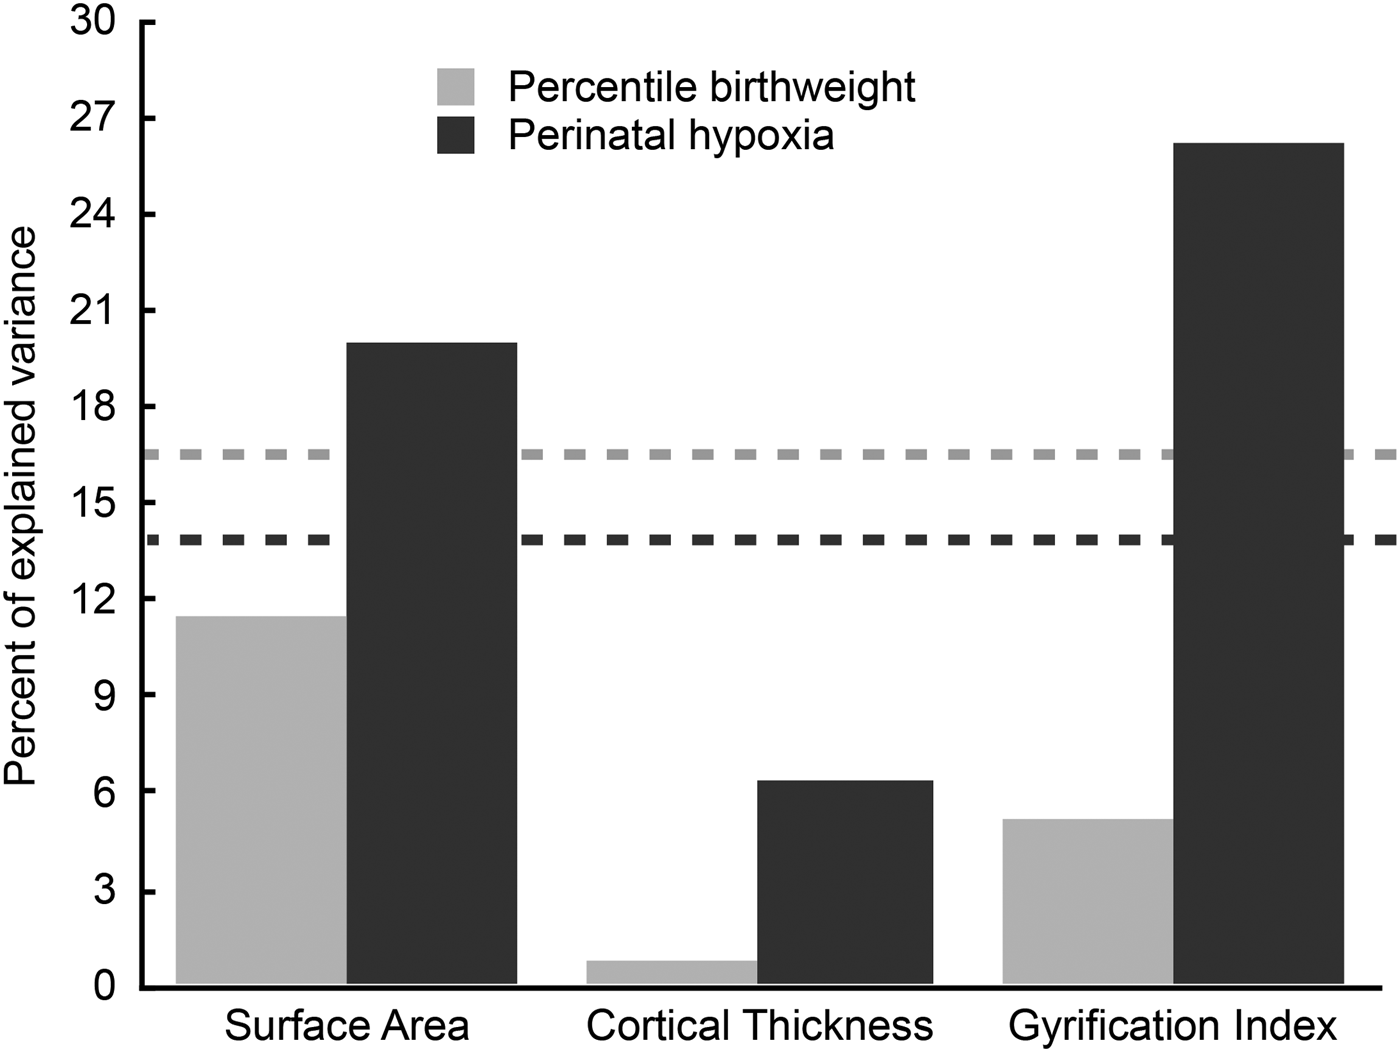
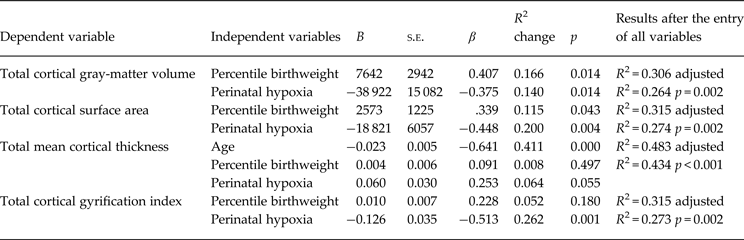
The preceding analyses indicate that percentile birthweight was unrelated to perinatal hypoxia and that both were related to cortical gray-matter volume in patients with first-episode psychosis. A sequential regression analysis was computed to determine whether hypoxia improves the prediction of cortical gray-matter volume over that of percentile birthweight alone. The results indicate that both percentile birthweight and perinatal hypoxia significantly predict total cortical gray-matter volume and that hypoxia does so after accounting for percentile birthweight (Table 3, Fig. 1).
Results from the sequential multiple regression analysis for two obstetrical predictors of three components of total cortical gray-matter volume. The dashed lines reflect the degree to which total cortical gray-matter volume was predicted by percentile birthweight (gray) and perinatal hypoxia (black).

Sequential regression of percentile birthweight and perinatal hypoxia on global cortical measures in the patient sample

The first row in each block shows the results after entering the first variable and second and third rows show the adjusted results when subsequent variables were included in the model.
Further analyses were computed in order to assess associations for the three components of total cortical gray-matter volume. The combination of percentile birthweight and perinatal hypoxia was significantly associated with total cortical surface area (Table 3). These two OCs accounted for 32% of the variability in cortical surface area. Percentile birthweight and perinatal hypoxia predicted a small and non-significant 7% of the variability in cortical thickness after accounting for the effects of age. Finally, perinatal hypoxia accounted for 26% of the variability in gyrification after accounting for the non-significant 5% of variance subsumed by percentile birthweight.
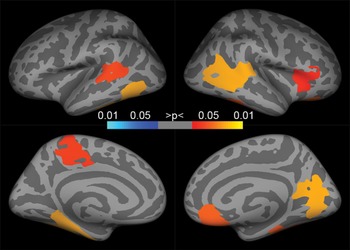
Exploratory regression analyses were computed to determine whether the global reduction in surface area and gyrification reflected a reduction across all regions of the cortex. Analyses for each cortical lobe revealed that percentile birthweight and perinatal hypoxia significantly predicted less cortical surface area in the right and left frontal, temporal, parietal and insula regions and in the right occipital lobe (explained variance: 14–36%, β = −0.34 to −0.48) but not the left occipital lobe (explained variance = 9%, β = −0.26). After controlling the non-significant variance subsumed by percentile birthweight, perinatal hypoxia significantly predicted a lower gyrification index in all cortical regions (explained variance: 12–27%, β = −0.34 to −0.52) except the left frontal, left insula and left occipital lobes (explained variance: 9%, 10% and 4%, β = −0.31, −0.31 and −0.20, respectively). Finally, Freesurfer-generated cortical maps were created to determine whether focal abnormalities were superimposed on the global abnormalities. These maps suggest that perinatal hypoxia was associated with focal regional reductions in gyrification (Fig. 2). However, maps of cortical surface area failed to reveal any focal regional abnormalities associated with lower percentile birthweight or perinatal hypoxia.
The cortical maps depict focal differences in the amount of cortical folding between patients with a history of perinatal hypoxia and those with no history of hypoxia. Colored regions show mean differences after controlling for multiple comparisons using a cluster inclusion criteria of p = 0.05. The yellow end of the spectrum indicates less gyrification in the group with perinatal hypoxia and blue indicates more gyrification. Images were generated using Freesurfer and displayed on an inflated average image (fsaverage). The left hemisphere is on the left and lateral surface on top.

Supplementary analyses
Two previous studies assessed the impact of the number rather than the type of OC on brain morphology (Falkai et al. Reference Falkai, Honer, Kamer, Dustert, Vogeley, Schneider-Axmann, Dani, Wagner, Rietschel, Muller, Schulze, Gaebel, Cordes, Schonell, Schild, Block, Traber, Steinmetz, Maier and Tepest2007; Haukvik et al. Reference Haukvik, Schaer, Nesvag, McNeil, Hartberg, Jonsson, Eliez and Agartz2012). The present results failed to detect a significant association between the total number of complications and any of the brain measures (all Spearman r values < 0.20).
Studies of psychosis tend to analyze slow fetal growth as a dichotomous rather than continuous variable. In order to assess the impact of this method, patients were grouped as small (⩽10th percentile, N = 8) or appropriate (>10th percentile, N = 28) for gestational age and the data were re-analyzed. Patients who were small for gestational age had significantly less cortical volume than those appropriate for gestational age (481 v. 522 cm2, p = 0.02, Cohen's d = 0.97) but no significant differences were found for cortical surface area, thickness, or gyrification.
A large psychiatric literature has reported the correlates of low birthweight. Low birthweight may result from slow fetal growth or from the premature birth of a normally developing fetus. These two complications can have distinct developmental consequences (Smith et al. Reference Smith, Flynn, McCarthy, Meistrich, Ehmann, MacEwan, Altman, Kopala and Honer2001; Rees & Inder, Reference Rees and Inder2005) and the use of birthweight confounds these risks. In the present study, all analyses were repeated after substituting absolute birthweight for percentile birthweight. These analyses tended to result in similar but attenuated associations.
Finally, three patients but no controls were born prematurely and may have affected the results. In order to assess this possibility, all analyses were recomputed after excluding these three participants. The omission of premature patients had minimal impact on effect sizes and did not alter the statistical significance of any of the results.
Conclusions
The present results indicate a significant, moderately strong association between a history of obstetrical complications and global cortical morphology in young men with first-episode psychosis. Consistent with previous results (Cannon et al. Reference Cannon, Jones and Murray2002a ), both slow fetal growth (lower percentile birthweight) and perinatal hypoxia contributed to the prediction of cortical gray-matter volume and the effect of these two risks was additive. Importantly, this finding was extended to include specific aspects of cortical morphology. These results indicate an association between the type of OC and the pattern of cortical dysmorphology. Perinatal hypoxia was associated with a smaller cortical surface area and with less cortical gyrification but was not related to cortical thickness. On the other hand, slower fetal growth was associated with less cortical surface area but not with either cortical thickness or gyrification. The effects of slow fetal growth and hypoxia on cortical surface area were additive and accounted for nearly one third of the variability in surface area.
The results also suggest that the use of a global index of OCs or the use of a global index of cortical gray-matter integrity will both obscure the potentially important associations between specific OCs and specific aspects of cortical morphology. In the present study, when gray-matter volume was used as a measure of cortical abnormality, perinatal hypoxia and percentile birthweight were equally likely to predict abnormality (Fig. 1). However, when gray-matter volume was separated into its three component parts, the effects of perinatal hypoxia were distinct from those of slow fetal growth. Likewise, when the total number of complications was included as a global measure of OCs no association was found with any cortical measure. This suggests it is the type of complication that may be important.
Cortical surface area, cortical thickness and gyrification mature at different times and differ in their sensitivity to subsequent positive or negative environmental exposures (Gluckman et al. Reference Gluckman, Hanson, Bateson, Beedle, Law, Bhutta, Anokhin, Bougnères, Chandak, Dasgupta, Davey Smith, Ellison, Forrester, Gilbert, Jablonka, Kaplan, Prentice, Simpson, Uauy and West-Eberhard2009; Luders et al. Reference Luders, Kurth, Mayer, Toga, Narr and Gaser2012; Raznahan et al. Reference Raznahan, Greenstein, Lee, Clasen and Giedd2012). This suggests that the pattern of cortical abnormality in adulthood may result from an interaction between early adverse events, the neurodevelopmental processes that are occurring at the time of the events, and environmental conditions or exposures that occur during development.
Cortical surface area continues to develop up to puberty but appears to be a relatively robust indicator of early adverse events (Raznahan et al. Reference Raznahan, Greenstein, Lee, Clasen and Giedd2012) and shows minimal global reduction from puberty up to early adulthood (Raznahan et al. Reference Raznahan, Shaw, Lalonde, Stockman, Wallace, Greenstein, Clasen, Gogtay and Giedd2011). Low birthweight predicts smaller global cortical surface area (De Bie et al. Reference De Bie, Oostrom, Boersma, Veltman, Barkhof, Delemarre-van de Waal and van den Heuvel2011; Haukvik et al. Reference Haukvik, Rimol, Roddey, Hartberg, Lange, Vaskinn, Melle, Andreassen, Dale and Agartz2014) and a very interesting study of twins (Raznahan et al. Reference Raznahan, Greenstein, Lee, Clasen and Giedd2012) suggested that the effects of slow prenatal growth on adult cortical surface area may be largely independent of genetic and childhood factors. The present results extend these findings and suggest that both slow fetal growth and perinatal hypoxia are associated with smaller cortical surface area.
Cortical thickness continues to develop into adulthood and is sensitive to a range of risks including psychosocial trauma, cannabis use (Habets et al. Reference Habets, Marcelis, Gronenschild, Drukker and van Os2011; Lopez-Larson et al. Reference Lopez-Larson, Bogorodzki, Rogowska, McGlade, King, Terry and Yurgelun-Todd2011), cigarette smoking (Kuhn et al. Reference Kuhn, Schubert and Gallinat2010), traumatic brain injury (Merkley et al. Reference Merkley, Bigler, Wilde, McCauley, Hunter and Levin2008), antipsychotic medication, and duration of psychotic illness (van Haren et al. Reference van Haren, Schnack, van den Heuvel, Cahn, Lepage, Evans, Pol and Kahn2009; Mattai et al. Reference Mattai, Chavez, Greenstein, Clasen, Bakalar, Stidd, Rappaport and Gogtay2010; Sprooten et al. in press). This suggests that cortical thickness should be a poor index of early adverse events. The results from the present report and from several previous studies were consistent with this hypothesis and failed to detect an association between cortical thickness and OCs (Merkley et al. Reference Merkley, Bigler, Wilde, McCauley, Hunter and Levin2008; Haukvik et al. Reference Haukvik, Lawyer, Bjerkan, Hartberg, Jonsson, McNeil and Agartz2009, Reference Haukvik, Rimol, Roddey, Hartberg, Lange, Vaskinn, Melle, Andreassen, Dale and Agartz2014; Kuhn et al. Reference Kuhn, Schubert and Gallinat2010, Reference Kuhn, Schubert and Gallinat2011; Habets et al. Reference Habets, Marcelis, Gronenschild, Drukker and van Os2011; Lopez-Larson et al. Reference Lopez-Larson, Bogorodzki, Rogowska, McGlade, King, Terry and Yurgelun-Todd2011). There is however some evidence that being born with a very low birthweight (<1500 g) increases the risk for thinner cortices in some regions (Martinussen et al. Reference Martinussen, Fischl, Larsson, Skranes, Kulseng, Vangberg, Vik, Brubakk, Haraldseth and Dale2005; Nagy et al. Reference Nagy, Lagercrantz and Hutton2011; Skranes et al. Reference Skranes, Lohaugen, Evensen, Indredavik, Haraldseth, Dale, Brubakk and Martinussen2012). The present sample was assessed at the onset of illness and therefore the impact of illness-related variables was reduced. In addition, no association was found between cortical thickness and either the duration of untreated psychosis or the duration of antipsychotic treatment. This suggests that illness-related factors did not influence the present results.
Cortical gyrification is completed before 2 years of age and appears to be relatively stable until young adulthood. Changes to gyrification may occur in some cortical regions (Palaniyappan et al. Reference Palaniyappan, Mallikarjun, Joseph, White and Liddle2011, Reference Palaniyappan, Crow, Hough, Voets, Liddle, James, Winmill and James2013a ) but there are minimal global changes (Raznahan et al. Reference Raznahan, Shaw, Lalonde, Stockman, Wallace, Greenstein, Clasen, Gogtay and Giedd2011). This suggests that global abnormalities in cortical folding are likely to reflect exposure to very early adverse events (Zilles et al. Reference Zilles, Palomero-Gallagher and Amunts2013). The present finding of a strong association between perinatal hypoxia and gyrification is consistent with this hypothesis.
Most studies of fetal growth or birthweight in patients with psychosis used a dichotomized measure and compared patients with slow fetal growth (<10th percentile) or low birthweight (<2500 g) with all other patients. Recent findings suggest that risk extends across the range of birth weights and is not restricted to significantly low weights (Abel et al. Reference Abel, Wicks, Susser, Dalman, Pedersen, Mortensen and Webb2010; Haukvik et al. Reference Haukvik, Rimol, Roddey, Hartberg, Lange, Vaskinn, Melle, Andreassen, Dale and Agartz2013). The present results support this observation and also suggest that the use of percentile birthweight is a more sensitive index of variability in fetal growth than a dichotomous measure. In addition, the use of birthweight can confound the effects of slow fetal growth and premature birth (Smith et al. Reference Smith, Flynn, McCarthy, Meistrich, Ehmann, MacEwan, Altman, Kopala and Honer2001). In the present study, a reanalysis of data using absolute birthweight instead of percentile birthweight resulted in attenuated associations.
It is noteworthy that a significant association between OCs and cortical abnormalities were observed in the absence of significant cortical differences between patient and control groups. A plethora of studies using a range of measurement techniques have documented cortical abnormalities in patients with psychosis. Methodological differences between these studies make it difficult to draw firm conclusions at the present time. Global cortical differences between patients and healthy controls tend to be small and the present study had limited statistical power for identifying small group differences. However, the results suggest a strong relationship between OCs and some aspects of cortical morphology. Because of this, the proportion of a research sample that experienced an OC will influence the probability of detecting cortical abnormality and failure to assess these early events will result in substantial unexplained variability between studies. This raises the question of whether is it possible to identify those with a history of early disruptive events based on the pattern of adult brain morphology. The strength of the present finding tentatively suggests that this may be an achievable goal.
A large pediatric and psychiatric literature has documented the developmental, medical and psychiatric consequences of OCs. These include poor psychosocial adjustment (Kunugi et al. Reference Kunugi, Nanko and Murray2001), cognitive difficulties (Freedman et al. Reference Freedman, Bao, Kremen, Vinogradov, McKeague and Brown2012), poor academic performance (De Bie et al. Reference De Bie, Oostrom, Boersma, Veltman, Barkhof, Delemarre-van de Waal and van den Heuvel2011), a range of medical problems (Barker, Reference Barker2006), and an increased risk for psychosis (Cannon et al. Reference Cannon, Jones and Murray2002b ). The link between OCs and adult cortical morphology suggests that cortical measures should also have clinical correlates and this hypothesis has received some recent support. Reduced gyrification in some cortical regionals predicts poor treatment response (Penttilä et al. Reference Penttilä, Paillère-Martinot, Martinot, Ringuenet, Wessa, Houenou, Gallarda, Bellivier, Galinowski, Bruguière, Pinabel, Leboyer, Olié, Duchesnay, Artiges, Mangin and Cachia2009; Palaniyappan et al. Reference Palaniyappan, Marques, Taylor, Handley, Mondelli, Bonaccorso, Giordano, McQueen, DiForti, Simmons, David, Pariante, Murray and Dazzan2013b ), disorganization (Palaniyappan & Liddle, Reference Palaniyappan and Liddle2012), and increased neurological soft signs (Gay et al. Reference Gay, Plaze, Oppenheim, Mouchet-Mages, Gaillard, Oli, Krebs and Cachia2013). Others suggest an association between decreased cortical surface area and both cognitive difficulties (Gutierrez-Galve et al. Reference Gutierrez-Galve, Wheeler-Kingshott, Altmann, Price, Chu, Leeson, Lobo, Barker, Barnes, Joyce and Ron2010; Colibazzi et al. Reference Colibazzi, Wexler, Bansal, Hao, Liu, Sanchez-Pena, Corcoran, Lieberman and Peterson2013) and increased symptom severity (Palaniyappan et al. Reference Palaniyappan, Mallikarjun, Joseph, White and Liddle2011). Clearly, the consequences of OCs are not specific to psychosis. However, these results suggest that the identification of those who experienced early pathogenic events and those with cortical dysmorphology could potentially explain some heterogeneity in psychotic disorders.
The present findings were obtained using reliable and accurate measures of both OCs and cortical morphology and this confers confidence in the results. In addition, males only were included in order to remove gender-specific variability in cortical maturation. Finally, the use of a young sample at the onset of illness reduced the likelihood that results would be confounded by age-, treatment- or illness-related factors.
The present study also has some limitations. The sample size was relatively small and this limits the ability to detect small effects. However, the effect sizes for all predicted associations were large and in the predicted direction. By contrast, correlations in the control sample were small suggesting failure to detect a statistically significant effect for that group was not a result of small sample size. The inclusion of only men increased the probability of detecting associations but limited the generalizability of the findings. Gender differences in both adult cortical morphology and in the age-related sequence of cortical development are complex and not well documented. These differences are dynamic in young adults, when the cortex is undergoing substantial gender-specific maturational changes. The investigation of this variability requires detailed gender-specific analyses using large samples of both men and women and awaits further study. Adverse birth events exert their influence on both clinical and non-clinical populations and appear to be relevant for a range of adult psychiatric disorders (Abel et al. Reference Abel, Wicks, Susser, Dalman, Pedersen, Mortensen and Webb2010). Because of this, a range of diagnoses was included in the present study. The finding of large effects in the face of this diagnostic heterogeneity suggests the observed associations are not diagnosis-specific. Nevertheless, there may be diagnostic differences in the strength of these associations and further research is needed to assess that possibility.
The use of maternal report can be unreliable for some birth events and therefore could have been a limitation of the present study. However, our findings from an earlier study of OCs (Smith et al. Reference Smith, Wong, MacEwan, Kopala, Ehmann, Thornton, Lang, Barr, Procyshyn, Austin, Flynn and Honer2009) were in agreement with previous research (Rice et al. Reference Rice, Lewis, Harold, van den Bree, Boivin, Hay, Owen and Thapar2007; Adegboye & Heitmann, Reference Adegboye and Heitmann2008) and indicated that maternal report using a standardized interview is very accurate for birthweight and gestational age and for serious perinatal events that are likely to result in hypoxia (Smith et al. Reference Smith, Wong, MacEwan, Kopala, Ehmann, Thornton, Lang, Barr, Procyshyn, Austin, Flynn and Honer2009).
Adverse events during childhood and adolescence were not systematically assessed in the present study. The pediatric and psychiatric literature suggests the developmental consequences of early adverse events can be ameliorated or exacerbated by later environmental circumstances (Gluckman et al. Reference Gluckman, Hanson, Cooper and Thornburg2008; Luders et al. Reference Luders, Kurth, Mayer, Toga, Narr and Gaser2012). Exposures such as psychosocial stress, drug use and head injury appear to increase the risk for psychosis and may have a negative impact on some aspects of cortical morphology. Other exposures such as meditation may reduce age-related changes (Gluckman et al. Reference Gluckman, Hanson, Cooper and Thornburg2008; Luders et al. Reference Luders, Kurth, Mayer, Toga, Narr and Gaser2012) and therefore may mitigate the effects of early adverse events. These factors were not systematically assessed in the present study and the extent to which they interact with OCs to influence the course of illness and cortical morphology requires further study. Finally, the clinical implications of our findings were not tested and more research is needed to explore the ramifications of OC-related cortical abnormalities.
In summary, aspects of global cortical morphology in first-episode psychosis are related to early environmental events. The present results suggest that cortical surface area and gyrification but not cortical thickness are influenced by pre- and perinatal adversity. Other research suggests that cortical thickness is affected by adverse events during childhood and adolescence. Together, these findings suggest that the impact of an adverse event during neurodevelopment will depend on both the type of event and on the maturational level of the cortex at the time of the event.
Acknowledgements
Funding was provided by a grant from the Canadian Institutes of Health Research (NET-54013), the BC Mental Health and Addictions Services, and the Michael Smith Foundation for Health Research. Neither the funding sources nor any other organization had any role in the study design, collection of data, analysis of results, interpretation of findings, the writing of this paper, or the decision to publish. We thank the staff of the South Fraser Early Psychosis Identification and Intervention unit.
Declaration of Interest
Dr Honer reports receiving consulting or advisory board fees from Roche and Lundbeck/Otsuka. Dr MacEwan has received consulting fees or sat on paid advisory boards for: Apotex, AstraZeneca, BMS, Janssen, Lundbeck, Otsuka, Pfizer and Sunovion. He also received fees lectures sponsored by AstraZeneca, BMS, Janssen, Otsuka and Eli Lilly, and has received grants from Janssen Pharmaceuticals. Dr Kopala reports receiving consulting or advisory board fees from BMS, Otsuka, and Sunovian. Grant support was obtained from BMS while lecture fees were received from AstraZeneca and BMS. All other authors declare that they have no conflicts of interest.