INTRODUCTION
In the context of the learning and teaching of second language (L2) speaking skills, three major learning goals have been traditionally identified: (a) fluency, (b) nativeness, and (c) intelligibility. L2 speakers are naturally concerned with maintaining fluency because failure to do this can lead to loss of listeners’ attention and their own face (Lennon, Reference Lennon and Riggenbach2000). Identifying linguistic aspects affecting listeners’ perception of fluency is, therefore, crucial for successful L2 communication. Nativeness is typically operationalized as “accent” or “accentedness” and is measured based on listeners’ judgments on how the pronunciation of L2 speech deviates from that of native language norms (Levis, Reference Levis2005). Meanwhile, the term intelligibility has been used in two senses. In a narrower sense, intelligibility has been defined as listeners’ actual understanding of L2 speech and is typically measured through orthographical transcription. In a broader sense, intelligibility is concerned with listeners’ holistic perception of how easily they understand L2 speech using scalar ratings (see Derwing & Munro, Reference Derwing and Munro2015). In recent research, the former is commonly referred to as intelligibility, and the latter as comprehensibility, emphasizing their methodological differences (Trofimovich & Isaacs, Reference Trofimovich and Isaacs2012). Comprehensibility is a holistic construct based on listeners’ perception, and as such is more strongly related to the amount of cognitive effort and time required by listeners to understand speech than the eventual level of understanding (Derwing & Munro, Reference Derwing and Munro2009; Trofimovich & Isaacs, Reference Trofimovich and Isaacs2012).
There is a consensus that comprehensibility is more important in successful L2 communication than nativelikeness or accentedness (Derwing & Munro, Reference Derwing and Munro2009). Moreover, empirical evidence suggests that L2 comprehensibility is a realistic learning goal even for late learners (Saito, Trofimovich, & Isaacs, Reference Saito, Trofimovich and Isaacs2016). The significance of comprehensibility has also been realized in the context of language testing. Comprehensibility is included in the descriptors of various high-stake language tests, such as the exams of International English Language Testing Systems (IELTS) and the Test of English as a Foreign Language Internet-based test (TOEFL iBT).
Motivated by their common important role in successful L2 communication, previous studies have investigated the linguistic correlates of comprehensibility and perceived fluency. However, it is still unclear to what extent these constructs are distinguishable at the level of their underlying linguistic dimensions. Furthermore, previous studies suggest that both comprehensibility and fluency research should be extended by addressing several methodological issues. First, both research areas have exclusively focused on picture narrative/description tasks. For the sake of the ecological validity of research findings, it is, therefore, essential to scrutinize the linguistic correlates of comprehensibility and fluency in communicative situations in which listeners cannot expect predefined content and language for speech (i.e., open tasks). Second, raters are rarely asked to evaluate an entire speech sample for comprehensibility and fluency, which also reduces the transferability of findings to the field of L2 assessment. Finally, it is important to supplement quantitative judgments with postrating debriefing interviews so that we can capture what aspects of speech individual raters pay attention to in rating sessions.
To address these conceptual and methodological challenges, our study examined the linguistic dimensions of comprehensibility and perceived fluency using an argumentative task in the context of Japanese learners of English. In this article we first provide a theoretical and methodological overview of previous research on comprehensibility and perceived fluency, and the complexity, accuracy, and fluency (CAF) framework. This is followed by a description of our research procedures and a presentation of the findings. Next, we discuss the results of our research with reference to psycholinguistic processes of L2 speech production and perception. We conclude our article by highlighting the differences between comprehensibility and fluency judgments in their underlying linguistic dimensions and outlining future directions for research.
BACKGROUND
COMPREHENSIBILITY
A growing body of prior research has investigated which linguistic features are associated with listeners’ perception of L2 comprehensibility. It is generally shown that native listeners’ comprehensibility judgments are related to a whole range of linguistic dimensions (Crowther, Trofimovich, Isaacs, & Saito, Reference Crowther, Trofimovich, Isaacs and Saito2017; Saito & Shintani, Reference Saito and Shintani2016; Saito, Trofimovich, et al., Reference Saito, Trofimovich and Isaacs2016). Pronunciation and fluency aspects tend to be strong predictors for comprehensibility while lexicogrammatical features are also reported to contribute to comprehensibility judgments particularly in the context of picture narrative tasks (e.g., Saito, Webb, Trofimovich, & Isaacs, Reference Saito, Trofimovich and Isaacs2016; Trofimovich & Isaacs, Reference Trofimovich and Isaacs2012). Building on these findings, there seems to be a consensus that native listeners pay attention to both phonological and lexicogrammatical aspects of speech when judging how easily they can extract the meaning of L2 speech. A closer examination of previous findings, however, reveals that it is still unclear which underlying linguistic dimensions are the primary cues for listeners’ perception of comprehensibility.
This lack of consensus about predictors of comprehensibility is partly due to methodological issues. First, previous studies commonly employed picture narrative/description tasks to elicit L2 speech. Picture prompts predefine the speech content, so that researchers can minimize speakers’ individual variability in content elaboration, leading to clearer observation of variability in linguistic competence (Skehan, Reference Skehan1998). The content of speech is not always externally predetermined in real-world contexts in which communication is frequently driven by an information gap between interlocutors. Thus, considering the ecological validity of findings, L2 comprehensibility research needs to be extended to the investigation of open tasks (e.g., problem solving, argumentative speech; Pallotti, Reference Pallotti2009). Recently, Crowther et al. (Reference Crowther, Trofimovich, Isaacs and Saito2017) employed three different speaking tasks (picture narrative, IELTS long-turn, TOEFL iBT integrated task) to investigate task effects on L2 comprehensibility. Their results show that task difficulty affects lexicogrammatical aspects of L2 speech performance including lexical appropriateness and grammatical complexity and, consequently, albeit to a small extent, influences comprehensibility ratings.
Another methodological issue is the length of speech stimuli for comprehensibility judgments. Most studies adopt 30 seconds from either one single speech sample or multiple speech samples (e.g., 10 seconds from three different prompts; Saito & Shintani, Reference Saito and Shintani2016), following listener-based research on acoustic properties of speech (Derwing & Munro, Reference Derwing and Munro2009). However, in assessment contexts, the entire speaking performance is evaluated. As comprehensibility is included in rubrics of various high-stake tests, research evidence on comprehensibility judgments based on the whole speech may contribute to the ecological validity of findings (Isaacs & Thomson, Reference Isaacs and Thomson2013).
Another concern in L2 comprehensibility research is the lack of comparability of predictor variables for comprehensibility judgments across studies. For instance, although temporal aspects have been found to be strong predictors of comprehensibility, fluency has been measured differently across studies (e.g., speech rate in Crowther et al., Reference Crowther, Trofimovich, Isaacs and Saito2017; text length in Saito, Webb, et al., Reference Saito, Trofimovich and Isaacs2016). Moreover, instead of objective measures, most studies employ subjective ratings for predictor variables. Some studies further combine subjective ratings through principal component analysis to reduce the number of variables (e.g., Crowther et al., Reference Crowther, Trofimovich, Isaacs and Saito2017). Consequently, it is difficult to identify which linguistic features directly affect comprehensibility judgments.
Finally, as pointed out by Isaacs and Trofimovich (Reference Isaacs and Trofimovich2012), establishing interrater reliability of comprehensibility judgments does not necessarily ensure the validity of comprehensibility ratings. Although high interrater reliability indicates a consistent pattern of rank-ordering speech samples across raters, it does not confirm that all raters assign common meaning to the numerical values on a rating scale. Therefore, to examine raters’ perceptions during the rating process, they suggest a qualitative approach on identifying to which linguistic features raters pay attention.
PERCEIVED FLUENCY
The concept of fluency has been defined in different ways in L2 research. Fillmore (Reference Fillmore, Kempler and Wang1979) conceptualized four dimensions of the notion of fluency: temporal aspects, mastery of language resources (e.g., coherence and lexical density), sociolinguistic appropriateness, and content sophistication (e.g., creativity, joking). Building on Fillmore’s definition, Lennon (Reference Lennon1990, Reference Lennon and Riggenbach2000) reconceptualized the notion of fluency in two different meanings: (a) higher-order fluency, that is, overall command of language and (b) lower-order fluency, that is, temporal aspects of speech. Lennon (Reference Lennon1990) defined fluency as “an impression on the listener’s part that the psycholinguistic processes of speech planning and speech production are functioning easily and efficiently” (p. 391). In other words, fluency is the interlocutor’s inference of the efficiency of linguistic processing system underlying the given speech.
Fluency has been investigated in terms of observable utterance features in task-based performance studies that aimed to develop valid and reliable measurements for assessing learners’ performance. With regard to temporal behavior of speaking performance, the notion of temporal fluency is divided into three subconstructs: breakdown, repair, and speed fluency (Tavakoli & Skehan, Reference Tavakoli, Skehan and Ellis2005). Breakdown fluency refers to pausing behavior including frequency, location, and duration of pauses. Speed fluency reflects the speed of delivery. Repair fluency is concerned with dysfluency phenomena such as repetitions and false starts.
Furthermore, in light of the different perspectives on fluency, the term fluency has been used interchangeably with different meanings, such as listeners’ perceptions versus observable utterance features. Thus, Segalowitz (Reference Segalowitz2010) distinguished three types of fluency: utterance fluency (i.e., observable temporal features of speech), cognitive fluency (i.e., psycholinguistic processes underlying speech), and perceived fluency (i.e., listener’s inferences of cognitive fluency from utterance fluency features).
Building on the preceding theoretical background, L2 fluency research has investigated which temporal features of utterances can explain listeners’ perception of fluency. Traditionally, such fluency judgments have been measured using numerical rating scales, while the linguistic properties of speech have been captured through objective measurements (e.g., speech rate). Despite some methodological variability among studies, prior research has confirmed that listener-based perceptions of L2 fluency are closely linked to speed and breakdown fluency and, to a lesser degree, are also related to repair fluency (for a review, see Saito, Ilkan, Magne, Tran, & Suzuki, Reference Saito, Ilkan, Magne, Tran and Suzuki2018).
As with the study of L2 comprehensibility, L2 fluency research also faces several methodological challenges. Regarding speech stimuli, one can argue that listeners’ perception of fluency can be affected by task type and length of stimuli. Most studies employ picture narrative/description tasks to control for speech content (see Skehan, Reference Skehan1998). However, fluency research would need to be extended to other speaking tasks including open tasks. For instance, native listeners tend to assign lower fluency scores to picture narratives than personal narratives due to the constraints of linguistic items imposed by picture prompts (Derwing, Rossiter, Munro, & Thomson, Reference Derwing, Rossiter, Munro and Thomson2004). As speakers cannot avoid certain lexical items to describe picture prompts, the fixed content of task can highlight speakers’ breakdowns in linguistic retrieval as well as their limited lexical repertoire.
As with other listener-based perception research, there are two different approaches to present speech stimuli to listeners in L2 fluency research. Previous studies provide speech stimuli in the form of either excerpts (e.g., initial 30 seconds) or entire recordings of performance, depending on the research focus and practicality. Prior research reveals that even short segments of speech can allow listeners to judge variability in utterance fluency sufficiently (Bosker, Pinget, Quené, Sanders, & de Jong, Reference Bosker, Pinget, Quené, Sanders and de Jong2013; Derwing, Munro, Thomson, & Rossiter, Reference Derwing, Munro, Thomson and Rossiter2009). However, considering the transferability of research findings to assessment contexts, it is also beneficial to employ entire speaking performance as speech stimuli (Préfontaine, Kormos, & Johnson, Reference Préfontaine, Kormos and Johnson2016).
Additionally, it is important to consider the limitations of scale-based ratings of L2 perceived fluency. Although listeners’ backgrounds (e.g., native vs. nonnative, expert vs. novice) were not found to change the severity and components of fluency judgments (Rossiter, Reference Rossiter2009), several studies reported individual variability among raters as regards what linguistic features they focus on (Kormos & Dénes, Reference Kormos and Dénes2004). These findings indicate that even a relatively homogeneous group of raters can assign different meanings to the same score on a fluency judgment scale. Therefore, as with L2 comprehensibility research, L2 fluency studies should also make use of supplementary qualitative data such as postrating debriefings (Préfontaine & Kormos, Reference Préfontaine and Kormos2016; Rossiter, Reference Rossiter2009).
Another major methodological issue resides in the linguistic analysis of L2 speech data. Previous studies have tended to focus on lower-order fluency rather than higher-order fluency, so that researchers conventionally instruct their raters to pay attention to temporal aspects and disregard nontemporal aspects. However, despite the explicit instruction to focus on temporal features of speech, raters’ judgments have been found to be affected by nontemporal aspects of speech such as grammatical accuracy (Rossiter, Reference Rossiter2009). Moreover, the validity of utterance fluency measurements has recently received increasing attention. Following Tavakoli and Skehan (Reference Tavakoli, Skehan and Ellis2005), researchers conventionally assess a triad of utterance fluency: speed, breakdown, and repair fluency. However, the operationalization of these measures varies across studies. Some studies have operationalized one aspect of fluency using composite measures that can tap into multiple aspects of fluency (e.g., mean length of run; see Bosker et al., Reference Bosker, Pinget, Quené, Sanders and de Jong2013). More recently, fluency researchers have elucidated the multidimensional nature of breakdown fluency including three interdependent dimensions: frequency, duration, and location of pauses. Although pause frequency has been extensively used in previous studies, it has been shown that both pause frequency and duration measures can make unique contributions to fluency judgments (Bosker et al., Reference Bosker, Pinget, Quené, Sanders and de Jong2013; Préfontaine et al., Reference Préfontaine, Kormos and Johnson2016). Furthermore, pause locations, which are theoretically underpinned by psycholinguistic models of L2 speech production (Kormos, Reference Kormos2006), have recently been employed in L2 perceived fluency studies (Kahng, Reference Kahng2018; Saito et al., Reference Saito, Ilkan, Magne, Tran and Suzuki2018). These studies commonly report that pause location also plays a distinctive role in L2 perceived fluency.
DISENTANGLING COMPREHENSIBILITY FROM FLUENCY
Comprehensibility and fluency commonly play an important role in communicative effectiveness. From the theoretical perspective, previous studies confirmed the interrelationship between these holistic constructs, arguing that dysfluency phenomena such as excessive pausing and slow speech delivery might prevent listeners from maintaining their attention while listening (Derwing et al., Reference Derwing, Rossiter, Munro and Thomson2004; Lennon, Reference Lennon and Riggenbach2000). Thus, it can be hypothesized that temporal aspects of speech contribute to listeners’ perception of comprehensibility. However, the problem here is that there are two different ways of conceptualizing fluency: higher- versus lower-order fluency.
To investigate the linguistic correlates with comprehensibility, previous studies have measured lower-order fluency by using either listener-based judgments or objective measurements. Prior research confirmed that temporal aspects (i.e., lower-order fluency) can predict listener’s comprehensibility judgments particularly in the context of L2 picture narratives (Derwing, Munro, & Thomson, Reference Derwing, Munro and Thomson2008; Derwing et al., Reference Derwing, Rossiter, Munro and Thomson2004; Saito & Shintani, Reference Saito and Shintani2016; Trofimovich & Isaacs, Reference Trofimovich and Isaacs2012). Moreover, Derwing et al. (Reference Derwing, Munro and Thomson2008) reported that native listeners tend to give harsher scores in fluency judgments than in comprehensibility judgments. Temporal aspects of L2 speech are, however, susceptible to task effects (Derwing et al., Reference Derwing, Rossiter, Munro and Thomson2004; Préfontaine & Kormos, Reference Préfontaine and Kormos2016). Therefore, it is still unclear whether the significant role of lower-order fluency in comprehensibility is sustained in different speaking tasks.
Higher-order fluency studies are scarce in number, although laypeople in general tend to interpret fluency as higher-order fluency (Tavakoli & Hunter, Reference Tavakoli and Hunter2018). Accordingly, to the best of our knowledge, no study has examined the relationship between comprehensibility and higher-order fluency. Both constructs entail a range of linguistic dimensions despite the slight difference in the perspective of judgments. Comprehensibility is related to linguistic dimensions necessary to extract meaning from L2 speech (Saito, Trofimovich, et al., Reference Saito, Trofimovich and Isaacs2016) whereas higher-order fluency is concerned with linguistic aspects capturing the degree of mastery of the target language (Lennon, Reference Lennon1990, Reference Lennon and Riggenbach2000). Therefore, this exploratory study investigated the interrelationship between comprehensibility and higher-order fluency judgments, capturing various linguistic features by means of CAF measurements.
COMPLEXITY, ACCURACY, AND FLUENCY FRAMEWORK
L2 proficiency is multicomponential in nature. One of the theoretical and methodological frameworks developed to capture this multicomponential nature of L2 proficiency is the CAF framework, which consists of three principal components: complexity, accuracy, and fluency (Housen, Kuiken, & Vedder, Reference Housen, Kuiken and Vedder2012). Complexity refers to the ability to use a range of sophisticated structures and lexical items. Although Bulté and Housen (Reference Bulté, Housen, Housen, Kuiken and Vedder2012) propose a comprehensive typology of subdimensions of linguistic complexity, the current study focuses on two major facets of linguistic complexity: syntactic and lexical complexity. Accuracy taps into the ability to produce targetlike and/or error-free language (see Foster & Wigglesworth, Reference Foster and Wigglesworth2016; Polio & Shea, Reference Polio and Shea2014). Complexity and accuracy are largely associated with learners’ linguistic knowledge representations whereas fluency is purely a performance phenomenon, which represents the eventual outcome of psycholinguistic processing (Lennon, Reference Lennon1990). Fluency (henceforth, utterance fluency) is typically defined as the ability to produce smooth and eloquent speech with few pauses, hesitations, or reformulations. As mentioned previously, utterance fluency is also multifaceted and consists of three subconstructs: speed, breakdown, and repair fluency (Tavakoli & Skehan, Reference Tavakoli, Skehan and Ellis2005). CAF components are empirically proved to be in an interdependent and distinctive relationship (Norris & Ortega, Reference Norris and Ortega2009), suggesting that each component of CAF plays a unique role in L2 proficiency.
In the area of task performance research, many measurements have been employed to capture various aspects of L2 performance. For instance, some CAF measurements are applied to investigate which aspects of speech contribute to holistic constructs of oral proficiency such as comprehensibility (Saito, Webb, et al., Reference Saito, Trofimovich and Isaacs2016; Trofimovich & Isaacs, Reference Trofimovich and Isaacs2012), perceived fluency (Kormos & Dénes, Reference Kormos and Dénes2004), and functional adequacy (Révész, Ekiert, & Torgersen, Reference Révész, Ekiert and Torgersen2016). However, issues with the construct validity of measurements have been recently raised as significant challenges in CAF research (Housen et al., Reference Housen, Kuiken and Vedder2012; Lambert & Kormos, Reference Lambert and Kormos2014).
Another methodological challenge in CAF research is the appropriate selection of CAF measures. Thus, Michel (Reference Michel2017) recommends that researchers should use some of the measures employed in key previous studies to ensure comparability with previous findings. She also suggests that these measures should be supplemented by several context-specific measures that take into account the specific characteristics of different research contexts. It is also important that measures should be checked to avoid conceptual collinearity among them (see Bosker et al., Reference Bosker, Pinget, Quené, Sanders and de Jong2013; Norris & Ortega, Reference Norris and Ortega2009; Polio & Shea, Reference Polio and Shea2014).
RESEARCH QUESTIONS
Our research aimed to overcome the methodological challenges outlined in the preceding text in a Japanese university context. The study was guided by the following three research questions:
1. To what extent are comprehensibility and perceived fluency of L2 argumentative speech produced by Japanese L2 learners distinguishable for naïve native listeners?
2. How are linguistic dimensions of performance associated with comprehensibility of Japanese learners’ L2 argumentative speech?
3. How are the linguistic dimensions of performance associated with perceived fluency of Japanese learners’ L2 argumentative speech?
METHOD
PARTICIPANTS
L2 speakers
A total of 40 Japanese-speaking learners of English, ranging from 18 to 23 years of age, were recruited from a private university in Japan (20 females, 20 males). To ensure a relatively wide range of proficiency levels among participants, their scores in a placement test were used as sampling criteria. Their placement scores were normally distributed in terms of raw scores (M = 683.3, SD = 108.2, Range = 446–947 out of 1,000). According to the placement scores, their proficiency levels ranged from A2 to C1 levels, and most of them were within B1–B2 levels.
Native listeners
Ten native speakers of English (henceforth, raters) were recruited at a university in the United Kingdom. All the raters were born and raised in English-speaking UK homes with at least one L1 English-speaking parent. Following previous studies, our research involved inexperienced raters, who are commonly defined as people without any linguistic and pedagogical background (Isaacs & Thomson, Reference Isaacs and Thomson2013). According to a background questionnaire, they had moderate familiarity with Japanese-accented English (M = 2.3, Range = 1–5, on a 6-point scale; 1 = Not at all, 6 = Very much), and reported only occasional contact with Japanese speakers of English (M = 2.3; Range = 1–5, on a 6-point scale; 1 = Very infrequent, 6 = Very often).
ARGUMENTATIVE SPEECH
For the elicitation of L2 speaking performance, the current study employed an argumentative speech task, in which participants were not required to produce predefined content and linguistic items. They were initially given a statement (“The Tokyo Olympics in 2020 will bring economic growth to Japan.”) and asked to express their views on how far they would agree with it. They were explicitly instructed to provide some concrete examples and justification for their arguments to ensure the sufficient length of speech. Before performing the task, three minutes were given for planning, but notetaking was not allowed. There was no time pressure during the performance. The task prompt and conditions had been previously piloted with similar populations and proved to be feasible for the target population (Suzuki, Yasuda, & Hanzawa, Reference Suzuki, Yasuda and Hanzawa2018).Footnote 1 All speech samples were normalized for peak intensity with initial dysfluencies excluded (e.g., false starts) for both speech judgments and linguistic analyses.
RATING PROCEDURE
Consistent with previous studies, this study also employed a 9-point scale for both comprehensibility (1 = hard to understand, 9 = easy to understand) and perceived fluency (1 = not fluent at all, 9 = very fluent). However, no definitions and descriptors were provided to ensure that raters made intuitive judgments of both constructs. Although some studies require raters to judge multiple constructs simultaneously, such as comprehensibility and accentedness (e.g., Trofimovich & Isaacs, Reference Trofimovich and Isaacs2012), our raters participated in two different sessions to minimize the possibility that one rating might affect the other. They evaluated speech samples for one construct in the first session, and for the other construct in the second session. The order of constructs was counterbalanced across raters, and the time interval between the sessions was longer than one week. After familiarizing the raters with the elicitation task to avoid familiarity bias (see Derwing et al., Reference Derwing, Rossiter, Munro and Thomson2004; Rossiter, Reference Rossiter2009), they listened to three recordings to practice using the rating scale. They were told that the speech samples covered a range of ability levels and then they were instructed to use the whole scale. To maximize the ecological validity of findings, we used the entire speaking performance as speech stimuli, which varied in total duration (M = 149.0 second, SD = 82.3, Range = 32.1–408.7). The speech samples were presented in a randomized order in each session. Each rating session lasted for approximately two hours, including a short break halfway through. After the evaluation of the samples in each session, the raters answered two open-ended questions referring to the construct they scored in a given session:
• How would you define comprehensibility/fluency in your own words?
• What kinds of features did you pay attention to when you were rating comprehensibility/fluency?
LINGUISTIC ANALYSIS
The current study predetermined three selection criteria for CAF measurements: comparability with previous studies, validity of measurements, and research objectives. Initially, we considered three theoretically distinctive (sub-)dimensions of task-based performance: syntactic and lexical complexity; accuracy; and speed, breakdown, and repair fluency (Housen et al., Reference Housen, Kuiken and Vedder2012). Furthermore, to avoid collinearity among the measures, we decided to assign only a few general measures to each (sub-)construct, considering comparability with previous studies and their validity (see Bosker et al., Reference Bosker, Pinget, Quené, Sanders and de Jong2013; Norris & Ortega, Reference Norris and Ortega2009; Polio & Shea, Reference Polio and Shea2014). For the sake of comparability with prior research on L2 comprehensibility, we added pronunciation measures that were previously found to be significant predictors of L2 comprehensibility. Finally, as we used the entire performance as speech stimuli, we assumed that listeners’ perception would also be affected by discourse features.
All the speech data were transcribed and pruned by excluding filled pauses, verbatim repetitions, false starts, and self-corrections. The pruned transcripts were segmented into Analysis of Speech Units (AS-unit; Foster, Tonkyn, & Wigglesworth, Reference Foster, Tonkyn and Wigglesworth2000) and clauses. Following initial coding, 25% of randomly selected speech data were blind coded by a trained research assistant to establish intercoder agreement. The results of Cohen’s kappa analyses confirmed high intercoder agreements for AS-unit and clause boundaries (k = .97 for AS-unit, k = .92 for clause).
Complexity
Following Norris and Ortega (Reference Norris and Ortega2009), we targeted three different syntactic levels that theoretically pertain to L2 developmental changes (i.e., sentential, clausal, and phrasal levels). As for lexical complexity, we focused on lexical diversity, sophistication, and density as three major distinctive aspects of lexical use (Reference MichelMichel, 2017).
Syntactic complexity
1. Mean length of AS-units. The mean number of words produced per AS-units.
2. Mean number of clauses per AS-unit. The mean number of clauses (excluding nominal subordination as objects of superordinate verbs, such as think, say, seem) per AS-units (Lambert & Nakamura, 2018).
3. Mean length of noun phrases. The mean number of words per noun phrases, computed with the assistant of Coh-Metrix (McNamara, Graesser, McCarthy, & Cai, Reference McNamara, Graesser, McCarthy and Cai2014)
Lexical complexity
4. Measure of textual lexical diversity (MTLD). The mean length of sequential word strings in a text that maintains a given type-token ratio value (McCarthy & Jarvis, Reference McCarthy and Jarvis2010), derived from Coh-Metrix.
5. CELEX log frequency. The averaged logarithmic frequency of content words produced in a text based on the CELEX corpus (Baayen, Piepenbrock, & Gulikers, Reference Baayen, Piepenbrock and Gulikers1995), calculated by Coh-Metrix.
6. Lexical density. The proportion of content words to the total words produced, computed using LexTutor (Cobb, Reference Cobb2011).
Accuracy
From the perspective of speech processing, lexical, morphological, and syntactic encoding processes are interrelated, but are relatively independently executed (Kormos, Reference Kormos2006; Segalowitz, Reference Segalowitz2010). Therefore, we selected local accuracy measures tapping into these linguistic levels rather than global accuracy measures (Foster & Wigglesworth, Reference Foster and Wigglesworth2016).
7. Lexical error rate. The mean number of lexical errors (e.g., wrong word choice) per 100 words.
8. Morphological error rate. The mean number of morphological errors (e.g., inflections, S-V agreement) per 100 words.
9. Syntactic error rate. The mean number of syntactic errors (e.g., word order, tense) per 100 words.
To check the reliability of accuracy measures, a second native-speaker coder analyzed a randomly selected 25% of the data after training and discussion with the researcher. All the Cronbach alpha indices for intercoder reliability were within the acceptable benchmark values of .70–.80 (Larson-Hall, Reference Larson-Hall2010), while varying across linguistic levels (α = .99 for morphological errors; α = .84 for syntactic errors; α = .74 for lexical errors).
Fluency
We specified three major subcomponents of utterance fluency as speed, breakdown, and repair fluency. Furthermore, motivated by recent findings on the multidimensional nature of pausing behavior (Kahng, Reference Kahng2018; Saito et al., Reference Saito, Ilkan, Magne, Tran and Suzuki2018), we computed a fine-grained set of breakdown fluency measures in relation to pause locations as well as frequency and duration. Following Bosker et al. (Reference Bosker, Pinget, Quené, Sanders and de Jong2013), unfilled pauses were defined as silence longer than 250 milliseconds. With the assistance of automated detection of silence, the researcher manually coded the boundaries of clauses and pauses using Praat (Boersma & Weenink, Reference Boersma and Weenink2012).
Speed fluency
10. Articulation rate. The mean number of words per second, divided by total phonation time (i.e., total speech duration excluding pauses).
Breakdown fluency
11. Mid-clause pause ratio. The total number of unfilled pauses within clauses was divided by the total number of words.
12. Final-clause pause ratio. The total number of unfilled pauses between clauses was divided by the total number of words.
13. Filled pause ratio. The total number of filled pauses (e.g., ah, eh) was divided by the total number of words.
14. Mid-clause pause duration. Mean duration of pauses within clauses, expressed in seconds.
15. Final-clause pause duration. Mean duration of pauses between clauses, expressed in seconds.
Repair fluency
16. Dysfluency rate. The mean number of dysfluencies (false starts, repetitions, reformulations, and self-corrections) per minute, divided by total speech duration (including pauses).
Pronunciation
Following Trofimovich and Isaacs (Reference Trofimovich and Isaacs2012), we employed pronunciation measures capturing different phonetic phenomena including segmentals and suprasegmentals. Our speech data, however, included a number of mid-clause breakdowns that obscure thought group boundaries. Therefore, we excluded intonation measures such as pitch appropriateness.
17. Segmental error rate. The mean number of phonemic substitutions per 100 segments.
18. Syllable structure error rate. The mean number of vowel and consonant insertion and deletion errors per 100 syllables.
19. Word stress error rate. The mean number of word stress errors in polysyllabic words per 100 segments.
20. Rhythm. The mean number of correctly reduced syllables per 100 obligatory vowel reduction contexts in both polysyllabic words and function words.
These pronunciation measures were coded by a phonetically trained coder with L1 English background, and another second native coder annotated a randomly selected 25% of the data to check the intercoder reliability. All the Cronbach alpha indices were within the acceptable benchmark values of .70–.80 (Larson-Hall, Reference Larson-Hall2010), while varying across phonetic features (α = .98 for segmentals; α = .95 for syllable structure; α = .77 for word stress; α = .88 for rhythm).
Discourse
The current study also sheds light on discourse features of speaking performance. First, we selected the total number of words to broadly capture the amount of semantic information expressed in speech. Second, we also decided to investigate the coherence of spoken texts. Because the coherence of discourse is enhanced by linguistic markers of cohesion (Halliday & Hasan, Reference Halliday and Hasan1976), we selected two major aspects of cohesion: conjunctive and lexical cohesion.
21. Total number of words. The total number of words produced excluding dysfluency words.
22. Connectives frequency. The mean number of different types of connectives (causal, logical, adversative/contrastive, temporal, and additive) per 100 words, obtained with the assistance of Coh-Metrix.
23. Latent semantic analysis. This index, produced by Coh-Metrix, represents the conceptual similarity of each sentence to adjacent sentences in the text based on the semantic overlap between words in the sentences.
ANALYSIS
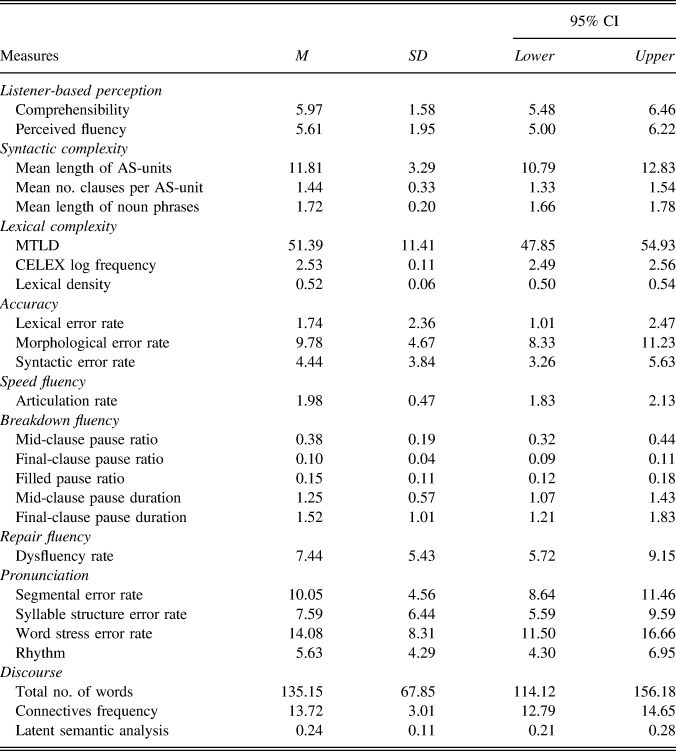
First, we checked the interrater reliability of comprehensibility and fluency judgments using the Cronbach alpha reliability index. The 10 inexperienced raters were consistent in their judgments of comprehensibility (α = .94) and perceived fluency (α = .96). Therefore, their judgments for both constructs were averaged to compute mean comprehensibility and perceived fluency scores for each speaker. The descriptive statistics of both judgment scores and linguistic measures are summarized in Table 1. The Shapiro-Wilk normality tests confirmed that both judgments were normally distributed. As regards linguistic measurements, a visual inspection of distributions as well as the Shapiro-Wilk normality tests suggested that several linguistic measures were not normally distributed. We therefore selected nonparametric statistical tests to correlate comprehensibility and perceived fluency judgments with linguistic measures. Effect sizes were interpreted using Plonsky and Oswald’s (Reference Plonsky and Oswald2014) guidelines. Moreover, multiple regression analyses were used to address the relative weights of linguistic dimensions in comprehensibility and fluency judgments. The assumptions of multiple regression were checked in terms of normality, outliers, the independence of error terms (the Durbin-Watson tests) and multicollinearity among predictor variables (variance inflation rate [VIF]), following Plonsky and Ghanbar (Reference Plonsky and Ghanbar2018). In addition to statistical analyses, raters’ postrating responses were coded in relation to various linguistic dimensions, and the raw frequency of raters who mentioned each coding label was counted separately for comprehensibility and fluency judgments.
Descriptive statistics of comprehensibility and perceived fluency judgments and CAF measurements

Note: Both comprehensibility and perceived fluency scores were based on 10 native listeners’ judgments on a 9-point scale (1 = hard to understand, 9 = easy to understand for comprehensibility; 1 = not fluent at all, 9 = very fluent for perceived fluency).
RESULTS
To answer our first research question about the distinct nature of perceived comprehensibility and fluency, we examined the relationship between comprehensibility and fluency judgments. The Pearson correlation showed a strong significant relationship between them (r = .95, p < .001). However, a paired-sample t-test revealed that the perceived fluency of L2 speech was significantly lower than comprehensibility with a small effect size (t(39) = 3.59, p < .001, d = .20).
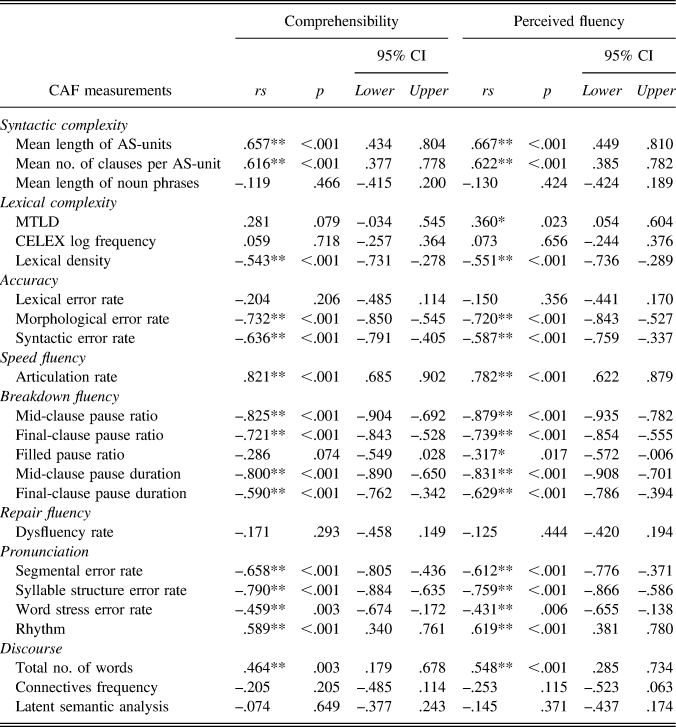
Our second and third research questions enquired into the linguistic correlates of native listeners’ comprehensibility and fluency judgments. Initially, a set of Spearman rho correlation analyses was performed to examine the associations between these two constructs and linguistic measurements. As indicated in Table 2, both judgments were significantly correlated with all the linguistic measures except for mean length of noun phrases, CELEX log frequency, lexical error rate, dysfluency rate, frequency of connectives, and latent semantic analysis. In addition, speed and breakdown fluency measures showed strong associations with both judgment scores, and syntactic complexity, morphological accuracy, and pronunciation aspects were also closely related to both constructs.
Results of Spearman correlation analyses between comprehensibility and perceived fluency judgments and CAF measurements

Note: * indicates p < 0.05; ** indicates p < 0.01.
To further investigate the relative weights of linguistic dimensions in comprehensibility and perceived fluency judgments, a set of stepwise multiple regression analyses was performed. As preliminary analyses, two steps were taken for both regression analyses to reduce the number of predictor variables (linguistic measurements). First, we excluded the linguistic measures that were not correlated with the outcome variables (comprehensibility and perceived fluency). Second, to avoid potential multicollinearity, intercorrelations were checked respectively for each dimension of linguistic measurements (complexity, accuracy, fluency, pronunciation, and discourse; see Supplementary Information), with rs > .90 as the exclusion criterion (Plonsky & Ghanbar, Reference Plonsky and Ghanbar2018). Finally, all the remaining linguistic measurements were submitted to stepwise multiple regression analyses. The statistical power of our dataset (N = 40) both for comprehensibility (at maximum 16 predictors) and for fluency (at maximum18 predictors) to detect a medium effect size was .65, which could be considered beyond the minimum requirement for SLA research (> .50) (Larson-Hall, Reference Larson-Hall2010).
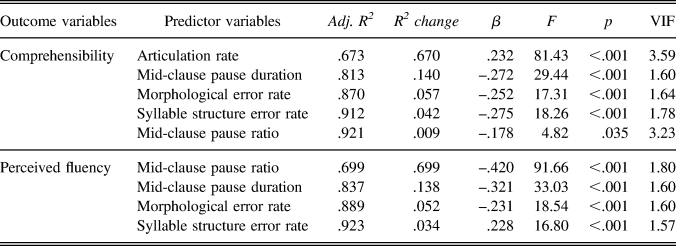
As summarized in Table 3, the regression model for comprehensibility included five linguistic predictors (articulation rate, mid-clause pause duration, morphological error rate, syllable structure error rate, and mid-clause pause ratio), accounting for 92.1% of the total variance with no evidence of strong collinearity (VIF = 1.60–3.59). The model did not violate other assumptions including normality, outliers, and the independence of error terms. All the remaining analyses met these assumptions. According to this model, our raters’ comprehensibility judgments were predicted primarily by speed fluency and secondarily by breakdown fluency, grammatical accuracy, and pronunciation.
Results of multiple regression analyses for CAF measurements as predictors of comprehensibility and perceived fluency

The regression model for perceived fluency is also summarized in Table 3. The model included four linguistic measures as predictor variables (mid-clause pause ratio, mid-clause pause duration, morphological error rate, and syllable structure error rate) without strong collinearity among them (VIF = 1.57–1.80), accounting for 92.3% of the total variance. This model suggests that our inexperienced listeners attended primarily to breakdown fluency aspects (mid-clause pause ratio and duration) and secondarily to morphological and pronunciation accuracy in their fluency judgments. The breakdown fluency measurements included in the model were limited to mid-clause pausing behavior.
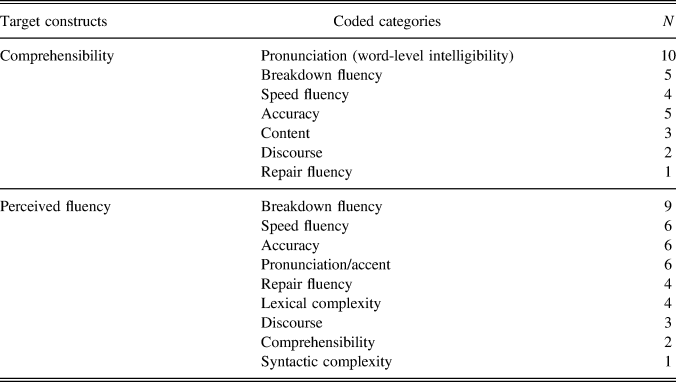
Finally, to supplement these statistically robust predictors, raters’ postrating responses were also examined (see Table 4). The results showed that although qualitative findings were generally consistent with statistical results, our raters paid attention to a whole range of linguistic dimensions in making their comprehensibility and fluency judgments. As for comprehensibility, all the raters mentioned word-level intelligibility, indicating that the ease of understanding a whole utterance is dependent on the ease of capturing individual words in the utterance. Regarding perceived fluency, some raters mentioned that comprehensibility played a role in their fluency judgments.
Descriptive summary of the raters’ awareness during comprehensibility and fluency judgments

Note: N = the number of raters who mentioned a certain category.
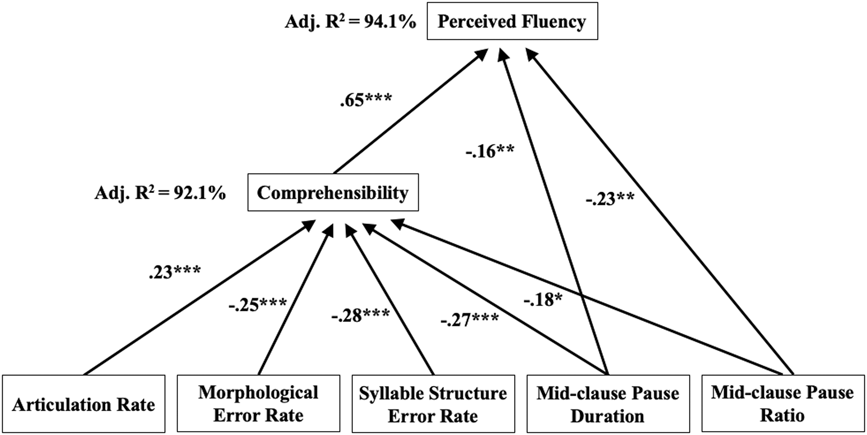
Building on this qualitative finding, we computed a follow-up regression analysis to further investigate which linguistic dimensions were associated with perceived fluency when comprehensibility judgments were controlled for. Specifically, a hierarchical regression analysis was conducted with the following order of entry of predictor variables into the model: comprehensibility judgments > four significant predictor variables for the initial perceived fluency regression model (mid-clause pause ratio and duration, morphological error rate, and syllable structure error rate). As shown in Table 5, the regression analysis revealed that mid-clause pause ratio and duration significantly further contributed to perceived fluency judgments, explaining 94.1% of the total variance. The comprehensibility score was the strongest predictor, independently accounting for 91.4% of the variance in perceived fluency judgments. With the inclusion of the two breakdown measures, an additional 2.7% of the variance was explained. The finalized regression model is visualized in Figure 1 with standardized beta coefficients.
Results of a hierarchical multiple regression analysis for perceived fluency

The visualization of hierarchical multiple regression analysis for perceived fluency.
Note: * p < .05, ** p < .01, *** p < .001.

DISCUSSION
RELATIONSHIP BETWEEN COMPREHENSIBILITY AND PERCEIVED FLUENCY
As regards the first research question of our study, the correlational analysis showed that our raters’ comprehensibility judgments were strongly associated with their fluency judgments. Derwing et al. (Reference Derwing, Rossiter, Munro and Thomson2004) also reported a strong correlation between listeners’ perceptions of comprehensibility and fluency. However, a comparison of the correlational strength of our dataset with theirs, using a Fisher-z transformation, shows that the relationship between fluency and comprehensibility in our study is significantly stronger than the one in the two monologic tasks of their research (r = .64, p <.001; r =.87, p =.03). The difference in the strength of association may pertain to the different operationalization of fluency between the two studies. Our study focused on higher-order fluency whereas they instructed listeners to judge fluency as lower-order fluency. Thus, these findings may indicate that higher-order fluency is more strongly associated with comprehensibility than lower-order fluency, confirming the conceptual similarity between comprehensibility and higher-order fluency. Comprehensibility is typically defined as the ease of understanding (e.g., Derwing & Munro, Reference Derwing and Munro2009), whereas higher-order fluency refers to “the degree to which listener attention is held” (Lennon, Reference Lennon and Riggenbach2000, p. 34). Therefore, more comprehensible speech enables listeners to maintain their attention more easily while extracting meaning from the speech, suggesting that highly comprehensible speech tends to be simultaneously perceived as highly fluent speech.
Despite a large overlap between comprehensibility and fluency judgments, a paired-sample t-test showed a weak, but significant difference between the scores, revealing that inexperienced native listeners tend to assign more generous scores to comprehensibility than to fluency (Derwing et al., Reference Derwing, Munro and Thomson2008). This result suggests that, in terms of rater severity, comprehensibility and fluency are distinguishable constructs. One possible explanation for the different severity of judgments is that raters might have assigned different meanings to higher endpoints of the 9-point scale. As regards fluency judgments, raters might have compared the efficiency of L2 speech with their own language system (i.e., monolingual native speakers’ oral proficiency), as naïve listeners tend to regard fluency as a proxy for overall proficiency (Tavakoli & Hunter, Reference Tavakoli and Hunter2018). However, they might have made their comprehensibility judgments on how easily they could extract meaning of L2 speech without referring to nativelike attainment of oral proficiency, suggesting that the highest score could have been assigned when the speech was highly understandable but not necessarily close to nativelike performance.
LINGUISTIC DIMENSIONS OF COMPREHENSIBILITY
According to our multiple regression analysis, listeners’ perception of comprehensibility was related to articulation rate, mid-clause pause duration, morphological errors, syllable structure errors, and mid-clause pause ratio. The regression model identified articulation rate as the best predictor. The articulation rate measure can indicate two different aspects of speed fluency: the speed of overall delivery and of articulation of individual words. As regards the first aspect, our findings confirm that comprehensibility—ease of understanding—is highly dependent on how smoothly information is delivered in speech. Such a close relationship between comprehensibility and speed fluency has been reported in the context of picture narrative/description tasks in previous research (Saito, Trofimovich, et al., Reference Saito, Trofimovich and Isaacs2016; Trofimovich & Isaacs, Reference Trofimovich and Isaacs2012). The relevance of the second aspect of articulation rate is also confirmed by our judges’ postrating responses. All the raters mentioned that they were sensitive to word-level intelligibility while making their comprehensibility judgments. Therefore, it seems plausible to argue that the articulatory speed of individual words may contribute to the ease of capturing individual words (i.e., word-level intelligibility). This argument is further supported by the significant role of another predictor: syllable structure error rate. All the L2 speakers in the study spoke Japanese as their L1, which is a mora-timed language. Less competent L2 speakers from an L1 Japanese background tend to substitute mora-based timing to pronounce English words, and they often add extra vowels (i.e., epenthesis), leading to longer duration of word-level production (Saito, Reference Saito2014). In other words, syllable structure errors can result in slower articulatory speed of individual words. This close relationship between speed fluency and pronunciation accuracy was also indicated by the strong correlation between these measures (rs = –.670, p < .001). Therefore, comprehensibility judgments in the case of our participants may pertain to the ease of capturing individual words as well as perceptions of overall smoothness of delivery.
The regression model also highlighted the crucial role of breakdown fluency in comprehensibility. The results showed that longer pauses within clauses tend to impede raters’ understanding of L2 speech. From a psycholinguistic perspective, pausing behavior within clauses forces listeners to make additional cognitive effort to retain previous parts of a linguistic text in their phonological short-term memory without transforming them into propositional form (see Harley, Reference Harley2014). This phenomenon was directly mentioned in some raters’ comments as illustrated:
• I also found that prolonged pausing, and use of words such as “um” and “er” significantly affected comprehensibility, and required a large effort to maintain concentration to understand what was being said. (Rater ID9)
Because comprehensibility is operationalized as the amount of cognitive effort needed to understand speech (Derwing & Munro, Reference Derwing and Munro2009), longer pauses within clauses arguably lower comprehensibility. It is, however, noteworthy that mid-clause pause duration is more closely associated with comprehensibility than mid-clause pause ratio, as suggested by the standardized coefficients (β = –.272 for duration, β = –.178 for ratio). Additionally, other breakdown fluency measurements were not included in our model, suggesting that listeners’ perceived comprehensibility is relatively independent of pausing behavior at clausal boundaries as well as filled pauses.
Moreover, morphological accuracy was also included in the regression model with a weak explanatory power of comprehensibility judgments. In our dataset, while morphological errors accounted for 62.4% of errors made by a total of 40 speakers, the major sources for morphological errors were limited to three types of morphological features: singularity of nouns (23.8%), the use of articles (20.7%), and the appropriateness of prepositions (9.5%). Errors in general impose additional cognitive effort because interlocutors have to make inferences about the intended meaning, which can consequently lower comprehensibility. Although a weak association between comprehensibility and grammatical accuracy was reported in prior research, most studies found that lexical appropriateness was related to comprehensibility to a larger extent than grammatical accuracy (Saito, Trofimovich, et al., Reference Saito, Trofimovich and Isaacs2016; Saito, Webb, et al., Reference Saito, Trofimovich and Isaacs2016; Trofimovich & Isaacs, Reference Trofimovich and Isaacs2012). However, the current study suggests that comprehensibility of argumentative speech is associated more strongly with grammatical accuracy than with lexical appropriateness. A possible explanation for these contradictory findings may lie in the nature of the speech elicitation task in our study. Previous studies that evidenced a robust influence of lexical appropriateness on comprehensibility utilized picture narrative tasks. To avoid familiarity bias, researchers familiarize their raters with the picture prompts before the raters listen to speech samples. Therefore, raters can expect a set of vocabulary items necessary to perform the task, and hence lexical appropriacy might play a stronger role in their judgments (Crowther et al., Reference Crowther, Trofimovich, Isaacs and Saito2017). Meanwhile, our argumentative task was more flexible in terms of content as speakers could conceptualize their own arguments relating to the topic. Accordingly, our listeners did not have expectations toward a set of obligatory vocabulary items as specifically as in the picture narrative tasks. In addition, due to the lack of visual information, they had to pay close attention to morphological features to understand the exact meaning of the participants’ speech. In narrative tasks, visual prompts help listeners to identify which objects the speaker is talking about despite the lack of definite articles or the errors of plurality, whereas the absence of such visual information in an argumentative task may force listeners to compensate for errors with their own inference. Thus, morphological errors in the argumentative task might be perceived as more seriously impeding successful communication than in picture narratives. Therefore, our results may indicate that task characteristics might play a role in the predictive value of lexicogrammatical accuracy in comprehensibility judgments.
Finally, it is noteworthy that comprehensibility judgments in our dataset were largely predicted by temporal aspects while previous studies reported the primary role of factors related to pronunciation (e.g., segmental accuracy in Shintani & Saito, 2016). One possible explanation for the contradictory findings might be related to the different range of participants’ proficiency levels in our research and in previous studies. Most previous studies have recruited speakers from a wider range of proficiency (e.g., Saito, Trofimovich, et al., Reference Saito, Trofimovich and Isaacs2016), whereas our participants’ proficiency levels were mostly intermediate. Therefore, these divergent results may indicate that the relative weights of linguistic dimensions underlying comprehensibility might vary depending on the speakers’ level of proficiency.
LINGUISTIC DIMENSIONS OF PERCEIVED FLUENCY
Our regression model for perceived fluency judgments revealed that listeners’ perception of fluency was associated with a similar range of linguistic dimensions to that of comprehensibility: mid-clause pause ratio and duration, morphological error rate, and syllable structure error rate. According to postrating comments, all raters in this study defined perceived fluency as overall L2 proficiency in line with Tavakoli and Hunter’s (Reference Tavakoli and Hunter2018) finding that fluency tends to be equated with overall command of language. Therefore, the current study discusses perceived fluency as listeners’ inference of the extent to which the speaker’s overall L2 system is developed (Lennon, Reference Lennon1990, Reference Lennon and Riggenbach2000). Following this conceptualization of fluency, the regression model showed that grammatical accuracy, breakdown fluency, and pronunciation dimensions are associated with listeners’ perceptions of L2 oral proficiency. In other words, native listeners intuitively judge the speaker’s overall proficiency in terms of both temporal and nontemporal aspects of speech.
Our regression model showed that temporal aspects related to mid-clause pausing were found to be primary cues for fluency judgments. Meanwhile, fluency judgments were not significantly related to breakdown fluency measures based on final-clause pausing, indicating that the location of pauses plays an important role in determining native listeners’ fluency judgments. Mid-clause breakdowns have been generally assumed to signal difficulties in linguistic encoding processes such as lemma retrieval and morphosyntactic encoding (i.e., formulation; Götz, Reference Götz2013; Kormos, Reference Kormos2006). Previous studies have shown that L2 speakers produce significantly more mid-clause pauses than L1 speakers and that more proficient L2 learners tend to produce fewer pauses within clauses (De Jong, Reference De Jong2016; Tavakoli, Reference Tavakoli2011). In other words, mid-clause pauses can be considered to indicate the degree of automatization of L2 linguistic encoding mechanisms. In contrast, final-clause pauses reflect planning of the speech content and its manner of presentation (i.e., conceptualization), and as such are relatively independent of the degree of automatization of language processing. This is supported by the fact that the frequency of final-clause pauses has not been found to differ significantly between L1 and L2 speakers (De Jong, Reference De Jong2016; Tavakoli, Reference Tavakoli2011). Taken together, native listeners are intuitively aware of the multidimensional nature of breakdowns, and are therefore able to identify mid-clause pausing behavior as a valid indicator of oral proficiency.
In addition to breakdown fluency of speech, our native listeners’ judgments of fluency were, to a lesser degree, associated with a nontemporal feature of L2 speech: morphological accuracy and pronunciation. The effects of grammatical accuracy on fluency judgments have also been reported in previous studies (e.g., Kormos & Dénes, Reference Kormos and Dénes2004; Rossiter, Reference Rossiter2009). One possible reason why raters were sensitive to morphological errors is that morphological errors tended to be relatively salient in our speech dataset (62.4%), compared to syntactic (25.6%) and lexical errors (12.0%). Some raters’ qualitative responses showed that their fluency judgments were affected by nontargetlike use of morphemes:
• I did not rate them highly [fluent] if they … didn’t use the plural when they should have. (Rater ID8)
• Missing out articles and prepositions can come across poorly. (Rater ID4)
Another linguistic dimension predicting listener’s holistic judgments on L2 oral proficiency is syllable structure accuracy. As discussed previously, a possible explanation for the significant role of syllable structure accuracy is related to the phonological difference between our speakers’ L1 and L2 (Japanese vs. English); less competent Japanese-speaking learners of English are likely to substitute mora-based syllable structure for English syllable structure (Saito, Reference Saito2014). Therefore, it seems plausible to argue that native listeners judge L2 speakers’ oral proficiency in terms of the extent to which their L2 phonological system is affected by another language.
Previous findings have also shown that higher-order fluency is associated with both temporal and nontemporal aspects of speech, using simple correlational analyses complemented with brief interviews with raters (Kormos & Dénes, Reference Kormos and Dénes2004) or a thorough qualitative investigation (Préfontaine & Kormos, Reference Préfontaine and Kormos2016). Our study, while controlling for the effects of other predictors by a multiple regression analysis, further confirmed that listeners’ judgments of higher-order fluency are associated with both temporal and nontemporal aspects of speech. This quantitative approach is common among studies focusing on lower-order fluency (e.g., Bosker et al., Reference Bosker, Pinget, Quené, Sanders and de Jong2013; Préfontaine et al., Reference Préfontaine, Kormos and Johnson2016). However, our regression model was slightly different from such previous studies in the relative weights of predicative values among utterance fluency measures. For instance, Saito et al.’s (Reference Saito, Ilkan, Magne, Tran and Suzuki2018) study, which considered the role of pause locations and the triad of fluency subdimensions (speed, breakdown, and repair fluency), revealed that the best predictor of fluency judgments was articulation rate (speed fluency), followed by mid- and final-clause pause ratios (breakdown fluency) in the context of a picture description task. Our findings, however, showed that only breakdown fluency was included in the regression model. These contrasting findings should be interpreted with respect to methodological differences. One possible interpretation is that if native listeners are instructed to focus exclusively on temporal aspects (i.e., lower-order fluency; Saito et al., Reference Saito, Ilkan, Magne, Tran and Suzuki2018), they can prioritize aspects of speed fluency over breakdown fluency. By contrast, the absence of such an instruction, as in our study, may allow listeners to focus intuitively on breakdowns as an indicator of speakers’ overall proficiency. Another reason for the different order of predicative strengths may lie in the nature of speech elicitation tasks and their different speech processing demands. In this study, the raters listened to the entire speech for the sake of higher ecological validity, mirroring real-world L2 communication. Meanwhile, Saito et al. (Reference Saito, Ilkan, Magne, Tran and Suzuki2018) used 30-second excerpts created by combining initial 10-second excerpts segmented at phrase boundaries from three different picture descriptions. As their study allowed for planning time and used initial excerpts, their combined speech stimuli may have been less likely to include pauses. In addition, as explained in the review of literature, the picture description tasks in Saito et al. (Reference Saito, Ilkan, Magne, Tran and Suzuki2018) posed different speech processing demands compared to the argumentative task in our research. In the current study, the speakers were required to plan their ideas and the order of presentation while producing speech, and consequently might not have had sufficient attentional resources to devote to linguistic encoding processes. Therefore, the argumentative task in our study may have required speakers to deal with more speech processing demands relating to content, which might have led to more breakdowns within clauses. From the listeners’ point of view, such breakdown behavior might have been more prominent than the speed of articulation in our study.
DISTINGUISHABILITY OF COMPREHENSIBILITY AND FLUENCY
Motivated by our primary research objective, the distinguishability of comprehensibility and perceived fluency was further examined by performing hierarchical regression modeling. The finalized regression model highlighted three major findings. First, in line with the correlational results as well as raters’ postrating comments, comprehensibility judgments were the strongest predictor for fluency judgments, confirming the conceptual similarity between comprehensibility and perceived fluency. Second, morphological error rate and syllable structure error rate were not included in the model. In other words, although accurate use of grammatical items and substitutions of L1 syllable structure were potentially indicative of overall proficiency (i.e., higher-order fluency), both of them might have been indirectly related to perceived fluency through comprehensibility. One possible explanation for this might be that inexperienced native listeners tend to prioritize temporal aspects over grammatical and pronunciation aspects to detect the degree of automatization. Previous literature on fluency also argues that fluent speech allows errors to pass unnoticed by listeners (Lennon, Reference Lennon and Riggenbach2000). Finally, our finalized model revealed that although mid-clause pause ratio and duration were indirectly associated with perceived fluency through comprehensibility, both of them directly made additional unique contributions to the total variance of perceived fluency, albeit controlling for the variance of comprehensibility judgments. This dual role of mid-clause pausing behavior adds empirical support to our aforementioned interpretation that pauses within clauses impose additional cognitive effort for listeners to maintain part of the utterance before a pause in short-term memory. In addition, longer and frequent pauses within clauses can also be intuitively identified as indicators of linguistic retrieval problems by listeners.
CONCLUSION
Motivated by the lack of studies closely examining the relationship between comprehensibility and higher-order fluency, the current study investigated the linguistic dimensions underlying each construct in the context of L2 argumentative speech produced by 40 Japanese-speaking learners of English. The strong association found between raters’ judgments of fluency and comprehensibility suggests that these two important aspects of L2 oral communication are not only conceptually overlapping, but are also difficult to distinguish in evaluating L2 learners’ speech. However, our findings also indicate that fluency ratings can be potentially more severe than evaluations of comprehensibility and are predicted by a similar set of linguistic characteristics with different relative weighs among them.
Our results highlight that, in the evaluation of comprehensibility, raters’ efforts in processing speech produced by Japanese learners of L2 English are largely influenced by the articulatory speed of individual words. Although clarity of pronunciation of individual words is undeniably an important feature of comprehensibility, the results pertaining to the articulation rate of words might be specific to the mora-timed nature of the participants’ Japanese L1 background. Further research would be necessary to replicate this finding with speakers whose L1 is not mora-timed. Our research might also offer insights for the automated assessment of fluency and comprehensibility, as our regression models showed that temporal and linguistic predictors that can be analyzed using computer software can explain relatively large variance in human ratings.
Our research has several limitations, one of which is its relatively small sample size and the use of only one type of task for speech elicitation. Moreover, comparing primary predictors for comprehensibility with previous studies, our findings suggest that the relative weights of linguistic dimensions underlying listeners’ perception might be mediated by speakers’ proficiency levels. Future studies with a larger number of participants from different proficiency levels would be needed that examine additional task types. Regarding our regression models, although our VIF values indicated the acceptable multicollinearity of models, it is noteworthy that there were several significant correlations among predictors (see Supplementary Information). Care also needs to be taken in generalizing our findings to speakers from different L1 backgrounds and to languages other than English. Further research should be conducted with language learners from more varied L1 backgrounds and with target languages other than English.
SUPPLEMENTARY MATERIAL
To view supplementary material for this article, please visit https://doi.org/10.1017/S0272263119000421