

Background
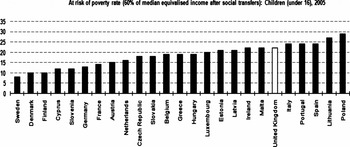
International comparisons of child well-being have tended to rely on income poverty measures. The World Bank uses various dollar per day per person measures in developing countries. OECD and the Luxembourg Income Study (LIS) have almost exclusively relied on relative income poverty measures. The first and sixth Report Cards produced by the UNICEF Innocenti Centre drew on OECD and LIS income poverty data to compare children in rich countries. The EU's so-called Laeken Primary and Secondary indicators of Social Inclusion include few indicators relating to children, but the one that is most commonly presented is the proportion of children living in households with incomes less than 60 per cent of the median. The latest version of that is derived from the first output of the Survey of Income and Living Conditions (SILC) and is presented in Figure 1.
Child poverty rate in the EU 2005
Source: Eurostat Income and Living Conditions (2007).

The purpose of this article is to explore how child income poverty rates relate to a wider range of indicators of child well-being at international level. In the first section it draws on data for three sets of countries – the EU 25, the OECD and the CEE/CIS for which we have derived indices of well-being – to assess which indicators best represent well-being. The second section explores how income poverty relates to child well-being when more ‘up-to-date’ sets of estimates are used.
Indices of child well-being
As a response to the originally cautious approach to indicator development of the Indicators Sub Committee of the EU Social Protection Committee we made a first attempt at an index of child well-being for the EU 25 (Bradshaw et al., Reference Bradshaw, Hoelscher and Richardson2007a) drawing on existing survey and administrative data. Then when the UNICEF Innocenti Centre in Florence learned that we were doing this work, they asked us to adapt it so that they could produce a child well-being index for OECD countries as their Report Card 7 (UNICEF, 2007 and Bradshaw et al., Reference Bradshaw, Hoelscher and Richardson2007b). Then UNICEF in Geneva commissioned us to produce an index for the CEE/CIS, former communist bloc, countries (Richardson et al., forthcoming).
All three of these indices were produced using similar methods.Footnote 1 They conceptualised child well-being as a multidimensional construct; they had regard to the Convention on the Rights of a Child; and they drew on the experience of other national and international attempts to compare child well-being. Where possible we chose indicators where the child was the unit of analysis; and we gave priority to indicators that represented what children themselves felt about their lives. We also took the position that indicators of well-being were if anything more important than indicators of well-becoming.
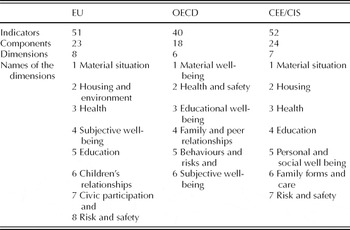
For each index, a comprehensive review of child and family datasets and surveys in the geographic/economic region was undertaken. Well-being indicators were derived from social surveys of children, in particular the Health Behaviour of School Children and the OECD PISA surveys for the EU and OECD indices, and the Young Voices Survey for the CEE/CIS index. In addition to survey data, we used indicators derived from administrative series collected by international bodies such as OECD, WHO and the World Bank. To combine indicators into components we used the average of z scores in preference to the average of ranks – on the grounds that z scores represent the degree of dispersion of a rank, not just the position. The structures of the indices though similar were not identical, because the same data were not available for all the countries and our funders asked for slightly varying classifications. The structure of the indices is summarised in Table 1.
Structure of the child well-being indices

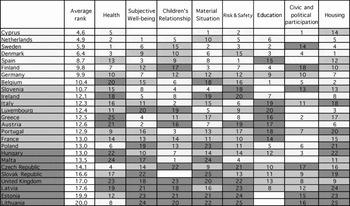
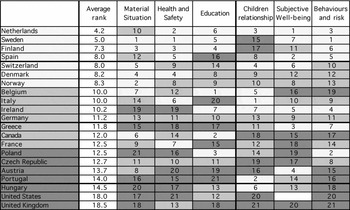
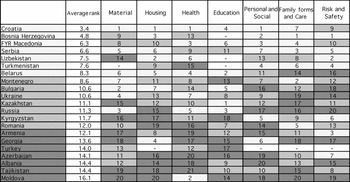
There were data missing for some countries in each of the groupings and, in order to compare like with like, we set a rule that a country could not be included in the overall index if it did not have at least 70 per cent of the data (for the UNICEF Report Card this threshold was 75 per cent). The following three figures summarise the overall league tables of the three groups of countries. Each set of countries is divided into three groups – top third, middle third and bottom third – and ranked according to their overall performance. The rank on each dimension (based on the average of the z scores for the components) is also given (see Figures 2–4).
Child well-being in the European Union

Child well-being in the OECD

Child well-being in the CEE/CIS Countries

Material well-being
It can be seen that material well-being was a dimension in all three of the indices. Child income poverty was one of the components of material well-being. In the case of the EU index, it was the Laeken indicator – proportion of children living below 60 per cent of the median equivalent income before housing costs circa 2003. In the case of the OECD index, it was the proportion of children living below 50 per cent of median equivalent income before housing costs circa 2000 (1999 for the UK). The EU adjust household income using the modified OECD equivalence scale, the OECD use the square root of the household size. The CEE/CIS index used World Bank (2005) data as its income poverty indicator – children aged less than 16 living in households where current consumption is less than $2.15 per person per day, converted from the national currencies using Purchasing Power Parities in 2002–03.
The reasons for these different choices were entirely pragmatic – they were the latest and most complete comparable data available for those sets of countries. However, there are problems with these measures, particularly in comparative research. These have been described at greater length elsewhere (Bradshaw, Reference Bradshaw, Hoelscher and Richardson2007), but briefly:
• They are based on survey questions to a single respondent in household surveys and there are reasons to be anxious about the reliability of the information obtained on the total income coming into the household.
• They are also issues to do with whether household income is a valid indicator of living standards as it excludes borrowing, dissaving, gifts and home consumption, and may not be distributed equally inside a household.
• Then to calculate poverty rates a threshold has to be imposed and the thresholds imposed are totally arbitrary – not based on any scientific understanding of what income generates an adequate living standard. Further, the level of living of relative thresholds based on 50 or 60 per cent of the national median are very different in different countries. For example, 60 per cent of the median for a couple with two children was Euros 2,777 per annum in Latvia and Euros 35,883 per annum in Luxembourg in 2005. Needless to say, these are very different real levels of living – even before taking into account differences in what the income has to buy.
• Then an equivalence scale has to be imposed to adjust income to family size and that equivalence scale is merely a guess at the economies of scale and relative needs of different families. Furthermore, equivalence scales do not sufficiently account for the varied costs of children by age (see Henman et al., Reference Henman, Percival, Harding and Gray2007 for instance),Footnote 2 or additional costs experienced by families with disabled children (Burchadt and Zaidi, 2008).
• Finally, we tend to use these methods to produce a child poverty rate but that does not tell us how far below the threshold the children are, or for how long, or how often.
These objections to income poverty rates have been the reasons that have led researchers (McKay, Reference McKay2004, Berthoud et al., Reference Berthoud, Bryan and Bardasi2004, Bradshaw and Finch, Reference Bradshaw and Finch2003), the Irish and UK governments, and now the EU, to employ income poverty measures together with other indicators of financial hardship.
In constructing the material well-being domains, we also did not rely on income poverty alone. In the case of the EU index, income poverty rates were combined with data on poverty gaps (the difference between the poverty rate and the median equivalised income of the poor), deprivation indicatorsFootnote 3 and the proportion of children living in workless families. In the OECD index, income poverty was combined with deprivation measures and the proportion of children living in workless families. In the CEE/CIS index, we combined the income poverty rate with indicators of deprivation and a subjective measure of financial well-being.
Findings
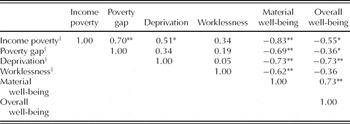
Tables 2–4 present correlation matrices of the indicators that make up the material well-being material dimension. Table 2 covers the EU countries. In this group of countries income poverty has the closest relationship with material well-being – the correlation coefficient (r = −0.83**) is higher than it is for the poverty gap, deprivation and worklessness indicators. However income poverty is not a particularly good indicator of overall well-beingFootnote 4 (r = −0.55*), which means that it only explains (r-squared) about 30 per cent of variation in overall well-being. The deprivation indicator actually has a much stronger relationship with overall well-being (r = 0.73**), explaining 53 per cent of the variation. In fact, the deprivation component is as good as the material well-being dimension in explaining overall well-being, despite the fact that it is only one of 23 components, whereas material well-being is one of eight dimensions contributing to overall well-being.
Correlation matrix: EU countries

Note: †These measures have not been reversed. Higher scores shows higher levels of poverty and deprivation.
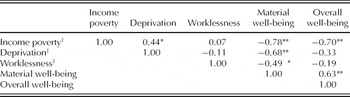
Correlation matrix OECD countries

Note: †These measures have not been reversed. Higher scores shows higher levels of poverty and deprivation.
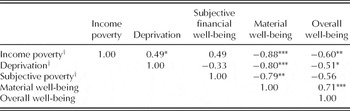
Correlation matrix CEE/CIS countries

Note: †These measures have not been reversed. Higher scores shows higher levels of poverty and deprivation.
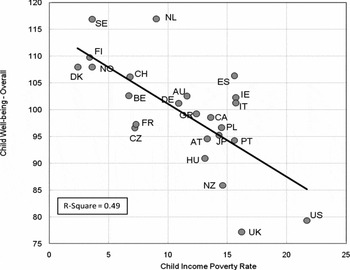
A slightly different picture emerges from the comparison of OECD countries in Table 3. Income poverty is the most important indicator contributing to material well-being and, despite being only one of 40 indicators, it also explains more of the variation in overall well-being than the material well-being component as a whole – despite the fact that the latter is one of only six dimensions contributing to overall well-being. Income poverty in the OECD countries explains 49 per cent of the variation in overall well-being. This makes it quite a good proxy indicator. The relationship between overall well-being and income poverty is shown in Figure 5.
Overall child well-being by child income poverty (OECD countries)

In the case of the CEE/CIS countries in Table 4, the correlation between material well-being and income poverty is high (r = −0.88**), indeed it is higher than associations between material well-being and the deprivation and subjective poverty indicators. However, income poverty does not have a very strong correlation with overall well-being in this group of countries. Material well-being is a better proxy for overall well-being explaining 50 per cent of the variation.
Of course, the flaw so far with this analysis of the relationship between income poverty and overall well-being is that income poverty is one of the indicators making up overall well-being, although it is only one of 51 in the EU, one of 40 in the OECD and one of 52 in the CEE/CIS.
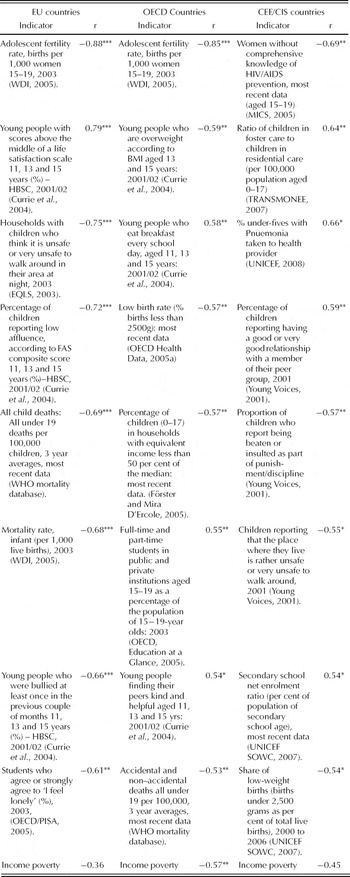
In order to deal with this problem in Table 5 we list the eight indicators with the closest correlation with overall well-being in rank order. In this case, overall well-being is measured without the material dimension. Child income poverty emerges as one of the top eight indicators only in the case of the OECD countries – with a correlation coefficient of r = −0.57**. That means it explains only 32 per cent of the variation in overall well-being. In the EU countries and the CEE/CIS countries, income poverty is no longer significantly correlated with overall child well-being.
Correlations between individual indicators and overall child well-being (excluding material deprivation)

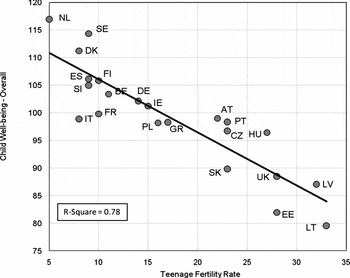
There are other variables that explain much more of the variation in overall well-being in all groups of countries. In particular, the relationship between overall well-being and the adolescent fertility rate is striking in both the EU and OECD countries. Figure 6 plots this relationship for the EU countries. It appears that those countries that succeed in protecting their young women from early pregnancy have higher levels of overall child well-being, and in those countries with higher overall well-being among children, young women avoid getting pregnant.
Overall well-being by the adolescent fertility rate (EU countries)

Changes in income poverty
This section introduces new poverty data for at risk of poverty and relative poverty gaps from Eurostat, recalculates the EU 25 index and repeats the analysis of poverty variables introduced above. It is perhaps tempting at this point to see the recalculated EU 25 index as an update – it is not. Rather it should be seen as what would have been found had we waited less than a year for new poverty data to become available (bear in mind the important surveys of HBSC and PISA could not have been updated in this time period also). The purpose of performing this analysis, expanded on below, is to show whether the government was correct in highlighting ‘old’ income poverty data specifically as one reason for poor UK performance on these indices, and by association whether the continued focus on poverty rates (and importantly not poverty gaps) is synonymous with a focus on general levels of child well-being.
Following the launch of the UNICEF report card on child well-being, and the recognition of the relatively poor performance of the UK, the UK government claimed that the data were out-of-date and, in particular, that account was not taken of the reduction in child poverty in the UK since 1999. For this reason, the government believed the UK standing in relation to other countries was underrepresented. Importantly, with the exception of adolescent fertility rates, no mention was made of improvements in, or problems with, indicators in other parts of the index. Earlier in 2007 we had published the European Union index, here too the UK performed relatively poorly (see Figure 2), and though the poverty data in this index were more up to date it was still four years old. So what if we had waited for more recent comparable data to emerge? What effect would the government's efforts to reduce child poverty have had on the overall ranking of the UK in the EU 25? New data from European Union Survey of Income and Living Conditions for 2005 can help us address this question.
A further reason for performing this analysis is that by including this newer data we can explore how robust is the ranking of child well-being – how sensitive it is to changes in income poverty while other variables are held constant. If we use the poverty rates and gaps data for 2005 (which we would have used if they had been available), does it impact on how well income poverty represents overall well-being? If the explanatory power of poverty measures increase substantially, it may justify the use of this measure for representing children's outcomes cross-nationally, independent of other well-being indicators (notwithstanding unavoidable methodological restrictions and time lags due to limited availability of cross-national survey data). If it is not the case, then we have further evidence that the poverty measures need to be complimented with a range of other well-being items in order to represent experiences of outcomes in childhood.
Before presenting the results, it is important to note that the Eurostat child poverty estimates for 2003 and 2005 are not comparable for all countries. This is due to the fact that national survey sources were used for some countries in 2003, and the EU SILC survey did not start for some countries until 2005. Nonetheless, we use these data because they represent the best estimates in their own right for each year. Also the analysis assumes that the other variables in the indices are independent of income poverty, or in other words changes in poverty between 2003 and 2005 have not led to changes in other indicators. This is not unreasonable given our interest is in testing the sensitivity of the overall index to recent changes in income poverty and how well the new data on poverty rates and gaps can represent overall well-being, but it is worth remembering in practise this is unlikely to be the case.Footnote 5
Findings
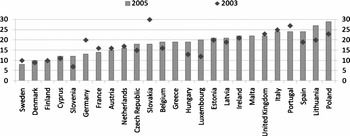
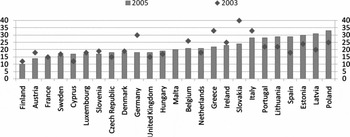
It can be seen from Figure 7 that the UK has slightly improved its European standing in a comparison of child income poverty rates between 2003 and 2005, and is in a group of only nine countries to estimate a reduction in child income poverty since 2003.
Child income poverty rates 2003 and 2005
Note: At risk of poverty rate (60 per cent of median equivalised income after social transfers): Children (under 16)
Source: Eurostat Income and living conditions (2007).

Figure 8 presents the poverty gap estimates for 2003 and 2005. Around half of the EU 25 countries have had reductions in their poverty gap estimates since 2003: Germany, Greece and Slovakia lead this group. The intensity of child income poverty in the remainder of European countries has been increasing: among this group is the United Kingdom.
Child poverty gaps 2003 and 2005
Note: Relative poverty gap (60 per cent of median equivalised income): Children (under 16)
Source: Eurostat Income and living conditions (2007).

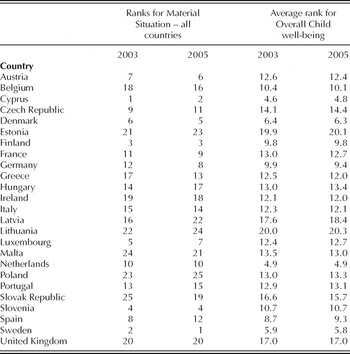
Table 6 shows that regardless of the improvement in its child poverty rates and the deterioration in its child poverty gaps, as well as the changes that have taken place in other countries, the UK has not changed its position in the league table of countries for either the material situation or overall child well-being. This provides us with the first answer. Based upon the available data for all well-being measures, and updating the index for the most recent poverty estimates, the standing of the UK in the context of child well-being in the European Union does not improve. Although there are improvements made to the rates of child poverty relative to earlier rankings, and a decrease in the variance (which powers the implicit weight of the poverty scores in calculating the index), both series indicate high levels of poverty. Furthermore, the poverty gap estimate for the UK is higher in 2005 than in 2003, more than counterbalancing improvements made by child income poverty rates.
Change in the ranking of EU countries on child poverty rates and child poverty gaps

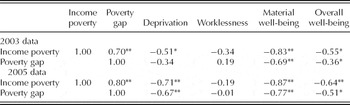
Table 7 presents the correlation matrix of the indicators that make up the material well-being material dimension for the EU25 index for both 2003 and 2005 poverty rates and gaps data. It can be seen that using data from 2005 increases the correlation coefficients between rates and gaps and between both rates and gaps and deprivation. Although there is no increase in the coefficient with children in workless households, there is an increase in the coefficient with material well-being. The coefficients between child income poverty, material well-being and overall well-being also improved. This answers the second question. By using 2005 poverty data, the relationship between material well-being and overall well-being is closer. However this conclusion does not change the previous findings: income poverty is still not a particularly good indicator of overall well-being (r = −0.64**) when compared to measures such as teenage fertility (r = −0.88**), life satisfaction (r = 0.79**) or safe local environments (r = −0.75**).
Correlation matrix for the EU Index comparing 2003 and 2005 poverty data

Conclusion
We have shown that child income poverty is not the most satisfactory single proxy for aggregate child well-being when compared to other single contributory indicators. If we are going to rely on single indicators to proxy child well-being, there are several comparatively better ones to choose. That said, in order to effectively monitor children's overall well-being we believe it best to adopt the kind of multi-dimensional index that we have begun to develop.
Importantly for policy choices is an acknowledgement that the government does not have the same extent of knowledge about causal pathways to, and degree of control over, each indicator in the index. Consequently, it is not surprising that child poverty has become a policy focus in recent years. The academic interest in child poverty has produced a lot of persuasive arguments for tackling the problem and explaining causes of child poverty. Additionally, the policy instruments for changing child poverty (basically changing child-related taxes and benefits) are relatively well developed and have a direct connection to the child outcome sought. Costing any policy change to reduce child poverty is also straightforward. There is little lag time from any policy change to a reduction in child poverty. It is therefore tempting for governments to focus much of their policy for improving child well-being on reducing child poverty. In contrast, these arguments do not, for example, hold so strongly for other inputs into the child well-being index, including measures of children's life satisfaction, improving the quality of neighbourhoods or even reducing rates of teenage fertility.
The child well-being indices were developed to test the ground in terms of available data: to show what was available in terms of indicators of children's lives cross-nationally, and how they might be used to inform international comparisons of children's social outcomes. An index does not easily lend itself to policy formation, more specific indicators are needed, and so we explore which indicators can be used to proxy the state of childhood. Specifically, we have used the indices to test for evidence that a focus on child poverty is synonymous with a focus on child well-being cross-nationally. We have found evidence to suggest that governments may better understand the broader lives and needs of children in their populations by looking at indicators such as adolescent fertility rates.
The key message for policy makers is that income poverty and child well-being should not be treated as synonymous. Reducing child poverty is likely to be of importance, probably considerable, for improving child well-being, especially in the immediate term, but it cannot be the sole policy focus. Child well-being is multi-dimensional and policy must address improving child well-being multi-dimensionally. This is recognised in new research efforts both in the UK and abroad.
In the UK a suite of child deprivation questions were included in the Family Resources Survey from 2004/5 and the Department of Work and Pensions announced as part of the Comprehensive Spending Review 2007–2010 how it intended to utilise these questions, alongside income poverty in the monitoring of the strategy to eradicate child poverty by 2020.
The EU has now become much more actively involved in exploring indicators of child well-being. Following the report by Professor Tony Atkinson and colleagues for the Luxembourg Presidency (Marlier et al., Reference Marlier, Atkinson, Cantillon and Nolan2007), which included a proposal that children should be ‘mainstreamed’, the Social Protection Committee Indicators Sub-committee established a task-force on child well-being and child poverty. The task force has undertaken a review of child poverty and social exclusion in the EU and an assessment of policies on child poverty and child well-being. They have made a set of proposals to the Social Protection Committee aimed at better monitoring at the EU level, which includes the proposal for the addition from 2009 of a suite of new questions in SILC mainly focussed on child deprivation.
The OECD is also undertaking a number of child well-being projects with a view to producing a report at the end of 2008. Though this work will not result in the collection of new data, it will draw on research that has investigated government expenditure and in policies that result in a range of child outcomes beyond income poverty measures alone.
Acknowledgements
Our research on child well-being in the OECD and CEE/CIS countries has been supported by UNICEF.