


Thailand is among those Southeast Asian nations(1) that has limited progress in reducing diet-related non-communicable disease(1). The prevalence of obesity in Thailand is higher than the regional average, with 10·3 % for adult women and 7·5 % for adult men(1). Additionally, diabetes continues to affect the Thai population, with a prevalence of just under one in ten adult women and men(1). Diet plays a central role in shaping health outcomes. Therefore, adherence to a recommended diet, which emphasises nutrient-rich foods and limits consumption of critical nutrients such as Na, sugar and fat, can help prevent the non-communicable diseases(2). However, reducing unhealthy diet and promoting healthy eating have become key challenges and policy priorities for the Thai government. Although the government provides advice on healthy eating to the general population, e.g. through the implementation of a food-based dietary guidelines (known as the Thai Nutrition Flag)(3), it remains unclear whether the recommended dietary needs of Thais are being met.
Food environments shape healthy and unhealthy dietary choices, specifically the quantity, quality and diversity of nutrients(4). The literature identifies food environments as a combination of physical, social, economic and political factors that jointly dictate food access and nutrition(4–Reference Drewnowski, Monterrosa and De Pee6). This concept also incorporates the exchange of information that shapes how consumers acquire and consume food. Social environments such as shared in-home meals can positively influence diet quality, as well as other health and psychosocial outcomes(Reference Glanz, Metcalfe and Folta7). Community involvement is a key driver in improving sustainable healthy diets(Reference Principato, Pice and Pezzi8). Activities such as home food production and community gardening also contribute to improving diet, in particular the intake of higher fruit and vegetable(Reference Hume, Grieger and Kalamkarian9). Individuals exposed to social marketing campaigns aimed at promoting adequate fruit and vegetable intake were linked to an increase in adequate fruit and vegetable consumption(Reference Phulkerd, Thapsuwan and Chamratrithirong10). Conversely, commercial marketing of unhealthy foods high in sugar, salt and fat increases preference, purchase and consumption, particularly among children(Reference Boyland, Muc and Coates11).
Food availability and accessibility in food outlets are also contributors to healthy and unhealthy dietary practices. While the presence of more healthy food outlets such as greengrocers is linked to healthier eating patterns, particularly fruit/vegetable consumption, a higher density of modern food outlets such as convenience stores, café, chain outlets near households is related to an increase in unhealthy diet(Reference Bivoltsis, Trapp and Knuiman12). In addition, evidence indicates that a substantial proportions of food products sold in retail outlets are unhealthy. Regionally, the share of unhealthy foods sales from chain outlets has increased over time, reaching more than 80 % in North America and 60 % in the East Asia pacific region(Reference Scapin, Romaniuk and Feeley13). Positive correlations have been also observed between the density of chain outlets, the sales of unhealthy foods and obesity(Reference Scapin, Romaniuk and Feeley13).
With growing interest in promoting a healthy diet, policymakers and public health professionals are exploring effective strategies to encourage recommended diets, characterised by consuming a wide variety of foods in appropriate proportions, to help population achieve and maintain a healthy weight(14–Reference Westbury, Ghosh and Jones16). While a substantial body of research highlights the potential impact of a supportive food environment on healthier diet, evidence from low- and middle-income countries remains limited(Reference Choudhury, Bi and Medina-Lara15,Reference Westbury, Ghosh and Jones16) . In particular, no studies have examined the relationship between food environment and a recommended diet in the Thai population. Therefore, this study was conceived to assess the overall diet quality of the Thai adults using a modified Thailand Healthy Eating Index as a measure of recommended diets and to investigate the associations between diet quality and food environment characteristics, particularly access to modern trade retailers, traditional retailers and fresh/wet market, as well as other socio-demographic and environmental factors.
Methods
Study design and population
This cross-sectional study utilised data from a national, population-based survey conducted in Thailand between August 2022 and November 2023, employing a structured questionnaire administrated through face-to-face interviews(Reference Sangkla, Phulkerd and Sujaritpong17).
The survey targeted Thai individuals age 0 years or older, using a multi-stage cluster sampling method, and was implemented by the National Statistical Office under the Ministry of Digital Economy and Society. The scope of the survey encompassed the Thai resident population across four geographic regions (Central, North, Northeast and South), as well as Bangkok, and included both urban and rural communities.
The sampling process outside of Bangkok comprised four stages: Selecting strata or geographical units (provinces); selection of districts, selection of sub-district units (enumeration areas or EA) and individual households within the selected EA. For Bangkok, the NSO listed all households within the selected areas and created location maps. Those maps served as the sampling frame for the final household selection. The research team used these maps to locate the chosen households.
Before data collection commenced, formal authorisation was obtained from the leadership of each district and sub-district. Following this approval, village heads and local coordinators facilitated the research team’s access to the selected households.
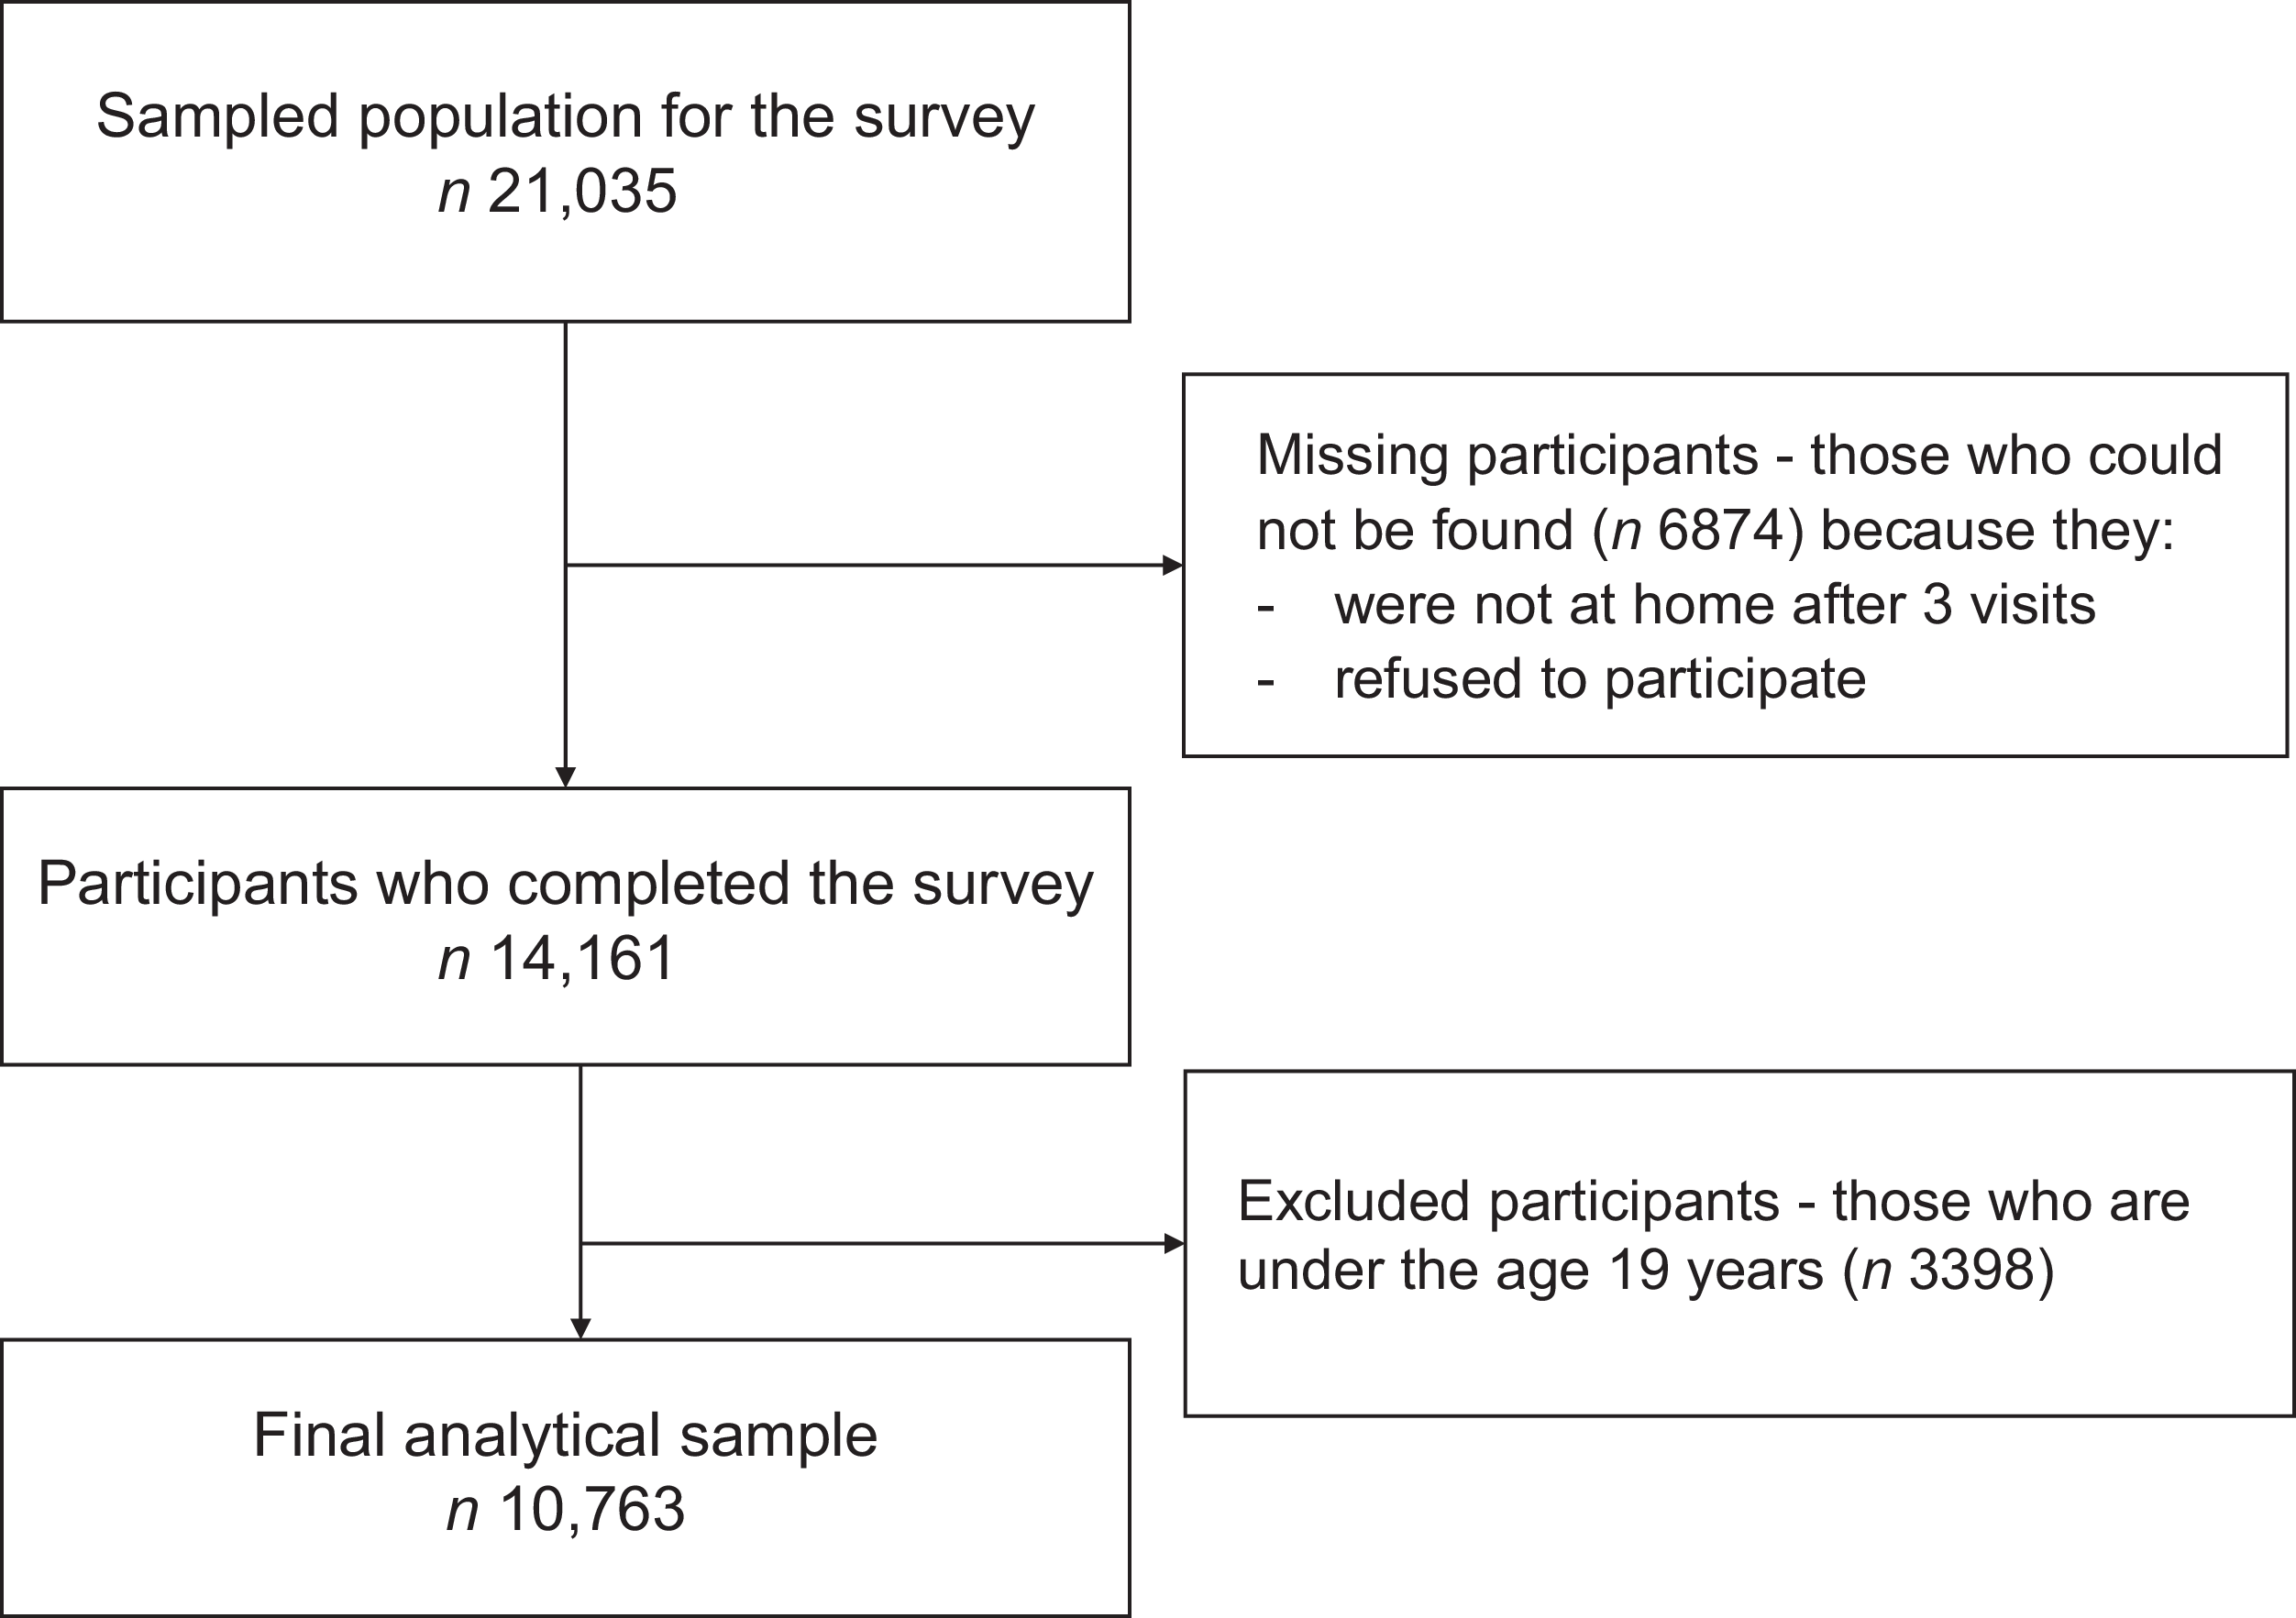
The study excluded 3398 persons under age 19 years in order to conform with the Thailand Nutrition Flag program which targets persons age 19 years or older. A total of 10 763 participants were included in the statistical analyses for this study (Figure 1).
Study sample.

Data collection
To support the data collection process, local residents (e.g. village leaders, health volunteers, etc.) helped introduce the field staff to the selected households. All participants provided written informed consent before taking part in the study. Data were collected from all eligible household members who were present during the visit to reduce selection bias. The staff made repeated visits to contact sampled participants, and if a household member remained unreachable after three attempts, they were excluded without being replaced.
The staff collected data using Qualtrics offline survey app. Participants’ responses were entered into tablet computers, and later synchronised with the Qualtrics when there was access to the internet. The methods and results of the study are reported as per the Strengthening the Reporting of Observational Studies in Epidemiology guidelines (Appendix 1).
Study variables
The questionnaire gathered data on participants’ socio-demographic and economic characteristics, regular diet and food environment.
Recommended diet
This study used a recommended diet as the outcome variable to assess overall diet intake in the Thai population. A Thailand Healthy Eating Index (THEI) was developed as a tool to measure consumption of a recommended diet, based on the original THEI created by Taechangam et al.(Reference Taechangam, Pinitchun and Pachotikarn18). The 2008 version of THEI was modified to align with the revised Thailand Nutrition Flag program, introduced in 2021(19), while also taking into account the prevailing health and sociocultural context at the time, as well as age-specific dietary behaviours within the Thai population. The modified THEI (MTHEI) score is derived from the revised Nutrition Flag, which provides age-specific dietary recommendations for major food groups and distinguishes between working-age adults (19–59 years) and older adults (≥60 years). The content validity of the MTHEI was verified by experts in public health nutrition, clinical nutrition, demography and food and nutrition policy.
The MTHEI consists of two domains and fifteen components. The first domain (‘healthy’) includes foods for which higher intake is encouraged, comprising five components based on the major food groups recommended by the Thailand Nutrition Flag: rice and starchy foods, vegetables, fruits, meat and milk. The second domain (‘unhealthy’) includes foods that should be limited or avoided, comprising ten components: sugar-sweetened beverages, sweetened desserts, foods/beverages with added sugar, fried foods, foods made with coconut milk or butter, fatty meats, instant food, salty snacks, fermented or pickled food and food with added salty condiments.
The maximum potential score for the fifteen components combined is 100. The maximum potential score for each domain of the index is 50. Each component has a maximum potential score of four and a minimum possible score of zero. The study assigned equal weights to all components within the same domain, based on expert opinion. A score for the modified index over 70 implies ‘good’ diet and adherence to the recommended diet. A score between 51 and 70 implies a diet that ‘needs improvement.’ A score less than 51 implies a ‘poor’ diet. A detailed description of the modified index is presented in Appendix 2.
As the primary outcome, the overall MTHEI score was used as a summary measure of overall diet quality. Domain-specific MTHEI scores were calculated and descriptively reported to proceed additional context on dietary patterns but were not used in the main analyses.
Data on participant food consumption were self-reported using a semi-quantitative food frequency questionnaire (see Appendix 3). Consumption data were categorised by the frequency (number of days per week) a participant consumed specific food components and the quantity (number of servings) consumed per day. Frequency and quantity were multiplied to estimate the total amount consumed over a typical week. The result was then divided by seven to calculate the average daily intake.
Socio-demographic and economic characteristics
Sex was coded as ‘male’ and ‘female.’ Age group (years) were classified into: ‘19–29,’ ‘30–39,’ ‘40–49,’ ‘50–59’ and ‘60 or over.’ Marital status was coded as ‘single,’ ‘married’ and ‘widowed/divorced/separated.’ Place of residence was coded as ‘urban’ and ‘rural.’ Educational attainment was coded as completing ‘lower than primary school,’ ‘primary school,’ ‘secondary school’ and ‘Bachelor’s degree or higher.’ Income (baht per month) was coded as ‘no income,’ ‘less than 5000,’ ‘5000–11 999’ and ‘12 000 or above.’
Food environment
In this study, information on social and physical aspects of the food environment served as the independent variables.
Social domain:
Family support: Participants were asked whether their family encouraged them to consume healthier foods. Responses were recorded as either ‘yes’ or ‘no.’
Community support: Participants were also asked if their local community supported their effort to eat more healthily. Responses were recorded as ‘yes’ or ‘no.’
Information and campaigns: Participants were asked about their awareness of government or community campaigns promoting safe and healthy food consumption. They were also asked whether they had seen or heard the Thai Health Promotion Foundation (ThaiHealth) campaign with the slogan ‘Cut back on sugar, fat, and salt, keep NCD away.’ During the study period, the ThaiHealth implemented a national campaign encouraging reduced consumption of Na, sugar and saturated fats to prevent non-communicable diseases. This campaign is highlighted as an example of a major population-wide initiatives that may have contributed to increased public awareness of healthy eating behaviours in Thailand(20,21) . Visibility of these campaigns was rated on a scale from none, very low, low, moderate, high and very high. For analysis purposes, these responses were grouped into three levels: ‘none,’ ‘some’ (combining very low, low and moderate) and ‘high’ (combining high and very high).
Physical domain:
Having a home garden: The study measured this attribute based on participant response to whether they grow fruits and vegetables (FV) at home for personal consumption. Participants who grew FV at home were coded as ‘yes (having a home garden)’ while those who did not were coded as ‘no (not having a home garden).’
Perceived nearby access to food retailers: Participants were asked to identify the types of food retail outlets near their residence or within the home community that offer fresh produce. They selected from predefined options, including grocery store, modern trade convenience store, supermarket/department store, fresh or wet market, mobile food truck/street vendor/stall/cart and farm-to-table provider. Participant could report access to more than one retail outlet type. Responses were therefore combined into a single categorical variable representing distinct patterns of perceived nearby food retail access. These responses were then grouped into the eight categories below. Each category was further coded as follows: ‘yes’ or ‘no.’ The resulting categories were mutually exclusive and reflected the combinations of retail outlets type available to participants.
-
• Traditional retailer (including grocery store and mobile food vendor)
-
• Modern trade retailer (including convenience store and supermarket/department store)
-
• Traditional retailer and modern trade retailer
-
• Fresh/wet market
-
• Fresh/wet market and traditional retailer
-
• Fresh/wet market and modern trade retailer
-
• Fresh/wet market, traditional retailer and modern trade retailer
-
• Farm-to-table provider
In this study, traditional retailers were defined as independent, small-scale and non-corporatised outlets that are deeply integrated into the local community. In contrast, modern retailers were characterised as organised, corporatised and standardised outlets that often utilise global supply chains. Supermarkets and convenience stores, for example, were classified as modern retail, as the majority in Thailand are modern, chain-operated establishments.
Statistical analysis
Descriptive statistics were used to summarise the MTHEI scores by age group. Both mean values and percentages were calculated. To compare mean MTHEI scores across categories of independent variables, t-tests and one-way ANOVA were employed as appropriate. Subsequently, multiple regression analysis was conducted to examine the associations between MTHEI score and the socio-demographic and economic factors as well as food environment, with covariates added simultaneously to adjust for potential confounding effects. In the regression analyses, the eight retail categories were entered as a categorical exposure variable, with one category serving as the reference group. The outcome variable was the MTHEI score, treated as a continuous variable with a potential range from 0 to 100.
Independent variables included in the regression model were sex, age, marital status, place of residence, income, educational attainment and food environment. A total of twenty-nine cases out of 10 763 (0·3 %) were excluded from the analysis due to incomplete or missing data. Since the proportion of missing data was less than 5 %, this omission was considered negligible and unlikely to bias the results or affect statistical inference(Reference Bennett22,Reference Schafer and Graham23) . Statistical significance was determined using a two-tailed p-value threshold of ≤0·05. All multivariate analyses were performed using SPSS Software, Version 18.
Results
The modified Thailand Healthy Eating Index score
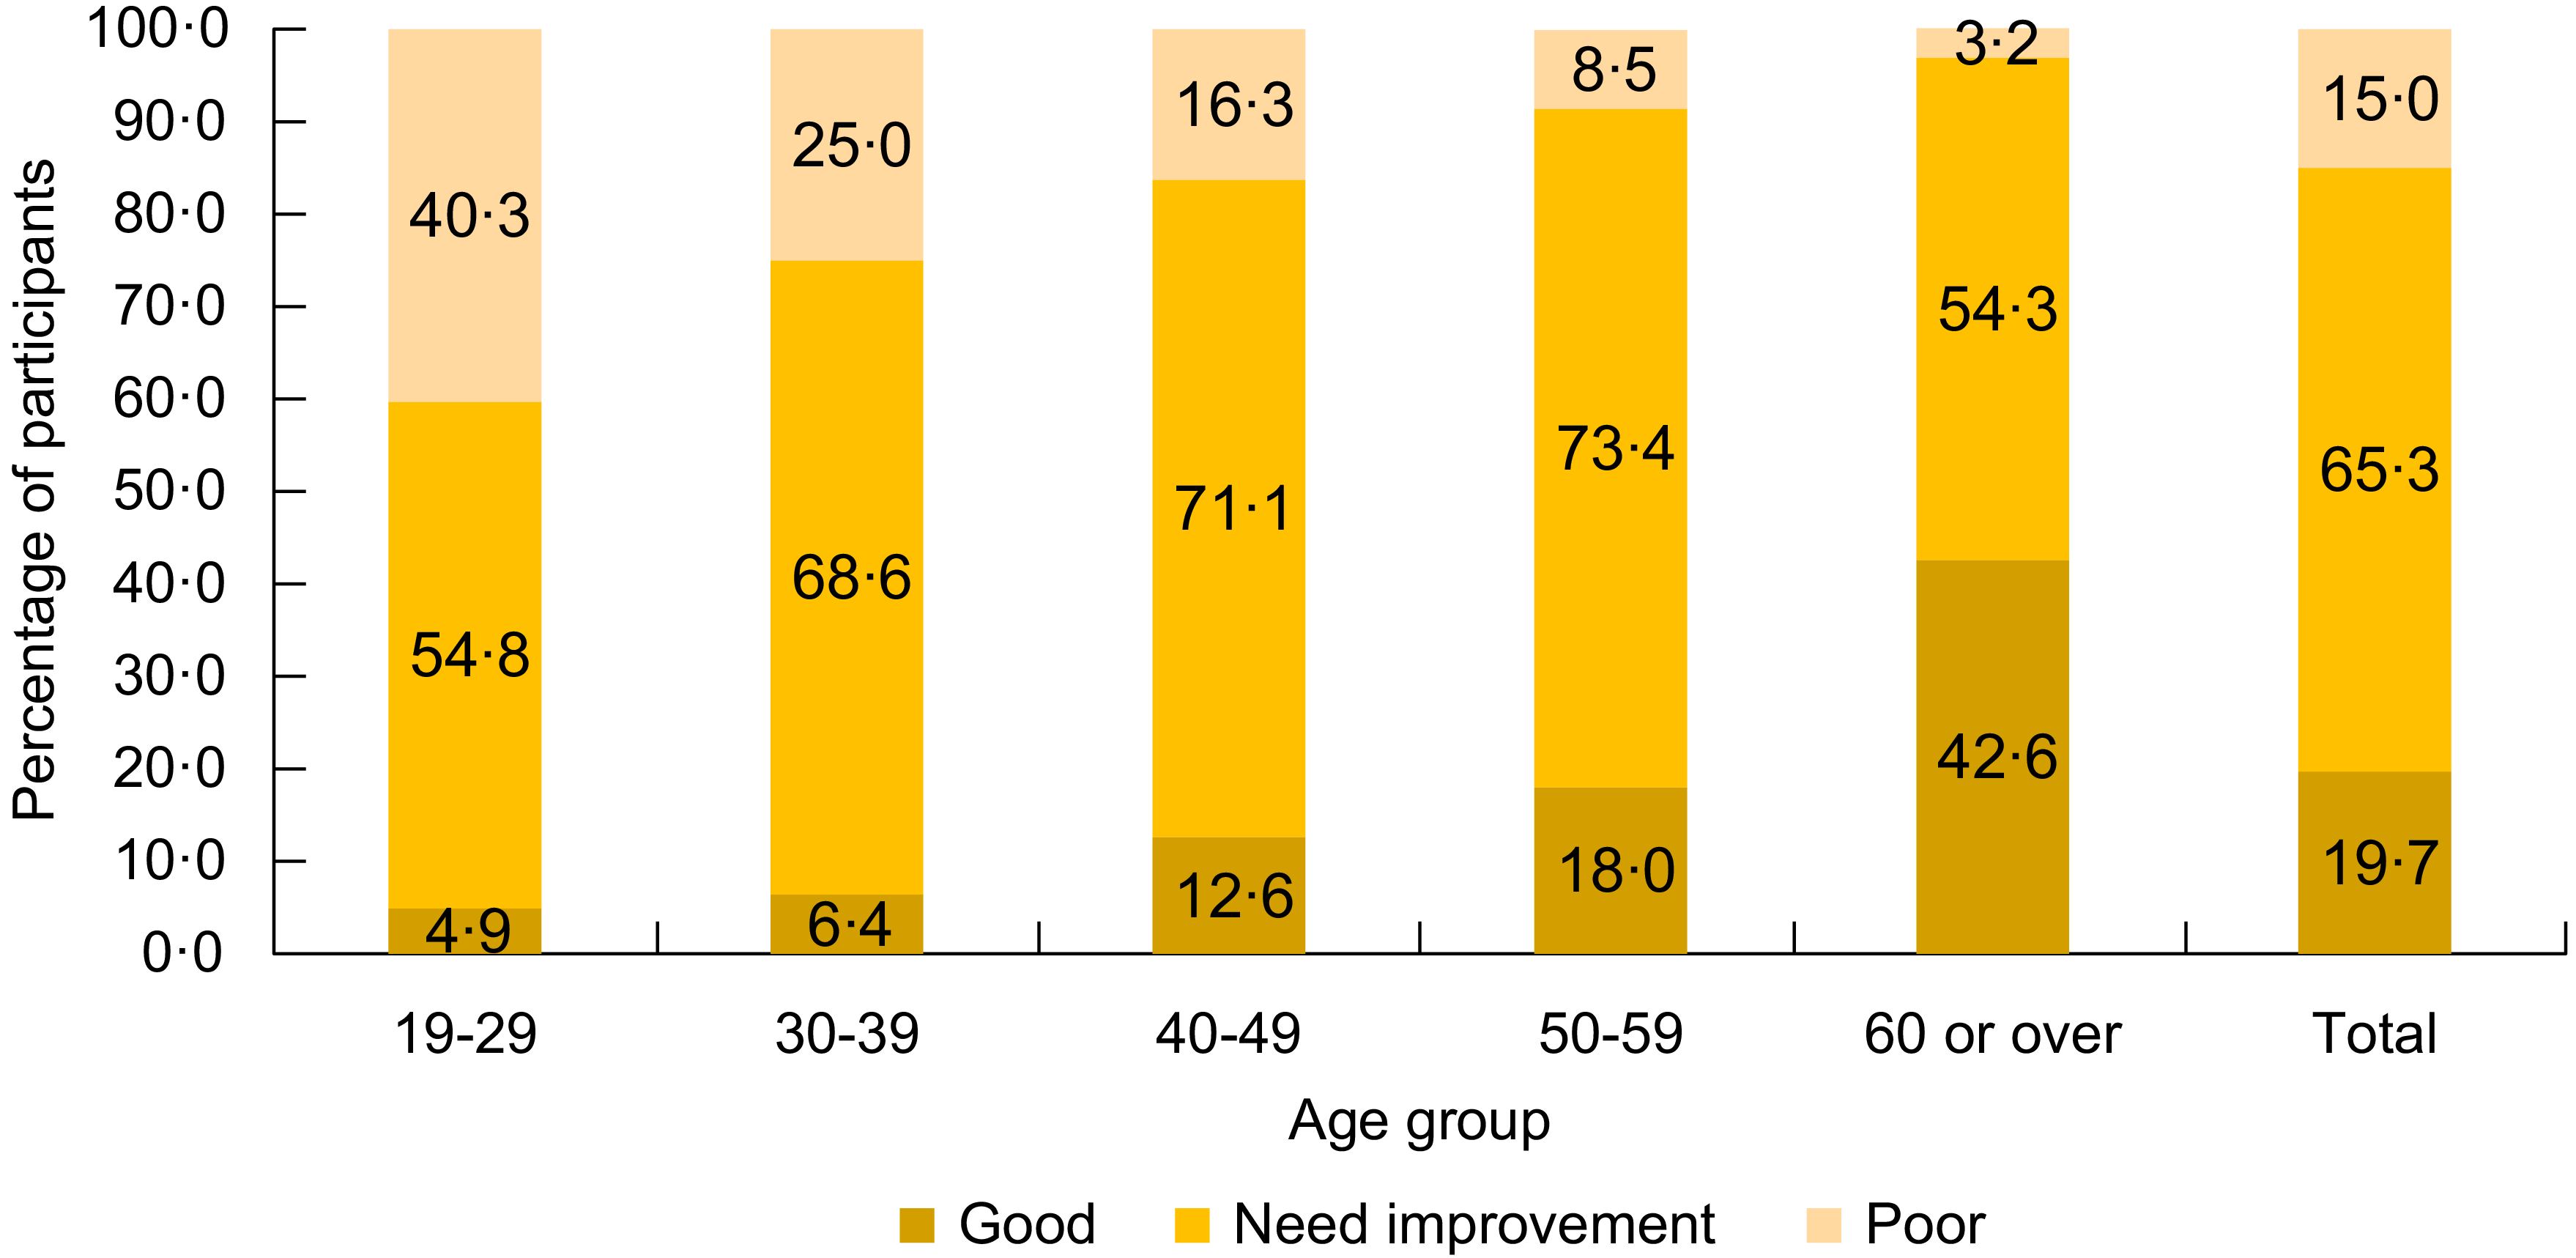
The average MTHEI score among this national sample of Thai adults was 61·7. Only one in five participants met the criteria for a recommended diet (Figure 2). The majority (65·3 %) required improvement in their dietary habits, while 15 % had a ‘poor’ diet. Across age groups, the younger the participant, the higher the percentage with a poor diet. The older age group had the highest percentage (42·6 %) of participants with a good diet compared with the other age groups.
Percentage of the sample by MTHEI category (N 10 763).

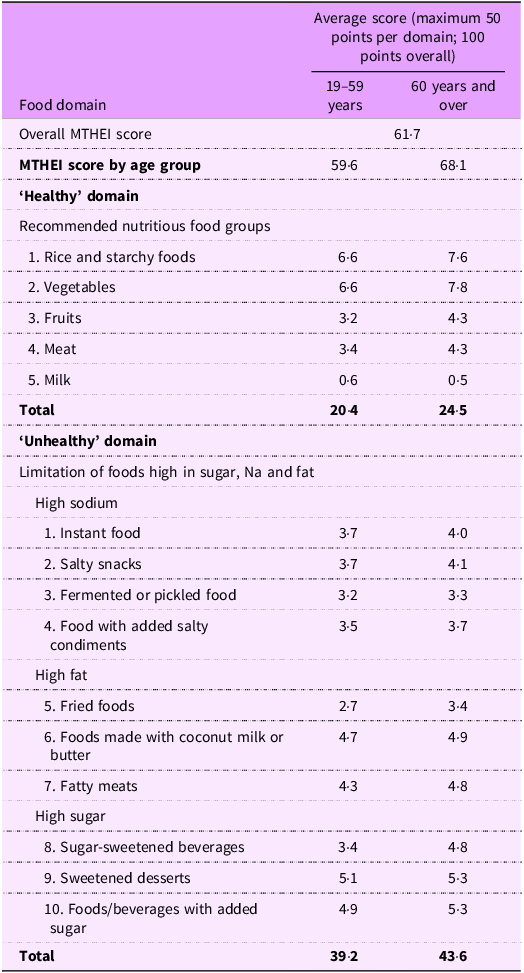
Although subsequent analyses used the overall MTHEI score, Table 1 also presents average MTHEI scores by domain to provide insight into domain-specific contributions to overall diet quality. In the ‘Healthy’ domain average scores were 20·4 among working adults and 24·5 among older persons, with ‘Vegetables’ and ‘Rice and Starchy Foods’ categories contributing the largest proportion of scores in both groups. Average scores for the ‘Unhealthy’ domain were 39·2 and 43·6 among working adults and older persons, respectively. ‘Instant Food’ and ‘Salty Snacks’ were the leading contributors within the high-Na category for both age groups. Additionally, ‘Foods Made with Coconut Milk or Butter’ predominated in the high-fat category, while ‘Sweetened Desserts’ and ‘Foods/Beverages with Added Sugar’ were the most consumed items in the high-sugar category.
Average MTHEI scores by food domains and components

Table 1. Long description
A table comparing average MTHEI scores by food domains and components for two age groups. The table has 10 rows and 4 columns. The columns are labeled ‘Food domain’, ‘Average score (maximum 50 points per domain; 100 points overall)’, ‘19-59 years’, and ‘60 years and over’. The rows are grouped into ‘Overall MTHEI score’, ‘MTHEI score by age group’, ‘Healthy domain’, and ‘Unhealthy domain’. Under ‘Healthy domain’, the categories are ‘Recommended nutritious food groups’, ‘Rice and starchy foods’, ‘Vegetables’, ‘Fruits’, ‘Meat’, and ‘Milk’. Under ‘Unhealthy domain’, the categories are ‘Limitation of foods high in sugar, Na and fat’, ‘High sodium’, ‘High fat’, and ‘High sugar’. Each category has corresponding scores for the two age groups.
MTHEI, modified Thailand Healthy Eating Index.
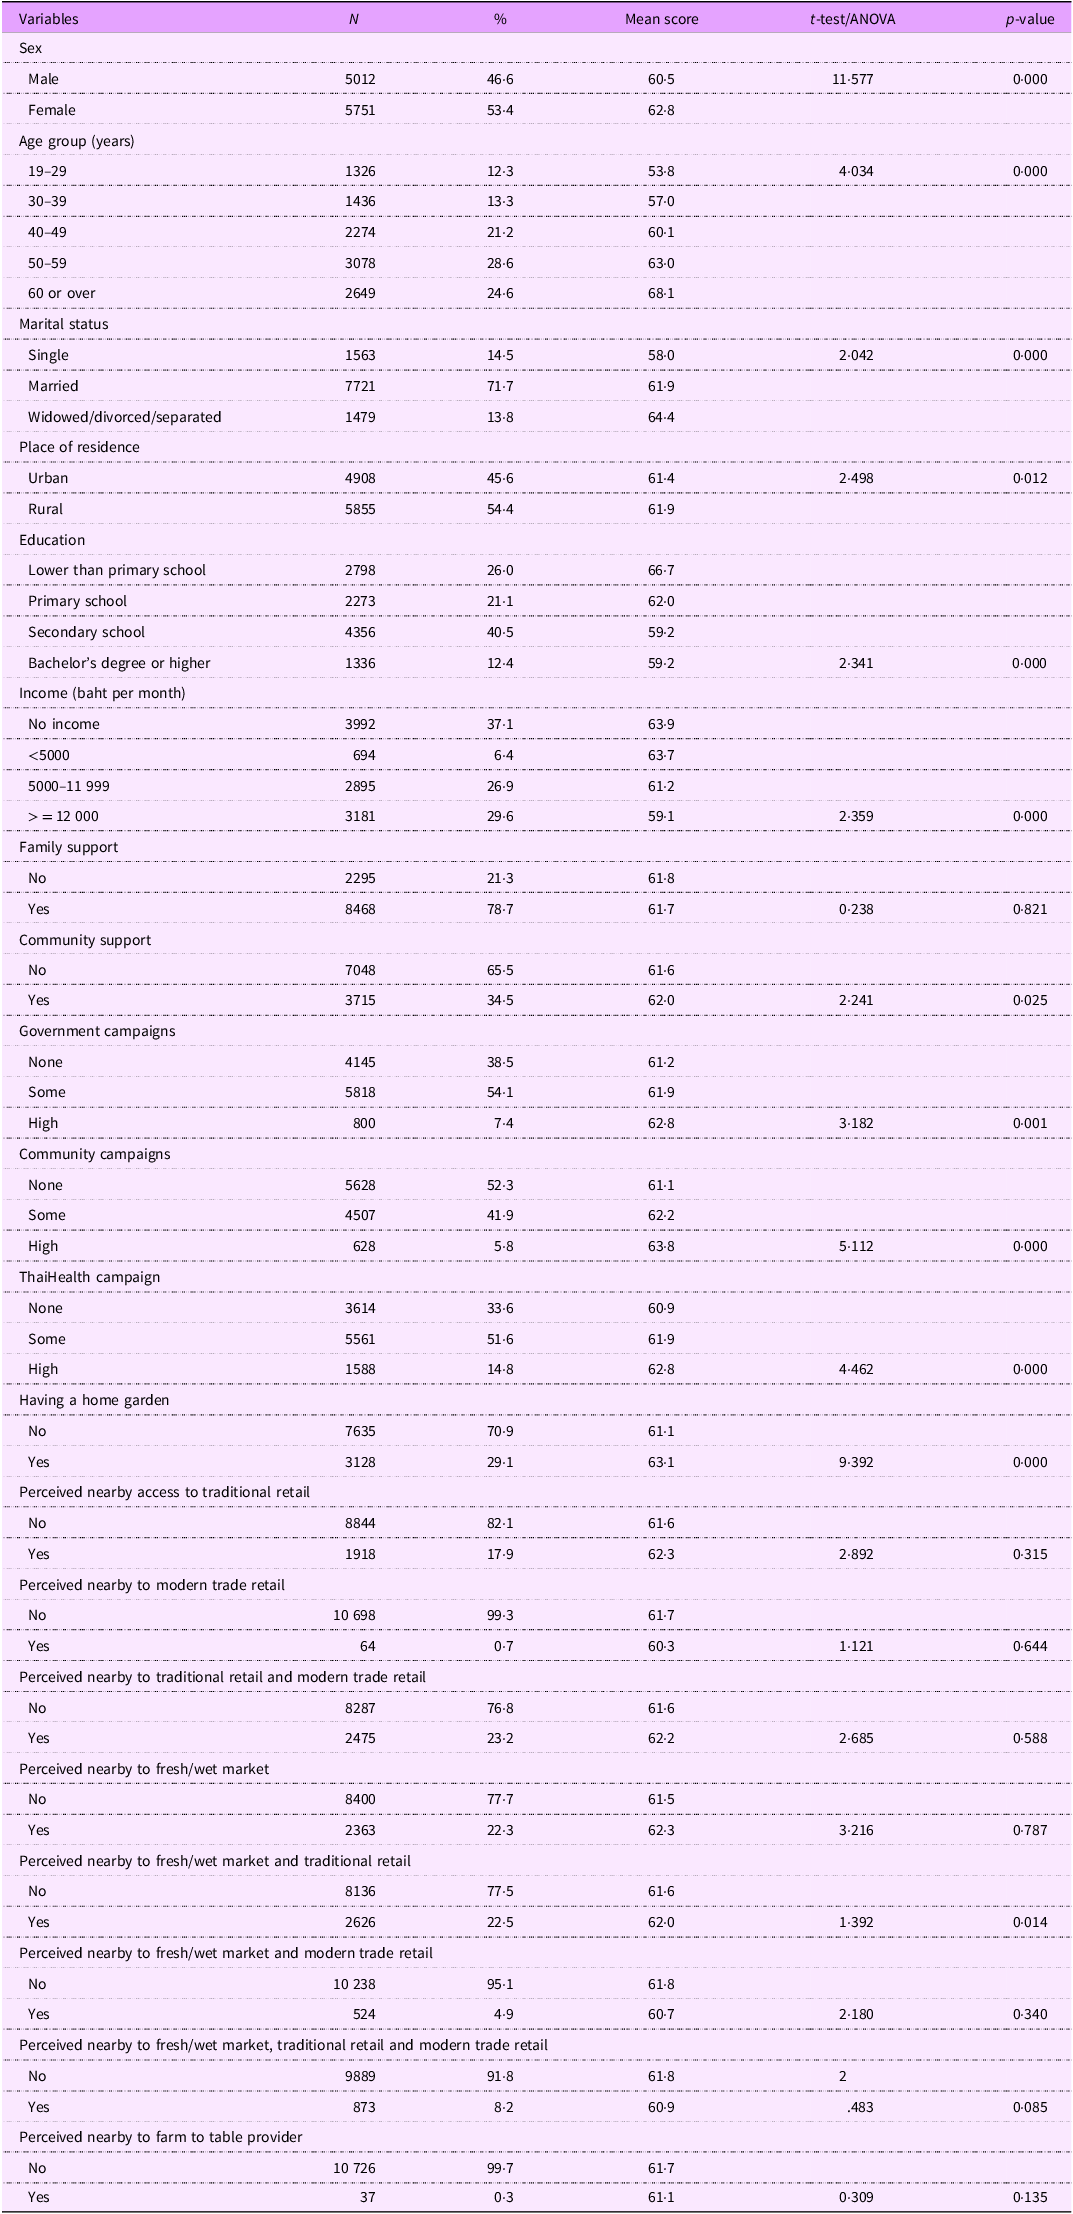
Table 2 presents the mean MTHEI scores of participants by socio-demographic and economic characteristics and food environment. Higher scores were observed among females (62·8), older individuals (68·1), those who were widowed/divorced/separated (64·4), residents of a rural area (61·9), individuals with less than primary education (66·7) and those without income (63·9), compared with others within each respective category.
Characteristics of the participants and mean MTHEI score (N 10 763)

Table 2. Long description
A table with 25 rows and 7 columns comparing socio-demographic characteristics and mean MTHEI scores of participants. Column headers are Variables, N, Percent, Mean score, F-test/ANOVA, and p-value. Row labels include Sex, Age group, Marital status, Place of residence, Education, Income, Family support, Community support, Government campaigns, Community campaigns, ThaiHealth campaign, Having a home garden, Perceived nearby access to traditional retail, Perceived nearby access to modern trade retail, Perceived nearby to traditional retail and modern trade retail, Perceived nearby to fresh/wet market, Perceived nearby to fresh/wet market and traditional retail, Perceived nearby to fresh/wet market and modern trade retail, Perceived nearby to fresh/wet market, traditional retail and modern trade retail, Perceived nearby to farm to table provider. Each row provides specific data points for each variable.
MTHEI, modified Thailand Healthy Eating Index.
Participants who reported not receiving family support (61·8), receiving community support (62·0), having a high perceived level of government (62·8) or community (63·8) campaigns, seeing the ThaiHealth campaign (62·8) and having a home garden (63·1) had the highest MTHEI scores within their respective categories. Participants with perceived nearby access to modern trade retail had lower scores than those without such access. Moreover, whenever modern trade is present, the MTHEI score is observed to be lower.
Socio-demographic and economic factors (particularly sex, age, marital status, education and income) were associated with MTHEI score (p ≤ 0·001). Most variables related to the food environment were significantly associated with MTHEI, with the exception of family support and access to a fresh or wet market.
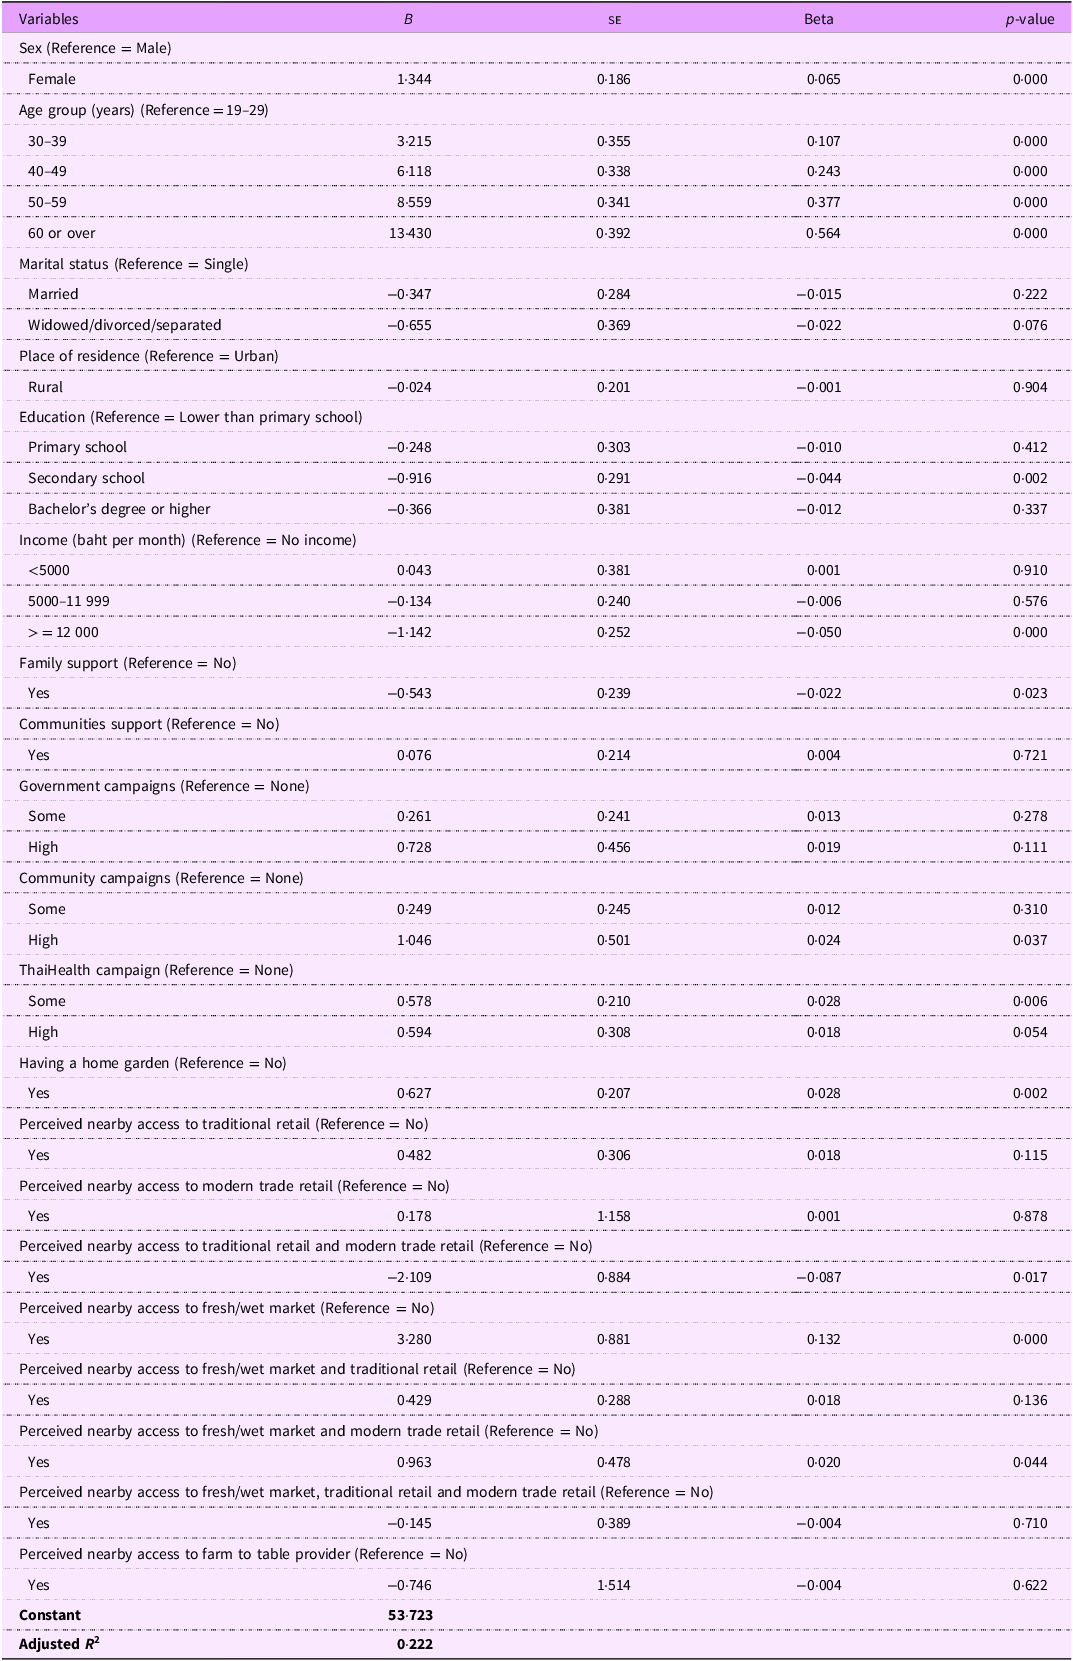
Regression of modified Thailand Healthy Eating Index on socio-demographic and economic factors and food environment
Results indicate that the MTHEI score was higher among people who are female and at age 30 years or over (Table 3). Female participants had 1·3 MTHEI scores (B = 1·344; p < 0·001) higher than male participants. People age 60 years or over had 13·4 scores (B = 13·430; p < 0·001) higher than people age 19–29 years. People who had secondary school education and high income had 0·9 points (B = –0·916; p0·002) and 1·1 scores (B = –1·132; p < 0·001) lower than people who had education lower than primary school level and no income, respectively.
Multiple regression of MTHEI by socio-demographic and economic characteristics and food environment (N 10 734)

Table 3. Long description
The table presents the results of a multiple regression analysis of MTHEI scores based on various socio-demographic, economic characteristics, and food environment factors. It includes 25 rows and 5 columns. The columns are labeled as Variables, B, S E, Beta, and p-value. The table lists different variables such as sex, age group, marital status, place of residence, education, income, family support, communities support, government campaigns, community campaigns, ThaiHealth campaign, having a home garden, and perceived nearby access to different types of retail and markets. Each row provides the regression coefficients (B), standard errors (S E), standardized coefficients (Beta), and p-values for each variable. Notable trends include higher MTHEI scores for females and older age groups, and lower scores for those with secondary school education and high income compared to those with lower than primary school education and no income.
MTHEI, modified Thailand Healthy Eating Index.
B, Unstandardised coefficient; beta, standardised coefficient.
Statistically significant associations of family support, community campaigns and ThaiHealth campaign were found with MTHEI. People who reported receiving family support had 0·5 MTHEI scores (B = –0·543; p0·023) lower than people who did not receive family support. People who had a high perceived level of community campaigns or had seen or heard about ThaiHealth campaign had 1·0 score (B = 1·046; p0·037) and 0·6 scores (B = 0·594; p0·054) higher than those who were not exposed to community or ThaiHealth campaigns.
People who had a home gardening had a 0·6-point higher MTHEI score (B = 0·627; p0·002) higher than those who did not. People who had perceived nearby access to traditional retail and modern trade retail had 2·1 scores (B = –2·109; p0·017) lower than people who did not have these retails near their residence. People with perceived nearby access to fresh/wet market had 3·3 scores higher (B = 3·280; p < 0·001), whereas those with perceived nearby access to both fresh/wet market and modern trade retail had 1·0 scores higher (B = 0·963; p0·044). These associations reflect that retail environments that included modern trade retailers tended to be associated with the lower MTHEI scores compared with the reference group.
Discussion
The food environment can play a crucial role in influencing the recommended diet of the population through environmental factors such as food accessibility, availability, affordability and acceptability(Reference Sawyer, van Lenthe and Kamphuis24). This study is the first of its kind in Thailand and Southeast Asia to investigate the relationship between food environment and recommended diet at the population level. The study found that only one in five Thai adults maintained a recommended diet, while the majority need dietary improvement. The study identified several influencing factors, particularly aspects of the social and retail food environments, along with certain socio-demographic characteristics that align with previous research(Reference Mattioni, Loconto and Brunori25–Reference Estradé, Trude and Pardilla28).
Compared with global averages of similar indices of healthy eating in adults (e.g. the 2018 Alternative Healthy Eating Index – AHEI), the mean MTHEI score (61·7) in this study was higher than the AHEI mean (40·8)(Reference Miller, Webb and Cudhea29). Similar to the AHEI scores, the MTHEI mean scores were generally higher in women than men and did not vary much between urban and rural residents. Compared with countries in Asia, the Thai MTHEI mean score was higher than the mean AHEI score reported in Vietnam, Iran, Indonesia and India, which ranged from 48·2 to 54·5(Reference Miller, Webb and Cudhea29). Furthermore, while dietary pattern scores increased in Southeast and East Asia between 1990 and 2018, with a 2·7-point rise (from 1·7 to 3·8), no significant change was observed in South Asia (from –0·9 to 1·1). However, differences in measurements and time frames should be considered when making cross-country comparisons.
Female participants had significantly higher MTHEI scores than their male counterparts. This trend may reflect prevailing societal norms. Women often demonstrate greater health awareness and body shape concern and experience more diet-related anxiety than men(Reference Bärebring, Palmqvist and Winkvist30,Reference Wardle, Haase and Steptoe31) . Prior research has shown that women are more likely than men to prioritise healthy eating and hold more negative views about the adverse effects of sugar, gluten, dairy, red meat, white flour, alcohol and food additives on a person’s health(Reference Bärebring, Palmqvist and Winkvist30). Furthermore, women are more inclined to avoid consuming foodstuffs such as gluten, red meat, white flour and food additives and are more likely to report health-related anxiety tied to food choices. This study also found that MTHEI score was significantly higher among individuals age 60 years or older. This may be attributed to the effect of ageing and the presence of chronic health conditions, which often heighten awareness of diet and health(Reference Caso and Vecchio32). Accordingly, these findings should galvanise greater attention to nutrient intake and overall dietary balance among the younger age groups.
People with only secondary school education and those in a higher-income group were among the most vulnerable to poor dietary balance. People with lower educational attainment often consume diets richer in carbohydrates, sweets and red meat, while eating fewer fibre-rich food, fruits, vegetables and fish compared with those with higher education(Reference Fard, Morales and Mejova33). This differential may be due to limited food literacy, since that attribute often requires more advanced knowledge, pro-health attitude, food skill, the ability to make healthy food choices and ability to manage dietary quality(Reference McManus and Pendergast34). Conversely, higher income was linked to poorer diet quality. A person with greater income should have a greater array of food options, but that does not necessarily lead to better food choices(Reference Carrillo-Alvarez, Rifà-Ros and Salinas-Roca35). In the Thai context, high-income groups may be experiencing the effects of a ‘nutrition transition’. This transition involves a move away from traditional Thai staples and side dishes (which are often lower in energy density) towards a diet that is richer in animal products, saturated oils, sugars and processed foods(Reference Beckmann, Strassner and Kwanbunjan36).
Participants who were exposed to community campaigns and the ThaiHealth campaign tended to have better diet quality compared with those who were not. There is a substantial body of evidence that supports the effectiveness of community-based strategies, such as health promotion campaigns focused on healthy eating(Reference Marjanovic, Kent and Morrison37,Reference Van Wechem, Van Assema and Brug38) . The community-based approaches are effective because they are tailored to the local context and actively engage community members, which enhances reach and overall impact(Reference O’Mara-Eves, Brunton and Oliver39). Indeed, the ThaiHealth campaigns were found to be effective regardless of the level of target population exposure. Most ThaiHealth initiatives are social media campaigns that incorporate storytelling, tailored messaging and data-driven optimization to better engage the target audience and promote behaviour change(Reference Hsu, Rouf and Allman-Farinelli40). Consistent with the findings of previous studies, individuals exposed to the ThaiHealth FV promotion campaign were significantly more likely to increase their intake of those foodstuffs and meet the recommended daily amount (at least 400 grams combined) compared with those who were not exposed to the campaign(Reference Phulkerd, Thapsuwan and Chamratrithirong10). In contrast, while community-based campaigns also contributed to increased FV consumption among the same population, they did not lead to intake levels that met the recommended threshold.
Although it is not statistically significant, the association is in the positive direction that is, higher community support is associated with higher MTHEI. Multiple studies showed that across diverse populations, stronger community support is associated with higher HEI or similar diet-quality score. A community-supported agriculture randomised control trial showed that providing community-based access to subsidised produce improved HEI-2010 by 4·3 points and reduced food insecurity, indicating a causal pathway from community food support to better diet quality(Reference Berkowitz, O’Neill and Sayer41). Social capital also improved diet quality (Chinese HEI), largely mediated by social support and nutrition knowledge, in disadvantaged minority communities in Yunnan(Reference Zhang, Huangfu and Wan42). Therefore, engaging community partnerships is critical to advancing healthy eating, particularly supporting access to healthier foods.
Family support was found to be linked with poor dietary balance. Although previous studies have found a link between positive family support and healthy eating habits, the links are mostly observed in samples of children(Reference Rotman, Fowler and Ray43,Reference Runtulalo, Mulyono and Rekawati44) . Among adults, however, convenience and quick meals may reduce the focus on the nutritional value of both the food provided by the family and their own choices(Reference Peltner and Thiele45). Contributing factors such as long working hours(Reference Min, Lee and Kang46–Reference Sam, Craig and Horgan48), limited time for cooking(Reference Monsivais, Aggarwal and Drewnowski49) and the widespread availability of ultra-processed foods(Reference Baker, Machado and Santos50) may explain this trend. This phenomenon may be further explained by the availability of food retail outlets, which can affect food accessibility, affordability, convenience and desirability(Reference Turner, Aggarwal and Walls5).
Access to modern trade retail affects the recommended diet, particularly when combined with traditional or local retail, which is significantly associated with lower MTHEI scores. This may reflect the influence of commercial marketing in modern trade retail and the widespread availability of unhealthy foods in this setting, which is likely to increase over time(Reference Scapin, Romaniuk and Feeley13). Global food retail environment is becoming more chain- and ultra-processed-dominated, increasingly digital, and are positively associated with rising obesity, particularly where unhealthy outlets and products are most accessible and aggressively marketed(Reference Phulkerd, Thapsuwan and Chamratrithirong10).
Food availability and accessibility are shaped by commercial marketing strategies, particularly the 4Ps (Product, Price, Place and Promotion)(Reference McCarthy51). ‘Place’ strategies, covering distribution channels, retail locations and accessibility, facilitate exposure to foods sold in the retails, especially among youth, which is linked to greater preference for and consumption of these products(Reference Ilieva, Gottlieb and Christian52,Reference Frost, Te Morenga and Mackay53) . Evidence from Thailand indicates that over the decade, there were substantial increases in the retail value of certain ultra-processed foods in convenience stores, particularly ready-to-eat meals (+45·6 %), ice cream/frozen desserts (+24·6 %) and dairy-based beverages (+16·2 %)(Reference Phulkerd, Thongcharoenchupong and Dickie54). Confectionery/sweet spreads (+0·6 %), ice cream/frozen desserts (+0·1 %) and concentrates (+3·5 %) experienced modest sales growth in small grocers. Proximity to retail outlets is crucial, as residents depends on nearby shops for daily food, which further complicates efforts to improve a recommended diet across the population.
The availability of home gardens and access to fresh/wet markets were found to be associated with a healthier diet. This is not surprising, as multiple studies have confirmed a positive relationship between home gardening and improved diet, as well as enhanced food security and overall well-being(Reference Ogutu, Mockshell and Garrett55–Reference Panțiru, Ronaldson and Sima57). In Southeast Asia, fresh/wet markets are critical places that facilitate access to diverse fresh foods particularly FV, often more affordable and accessible than modern retailers(Reference Hofman and Trevenen-Jones58). Evidence suggests that proximity to these markets is linked to healthy diets, as these venues provide the variety and affordability of FV necessary to support healthier eating patterns(Reference Bivoltsis, Trapp and Knuiman12).
This study has some limitations. First, the design of the national survey was cross-sectional and, therefore, the findings cannot be used as evidence of a causal relationship between food environment and healthy diet. This short-coming should be addressed by funding a longitudinal approach to diet and determinants. Second, the study sample was limited to people age 19 years or older, and therefore, was not generalisable to the wider population. Third, the analysis of food consumption is specific to the Thai context and used the MTHEI, which is based on the Thailand Food-Based Dietary Guidelines (or the Thailand Nutrition Flag). Therefore, the findings may not be applicable to countries which use different Food-Based Dietary Guidelines frameworks. Fourth, the MTHEI does not incorporate aspects of food variety. This may impact the application or interpretation of the findings. Fifth, as the analysis of this study was based on combinations of retail outlet types, the findings reflect the overall retail environment rather than the independent influence of traditional retailers or modern trade retailers. Moreover, this study assessed perceived rather than objective measures of the food environment. In addition, individuals may access food outlets beyond their residential neighbourhoods (e.g. workplace), which may not be fully captured in the analysis. This limitation is further compounded by the increasing use of online food and meal delivery services, which expand access beyond physical proximity. Finally, the study covered only certain aspects of the food environment, and other potential factors (e.g. prices, vendor/product attributes, marketing, regulations, affordability and convenience)(Reference Turner, Aggarwal and Walls5) were not examined. Moreover, alternative causal pathways may exist. It is possible that individuals who prioritise nutrition are more likely to modify their environments. Future studies should therefore investigate the influence of these environmental factors on the recommended diet, as well as the reverse impact of dietary balance on the environment.
Policy implications
While Thailand has implemented partial actions in nutrition information and public sector provision, measures directly targeting the traditional/local and commercial retail environment remain limited and weakly enforced, particularly modern retail settings such as supermarkets and convenience stores(59). Currently, Thailand lacks comprehensive national policies such as retail zoning, shelf placement, pricing or in-store marketing designed to favour healthier options. The absence of such structural policies can directly undermine adult dietary balance. Consequently, the findings of this study suggest the following: First, a recommended diet is significantly lower among specific groups of Thais (i.e. male, younger adult, low education and high income). Government attention needs to be focused on developing specific interventions for these vulnerable populations, such as improving food literacy, increasing access to healthy foods, and limiting access to unhealthy foods. It is also important for the government to regularly monitor the population’s dietary balance and understand their circumstances, including the degree to which they can access both healthy and unhealthy foods.
Second, the study highlights the association of the availability and proximity of retail outlets with a recommended diet. These factors could serve as key indicators in improving dietary outcomes. In particular, the finding of a strong association between the presence of modern trade retailers near the residential area and the recommended diet points to the importance of monitoring the food environment and informing relevant interventions for a healthier diet. Other government support (e.g. zoning regulations, limiting the proportion of unhealthy food items sold, promoting healthy food corners, restricting unhealthy food marketing in retail settings, etc.) should be implemented to more effectively address unhealthy food consumption and reduce access to unhealthy foods.
This aligns with regional policy efforts to improve nutrition on retail environments. For example, the Quezon City Anti-Junk Food and Sugary Drinks Ordinance in the Philippines directly restricts the sale and promotion of unhealthy products to school-aged children(Reference Phulkerd, Samsiripong and Borazon60). In contrast, other countries embed nutrition within broader policy frameworks such as Indonesia’ Ministry of Health Regulation No. 17/2020 on Healthy Markets, which promotes safe retail practices, and Malaysia’s National Agrofood Policy 2021–2030 (NAP 2·0), which integrate nutrition goals with food security, economic development, and sustainability.
Third, the presence of home/kitchen gardens and fresh markets can enhance access to a healthy diet. Therefore, government should invest more in promoting home gardening by developing individual skill and providing practical guidelines for gardening at home that are adaptable to various settings and free from space-related barriers. The government should also aim to strengthen the role of fresh markets by enhancing hygienic standards, ensuring affordable prices and expanding access for consumers across urban and rural areas.
Fourth, implementing public information campaigns to promote a healthy diet, alongside other government action, should be an effective policy tool to educate and raise awareness among the target population, as well as to encourage healthier food behaviours that align with government policy goals. Such campaigns can also help mobilise public support and, ultimately, influence policy decisions.
Fifth, improved diet balance cannot be achieved without enhancing food literacy – which requires adequate knowledge, attitudes, skills and practices related to a healthy diet. Therefore, alongside creating a healthy food environment, improving food literacy is essential. High food literacy can help protect people – especially the younger generation – from an unhealthy food environment, particularly in the face of aggressive food marketing that is increasingly prevalent today.
Conclusions
The majority of Thai adults need dietary improvement. The recommended diets were associated with several factors, including food environment characteristics. There is a dearth of evidence on the relationship between food environment and population’s recommended diet in many countries in Southeast Asia, particularly Thailand. This study found that adherence to the recommended diet, as reflected by MTHEI scores, varied according to perceived access to different food retail environments, presence of home gardening, exposure to public information campaigns and several socio-demographic characteristics among a national sample of Thai adults. These findings highlight the potential role of food environments in shaping dietary quality and support the need for policies and interventions that promote healthy diets among the Thai population. Particular attention may be needed for population groups at greater risk of poorer diet quality, including younger adults, those with higher education and formerly-married individuals. Efforts to support healthy food access, encourage home gardening, strengthen community-based and social marketing initiatives and improve food literacy may help promote healthier dietary patterns among Thai adults.
Supplementary material
The supplementary material for this article can be found at https://doi.org/10.1017/S1368980026103711.
Acknowledgements
The authors would like to thank survey participants, the National Statistical Office and the Institute for Population and Social Research at Mahidol University for their contributions to this study.
Authorship
SP: Conceptualisation, funding acquisition, investigation, methodology, project administration, writing – original draft preparation, writing – review and editing. ST: Formal analysis, investigation, methodology, writing – review and editing. NT: Formal analysis, investigation, methodology, writing – review and editing. SS: Conceptualisation, methodology, writing – review and editing. AC: Conceptualisation, methodology, writing – review and editing. RG: Conceptualization, methodology, writing – review and editing. UP: Conceptualisation, methodology, writing– review and editing.
Financial support
This work was funded by the Thai Health Promotion Foundation (Grant number: 65-00-0242). The funder had no role in the study design or implementation of this research.
Competing interests
SP has served as a member of the steering committee of the Food for Health Plan of Thai Health Promotion Foundation. All other authors have nothing to declare.
Ethical standards
This study was conducted according to the guidelines laid down in the Declaration of Helsinki, and all procedures involving research study participants were approved by the Institutional Review Board of the Institute for Population and Social Research of Mahidol University (COA. No. 2022/01-012). Written [or Verbal] informed consent was obtained from all subjects.


 Open access

