Implications
Advances in process engineering facilitate the online measurement of milk progesterone levels in the milking parlor. Continuous sampling results in progesterone profiles describing the reproductive cycle of the cow. Previous studies have demonstrated that the use of such data in fertility management might enhance reproductive performance. The availability of real-time data, however, generates the need to automatically detect or predict relevant events from the data. Within the current study, we present mathematical approaches to detect low progesterone concentrations in progesterone time series that are indicative of estrus events. From these data, interovulatory intervals can be calculated.
Introduction
In the last few decades, the pregnancy rate to first artificial insemination (AI) in dairy cattle has decreased continuously, for example, 1% per year during the period from 1975 to 1998 in Great Britain (Royal et al., Reference Royal, Mann and Flint2000a). The decline is affected by a negative genetic correlation between 305-day milk yield and the conception to first service, which implies that cows with a higher genetic merit for milk yield require a higher number of AIs to get pregnant (Pryce et al., Reference Pryce, Veerkamp, Thompson, Hill and Simm1997). Therefore, the breeding goals in dairy cattle need to be more focused toward fertility to select cows with sufficiently high milk yield and simultaneously high reproductive performances to account for the undesirably genetic correlation between milk yield and fertility. Traditional fertility measures include ‘interval to first service’, ‘days open’, ‘calving interval’, ‘conception rate to first service’ and ‘number of services per conception’. These traits are exclusively based on simple phenotypic observations that can be recorded in the field and do not adequately reflect the underlying physiological phenomena (Royal et al., Reference Royal, Mann and Flint2000a). In addition, the heritabilities of these traits are ⩽0.09 (Hayes et al., Reference Hayes, Cue and Monardes1992; Marti and Funk, Reference Marti and Funk1994; Pryce et al., Reference Pryce, Veerkamp, Thompson, Hill and Simm1997). The evaluation of metabolic or endocrinologic biomarkers more adequately reflecting the underlying physiology might be a promising alternative. In the context of fertility, progesterone profiles, which can advantageously be measured in milk samples, have been proposed to assess fertility performance. Periodically increasing and decreasing concentrations of this hormone reflect the formation and the lifespan of the corpus luteum (Royal et al., Reference Royal, Darwash, Flint, Webb, Wooliams and Lamming2000b). The simplest approach is to measure the progesterone level and define a threshold to assess the length of the follicle and luteal periods. The thresholds for luteal activity varied in a large range because of the lipophilic character of progesterone; the threshold depends on the medium in which progesterone is analyzed. The lower the fat concentration, the lower the progesterone concentration. Depending on milk sampling such as time of sampling, and further processing such as centrifugation, for example, Shrestha et al. (Reference Shrestha, Nakao, Suzuki, Higaki and Akita2004) used a threshold of 1 ng progesterone/ml skimmed milk (double centrifuged), McCoy et al. (Reference McCoy, Lennox, Mayne, McCaughey, Verner, Catney, Wylie, Kennedy and Gordon2001) had a threshold of 1.5 ng progesterone/ml foremilk, 3 ng progesterone/ml whole milk sample was determind by Lamming and Darwash (Reference Lamming and Darwash1998) and a threshold of 15 ng progesterone/ml milk fat was used by Opsomer et al. (Reference Opsomer, Gröhn, Hertl, Coryn, Deluyker and de Kruif2000). These studies derived parameters from the progesterone profiles to describe the ovarian activity of dairy cows, including the postpartum commencement of luteal activity, the length of the luteal phase and the length of the interovulatory or interluteal interval. However, none of these studies has used an algorithm to derive appropriate parameters from the progesterone time series. Indeed, there is only one model that predicted the ovarian activity on the basis of time series of milk progesterone measures (Friggens and Chagunda, Reference Friggens and Chagunda2005). This model estimates the length of postpartum anoestrus, the status of the estrus cycling (follicle phase with low progesterone concentrations, and luteal phases with high progesterone concentrations) and a potential pregnancy status, and was subsequently tested and validated by Friggens et al. (Reference Friggens, Bjerring, Ridder, Højsgaard and Larsen2008). The authors obtained a high sensitivity (99.2% for confirmed and 93.3% for simulated estrus events). Owing to the lack of studies that deal with algorithms for analyzing the progesterone time series, the aim of the current study was to derive individual progesterone profiles from milk progesterone measurements and to assess the ability of three mathematical approaches to detect low progesterone concentrations indicative of the estrus period. For this purpose, the detection performance for each model was compared at different progesterone thresholds to gain additional information about the behavior of different thresholds for the progesterone time series. Practical implications of the methods were evaluated and discussed.
Material and methods
Animals and management
The data originate from primiparous and multiparous Holstein dairy cows housed in freestall barns at the research farm Karkendamm belonging to the Institute of animal breeding and husbandry of the University to Kiel, located in Northern Germany. The observation periods were from April 2007 until December 2008 and from March 2010 until December 2011. The first period included 324 first lactating cows with 14 698 progesterone measurements, and the second period comprised 493 lactations of primiparous and multiparous cows with 20 123 measurements. The total number of milk progesterone measurements was thus 34 821. Only cows with a successful insemination during the data recording period were considered; the resulting data set includes a total of 257 inseminations. Cows with less than 12 subsequent observations in 42 days or measurement gaps of more than 14 days, and cows prepared for superovulation, were excluded. The cows were milked twice daily and the yields were individually recorded. The average 305-day ECM in the two observation periods were 11 731 and 12 189 kg, respectively. There was no defined breeding season. The time of insemination was determined by visual detection of estrus supported by activity meter specification (GEA Farm Technologies GmbH, Bönen, Germany). All inseminations were performed by experienced AI technicians. The herd manager had no insight into the progesterone measurements and the veterinarians verified ultrasonographic-pregnancy diagnoses 35 days after AI.
Progesterone measurements
Samples of ~5 ml of foremilk were taken twice weekly on Monday morning and Thursday afternoon. Animals were sampled beginning 6 days after parturition and ending 30 days after a positive ultrasonographic gestation diagnosis. The milk samples were stored without any preservatives at −18°C until enzyme immunoassays for progesterone were performed. Progesterone quantification was carried out from aliquots of 20 µl skimmed milk applying the ELISA procedure, which uses a monoclonal progesterone antibody bound to the surface of a 96-well micro-plate. Horseradish peroxidase was used as conjugate and Tetrametyhlbenzidine as chromogen. The reaction was stopped by addition of 50 µl of 2 M H2SO4/well. The optical density was measured and plotted against the mass of conjugate with a wavelength of 450 nm using a SLT Spectra photometer (Tecan, Männedorf, Switzerland). To determine the measuring accuracy, the accuracy in a duplicate approach by Doerffel (Renner, Reference Renner1970) was applied. The accuracy is defined as
 $${\rm accuracy}=\sqrt {{{\mathop{\sum}{(x1{\minus}x2)^{2} } } \over {2{\times}n}}} $$
where x1 and x2 was one pair of duplicates and n was the number of pairs. For this purpose, the milk samples from two cows in heat (low progesterone concentrations) and one pregnant cow (high progesterone concentrations) were used. The degree of accuracy for the low concentrations was ±0.034% and±0.027% and for high concentrations±0.012%, meaning there was a discrepancy of±0.034% between x1 and x2 for low concentrations.
Statistical procedures
Three statistical approaches were applied to analyze the time series of progesterone measurements. The first procedure uses the well-established exponentially weighted moving average control chart (EWMA CC). Furthermore, a simple method and an extended threshold method were developed. The EWMA CC and the simple threshold method were set up using SAS® (SAS, 2004); the extended threshold approach was implemented within the R statistical environment version 2.15. (R Development Core Team, 2012).
EWMA CC
The EWMA control chart is a graphical representation plotting a sequence of exponentially weighted progesterone measurements over time and including three horizontal lines (Figure 1). The dashed line defines the centerline; the solid lines represent the upper and the lower control limit. If all observations are made between control limits, the process is in control. Montgomery (Reference Montgomery2009) stated that an observation outside the limits indicates an out-of-control process.
Exponentially weighted moving average control chart (EWMA CC) for detecting low progesterone concentration within time series.

The EWMA CC is defined as
 $$z_{i} =\lambda x_{i} {\plus}\left( {1{\minus}\lambda } \right)z_{{i{\minus}1}} $$
where z i is the EWMA statistic and x i is the measurement at time i, respectively. Initially, the first z i is the process target, so that Z 0=μ 0. Lambda is a memory parameter with 0<λ⩽1 controlling the decrease of weights of the observations over time. If λ is close to 1, there is more weight to the recent data and less weight to the older data. In contrast, if λ is close to 0, then older data receive more weight than the current data. The definition of the upper (UCL) and lower (LCL) control limits is
 $$\eqalignno{{\rm UCL}/{\rm LCL}=\mu _{0} \,\pm\,L\sigma \root\of {\left( {\lambda /{\rm 2}{\minus}\lambda } \right)\left[ {{\rm 1}{\minus}\left( {{\rm 1}{\minus}\lambda } \right)^{{2i}} } \right] }\cr\quad ({\rm Montgomery},\,2009).$$
The values of λ and the value of L were ascertained empirically by varying the parameters. In this study, λ was defined as 0.2 and the parameter L as 0.65. The included average progesterone concentration and the weighted standard deviation of the progesterone concentration within each cow implied that the LCL as ‘threshold’ represented the level of progesterone concentration over the whole observation period for each cow (see Figure 1). According to the objectives of this study, only the lower control limits were of initial interest. Initially, a scan for low progesterone concentration within the time series of the EWMA statistic was carried out. One low progesterone concentration was established if a value of the EWMA statistic was preceded by a smaller or equal value and followed by two greater values. The second step was to identify local low progesterone concentration. The assumption was that local low progesterone concentration was found if the low progesterone concentration is less than or equal to the LCL. The arrow in Figure 1 illustrates this on day 255 postpartum. Visual comparison shows some low progesterone concentration directly above LCL. The average difference between the LCL and the centerline is −0.32±0.08 (standard deviation). Allowing three positive standard deviations from the average of the distance between the LCL and the centerline, it results in a distance of −0.08 (=confidence range). A confidence range of −0.08 can detect local low progesterone concentration. The confidence range is to overcome the inadmissibility of typically periodic behavior (Benneyan, Reference Benneyan1998) in the current application. LCLs close to the centerline are not capable of indicating the lowest weighted concentration, because in this case the weighted progesterone measures within the falling and raising edge, respectively, are detected.
Threshold definition for threshold models
To determine the optimal progesterone threshold, which is indicative of luteal activity, we compared different progesterone thresholds with respect to their properties for both, the simple and the extended threshold models (see Figures 2a to d). For the simple threshold model, the results showed that, if the threshold is ⩽1.2 ng progesterone/ml skimmed milk, the error rate is smaller compared with thresholds of 1.4 or 1.6 ng progesterone/ml skimmed milk, respectively. Similarly, sensitivity was highest if the threshold was 1.2 ng progesterone/ml skimmed milk, and decreased if the threshold exceeded 1.2 ng progesterone/skimmed milk (Figure 2a and b). To ensure the comparability between the two threshold models, we decided to use a threshold of 1.2 ng progesterone/ml skimmed milk, for the extended threshold model with a threshold as well, despite the finding that higher thresholds performed slightly better (Figure 2c and d). Differences in sensitivity between the first and second data set for the extended threshold model might be explained by the fact that the first data set consisted of only first-lactating dairy cows that had at least one previous luteal activity before getting pregnant that allows the detection of zero-crossings in the time series. The second data set included six cows that had no previous luteal activity before getting pregnant, and thus zero-crossings could not be identified. For this reason, lower sensitivities of the extended threshold model were not just attributed by the threshold level. Different lactation numbers can also be the reason for differences in error rates between the first and second data set, as Friggens et al. (Reference Friggens, Bjerring, Ridder, Højsgaard and Larsen2008) reported on individual progesterone levels between cows, and it cannot be ruled out that the individual progesterone levels become more important between primiparous and multiparous dairy cows.
Comparison of detection performance with different progesterone thresholds for (a) the simple threshold model (data set 1), (b) the simple threshold model (data set 2), (c) the extended threshold model (data set 1) and (d) the extended threshold model (data set 2).
Simple threshold method
This method detected low progesterone concentrations during the estrus event, if one value was below the level of 1.2 ng progesterone/ml skimmed milk and the preceding and following values were above the threshold. If two successive progesterone measures were below the threshold, the measure with the lowest progesterone concentration was detected as the measure of interest. This excluded a detection of low concentration at the falling and rising edge in the progesterone time series of the estrus cycle. In Figure 3, the arrow shows low progesterone concentration on day 170 postpartum.
Simple threshold method for detecting low progesterone concentration within time series.
Extended threshold method
The extended threshold approach implies curve sketching and was also used by Gorzecka et al. (Reference Gorzecka, Codrea, Friggens and Callesen2011) for detecting low progesterone concentrations. The sampling interval in the current study was less frequent to that applied by Gorzecka et al. (Reference Gorzecka, Codrea, Friggens and Callesen2011). Therefore, the time series of progesterone measurements were interpolated with the R package ‘stinepack’ (Johannesson et al., Reference Johannesson and Bjornsson2009) with the included subfunction ‘scaledstineman’ (see open circle in Figure 4). The subfunction ‘scaledstineman’ tends to lower overshooting at abrupt extreme values than other methods (Stineman, Reference Stineman1980). The lower overshooting tendency was necessary to maintain the variable characteristics of the progesterone profiles. To remove high-frequency noise, the Kolmogorov–Zurbenko linear low-pass filter (‘kza’ package) (Close and Zurbenko, Reference Close and Zurbenko2011) was applied, which is shown as the smoothed progesterone concentration in Figure 4. This filter is mainly a repetitive moving average filter with two parameters: the length of the window (m) and the number of iterations (k). In literature, there are no generally accepted parameters for m and k, so that the height of the smoothing was specified visually. In this study, the value of m was 4 and 2 for the parameter k. This filter is also beneficial because it is robust with regard to missing data. The dotted line in Figure 4 shows the smoothed first derivative that was calculated by the function ‘stinemanslopes’ with the ‘kza’ packages. Subsequently, all values with zero-crossings were detected. The unfilled arrows in Figure 4 illustrate the zero-crossings. The level of the threshold for the luteal activity was also 1.2 ng progesterone/ml skimmed milk. Low progesterone concentrations during an estrus event were found if the smoothed first derivative was 0 and passed from negative to positive values, and the concentration of the interpolated time series was below the threshold of 1.2 ng progesterone/ml skimmed milk (see the arrows in Figure 4). The first day of the zero-crossing with the low progesterone concentration is then the first day with the low progesterone concentration. The arrow illustrates this on day 170 postpartum in Figure 4. The r code, which was used for the detection of zero-crossings in the progesterone time series, is given in Supplementary Material S1.
Exended threshold method for detecting low progesterone concentration within time series.
Approach performance
The performance of the three methods can be evaluated by the number of correctly and incorrectly classified low progesterone concentrations during a specified time window (±5 days) around an insemination by a following positive pregnancy determination (ultrasonographic diagnosis), without subsequent insemination and calving after 284 days. The detection period illustrated the decrease in progesterone concentration before an estrus event and the increase in progesterone concentration after an estrus event. It was a true-positive (TP) low progesterone concentration if the concentration was identified within the time window. If there were two low progesterone measurements identified within the time window, these two concentrations were integrated into a single detected low progesterone measurement. It was a false-positive (FP) low progesterone concentration if the concentration was outside the time window. If there was no low progesterone concentration identified within the time window, then it was a false-negative (FN) alert. All high progesterone concentrations were not indicative for an estrus event and were called true-negative (TN).
 $${\rm Sensitivity}=\left( {{\rm TP}/\left( {{\rm TP}{\plus}{\rm FN}} \right)} \right)$$
 $${\rm Specificity}=\left( {{\rm TN}/\left( {{\rm TN}{\plus}{\rm FP}} \right)} \right)$$
 $${\rm Error}\,{\rm rate}=\left( {{\rm FP}/\left( {{\rm FP}{\plus}{\rm TP}} \right)} \right)$$
Calculated progesterone concentrations during a detected estrus event are indented to show what the level is during an estrus event.
Results
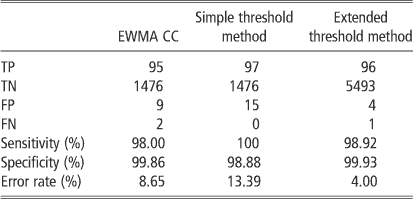
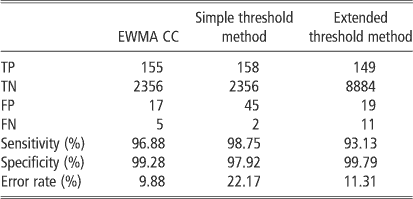
Of the 97 estrus events during the first observation period, the three methods detected at least 95 estrus events associated with a decreased progesterone concentration below 1.2 ng progesterone/ml skimmed milk or with corresponding EWMA CC rules. The sensitivity of the three approaches was almost identical and high with 98.00% (EWMA CC) v. 98.92% (extended threshold method) v. 100% (simple threshold method). However, there were considerable differences between the error rates, which lay between 4.00% and 13.39%. The error rate indicated that the methods with smoothing (EWMA CC and extended threshold method) showed improved results compared with the approach without smoothing (simple threshold method). The specificity was high with 99.86% (EWMA CC), 98.88% (simple threshold method) and 99.93% (extended threshold method). The sensitivity, specificity and error rate of the first data set are listed in Table 1. The results of the second data set were almost identical to the first data set. The sensitivity ranged from 93.13% (extended threshold method) to 98.75% (simple threshold method). With 93.13% it was slightly below the sensitivity of the first data set. The error rate within the second data set was higher than in the first observation period. The lowest error rate was for the EWMA CC with 9.88% followed by the extended threshold method with 11.31%. The simple threshold method reached an error rate of 22.17%. The specificity varied between 97.92% (simple threshold method) and 99.79% (extended threshold method). Table 2 illustrates the results of the second data set. The average progesterone concentration during a TP-detected estrus event was similar in both data sets. It ranged between 0.18 and 0.28 ng progesterone/ml skimmed milk (data set 1) and between 0.21 and 0.26 ng progesterone/ml skimmed milk (data set 2). The results are summarized in Table 3. Although the EWMA CC had generally no determined threshold, the maximum value was <1.2 ng progesterone/ml skimmed milk. In contrast to the results of TP-detected progesterone concentration, the average of the concentration during an FP-detected estrus event was higher (Table 4). The average ranged between 0.77 and 0.95 ng progesterone/ml skimmed milk (data set 1) and between 0.69 and 0.87 ng progesterone/ml skimmed milk (data set 2).
Summary of detection results of each method for the data set 1 (97 cows) given as TP, TN, FP and FN estrous events
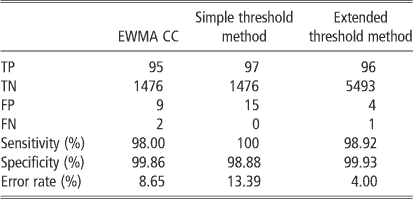
TP=true positive; TN=true negative; FP=false positive; FN=false negative; EWMA CC=exponentially weighted moving average control chart.
Summary of detection results of each method for the data set 2 (160 cows) given as TP, TN, FP and FN estrous events
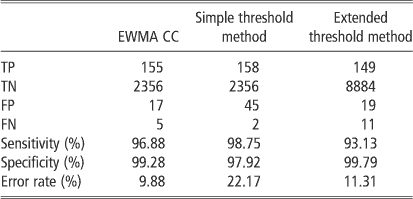
TP=true positive; TN=true negative; FP=false positive; FN=false negative; EWMA CC=exponentially weighted moving average control chart.
Results of the calculated progesterone concentrations during a true-positive–detected estrous event in ng progesterone/ml skimmed milk (data set 1Footnote */data set 2Footnote *)

EWMA CC=exponentially weighted moving average control chart.
* Included 97 cows.
** Included 160 cows.
Results of the calculated progesterone concentrations during a false-positive–detected estrous event in ng progesterone/ml skimmed milk (data set 1Footnote */data set 2Footnote *)

EWMA CC=exponentially weighted moving average control chart.
* Included 97 cows.
** Included 160 cows.
Discussion
The approaches have high sensitivities in both data sets and low error rates, especially the EWMA CC and the extended threshold method. The results are comparable to and sometimes superior to other studies. For example, the method developed by Friggens et al. (Reference Friggens, Bjerring, Ridder, Højsgaard and Larsen2008) reached 99.2% of the confirmed estruses and 93.3% of the ratified estruses using progesterone measurements. Firk et al. (Reference Firk, Stamer, Junge and Krieter2003) used activity data and the information about the period since the last estrus event and achieved a sensitivity of 87.9% with an error rate of 12.5%. Eradus et al. (Reference Eradus, Scholten and Udink Ten Cate1996) worked with activity data, milk yield and milk temperature, and obtained a sensitivity rate of 79% and an error rate of 6.6%. Jønsson et al. (Reference Jønsson, Björgvinsson, Blanke, Poulsen, Højsgaard and Munksgaard2008) used a combination of activity and lying data and gained a sensitivity of 88.9% and an error rate of 5.9%. However, in contrast to these other studies that detected an online estrus event for an improved estrus detection on-farm, this study was developed for the detection of estrus events in the progesterone time series for a following parameter definition out of the progesterone measurements. The error rate of the simple threshold method was higher in both data sets than that of EWMA CC and the extended threshold method. False-positive–detected low progesterone concentrations fluctuated around the threshold of 1.2 ng progesterone/ml skimmed milk. If only one measurement was below the limit, the simple threshold detects an estrus event. It cannot be ruled out that only one individual value was a signal noise, which implies that the simple threshold approach was not robust against outliers. This can be explained by the unsmoothed raw data in this model. Smoothed progesterone measurements have an important advantage to raw data because of the robustness against outliers. Friggens et al. (Reference Friggens, Bjerring, Ridder, Højsgaard and Larsen2008) also discussed the error rate within the ratified estrus cases with progesterone concentrations that fluctuated around their threshold value. They claim that this is the ‘main drawback of a simple threshold-based rule, which cannot be overcome by a simple smoothing of the progesterone profiles’. This drawback was the reason for applying the smoothing techniques of the EWMA control chart and the Kolmogorov–Zurbenko filter (extended threshold model) on the progesterone profiles. The height of the exponential smoothing was an optimization problem, not least because there are no comparable applications in this area. The authors Hunter (Reference Hunter1986) and Montgomery (Reference Montgomery2009) confirmed our results and stated that a value of 0.2 for λ worked well in the industrial areas. The application area of the Kolmogorov–Zurbenko filter is common in meteorological research and related areas (Capilla, Reference Capilla2008; Galanis et al., Reference Galanis, Chu and Kallos2011). The authors emphasized the elimination of high-frequency noise and the application on time series with missing data. According to the aim of the present study, the low error rates of the EWMA CC and of the extended threshold methods showed that both the smoothing techniques were able to reduce the FP-detected low progesterone concentrations, indicating estrus events in the progesterone time series.
The second intention of the EWMA CC was to establish a universal threshold for the detection of low progesterone measures during the estrus events. Thus, the LCL in the EWMA CC could be a solution to the concern reported by Friggens et al. (Reference Friggens, Bjerring, Ridder, Højsgaard and Larsen2008) who described cow-specific differences in the progesterone levels. Thus, simple threshold method might not be the optimal way to detect the estrus events in the progesterone time series. Regardless of this unusual approach of the EWMA control chart to the progesterone time series, the results showed low error rates during testing and validating. However, EWMA CC was applied to activity data to detect the estrus cases (Krieter et al., Reference Krieter, Stamer and Junge2006). The authors used the EWMA control chart as a control mechanism for estrus detections by neuronal networks. The sensitivity for the EWMA chart within the training set was 71.3% (L=3.0) and 77.3% (L=2.5); for the validation it was 66.9% (L=3.0) and 70.6% (L=2.5). The authors stated that the use of EWMA control chart for estrus detection with activity data was less successful because of the high error rates (between 17.1% and 20.9%) within training and validation sets.
As opposed to McCoy et al. (Reference McCoy, Lennox, Mayne, McCaughey, Verner, Catney, Wylie, Kennedy and Gordon2001), who defined a threshold of >1.5 ng progesterone/ml foremilk that is indicative of luteal activity, our threshold was slightly lower (1.2 ng progesterone/ml skimmed milk) (see Figure 2), because the results of the threshold comparison showed good detection performances if a threshold of 1.2 ng progesterone/ml skimmed milk was used. This was substantiated by the fact that this study used defatted foremilk, whereas McCoy et al. (Reference McCoy, Lennox, Mayne, McCaughey, Verner, Catney, Wylie, Kennedy and Gordon2001) used foremilk samples that were not centrifuged. Owing to the lipohilic character of progesterone, its concentration and consequently the appropriate threshold is slightly lower in this study. In contrast to other studies, Lamming and Darwash (Reference Lamming and Darwash1998) analyzed progesterone in unextracted whole milk samples and defined a threshold of 3 ng/ml for identifying luteal activity. Shrestha et al. (Reference Shrestha, Nakao, Suzuki, Higaki and Akita2004) defined the luteal activity by a concentration greater equal 1 ng progesterone/ml in milk samples that were double centrifuged. Opsomer et al. (Reference Opsomer, Gröhn, Hertl, Coryn, Deluyker and de Kruif2000) analyzed progesterone in milk fat and defined a value of 15 ng/ml as the threshold for indicating ovarian activity. The comparison of different threshold values for identifying the luteal activity in milk samples required the consideration of the time of sampling and the further processing of milk for quantifying progesterone concentrations. This results from the fact that progesterone is present mainly in the cream fraction of the milk (Schwalm and Tucker, Reference Schwalm and Tucker1978). Pennington et al. (Reference Pennington, Spahr and Lodge1981) showed that first milk has a significantly (P<0.01) lower progesterone concentration than composite milk. These findings were confirmed by Waldmann et al. (Reference Waldmann, Ropstad, Landsverk, Sørensen, Sølverød and Dahl1999). In addition, Darling et al. (Reference Darling, Laing and Harkness1974) found that progesterone concentrations tend to be higher in the milk collected in the evening than in the morning. To reduce the impact of sampling time on progesterone concentration as proposed by Pope and Swinburne (Reference Pope and Swinburne1980), skimmed milk was used in the current study.
The calculated average of progesterone concentration during the estrus events was low. The values ranged between 0.18 and 0.28 ng progesterone/ml skimmed milk (data set 1) and 0.26 and 0.32 ng progesterone/ml skimmed milk for data set 2. The current values were lower in comparison with other literatures (Heap et al., Reference Heap, Gwyn, Laing and Walters1973; Schiavo et al., Reference Schiavo, Matuszczak, Oltenacu and Foote1975). Owing to the lipophilic character of progesterone, it must be taken into account whether the samples were from fore milk, whole milk or last milk when considering these results (Schwalm and Tucker, Reference Schwalm and Tucker1978). The use of skimmed milk or composite milk must be evaluated differently when assessing the levels of progesterone concentrations, a fact already thoroughly discussed in relation to different threshold values.
Conclusion
The results of the classification performance and the calculated progesterone concentration levels during an estrus event lead to the conclusion that the three methods have the potential to successfully analyze the progesterone profiles. It is possible to detect reliable low progesterone concentration in the progesterone time series during a known estrus event. Owing to the concentration levels in false-positive estrus events, we conclude that a threshold of 0.8 ng progesterone/ml skimmed foremilk may indicate the luteal activity. Consequently, low and high progesterone concentrations can be separated with these methods. As a consequence of our findings, we suggest that these methods calculate correct phenotypes for, that is, interovulatory intervals, which might be used to distinguish between different genotypes.
Acknowledgments
The authors gratefully acknowledge the Federal Office for Agriculture and Food and the Federal Ministry of Food, Agriculture and Consumer Protection for financial support of the project ‘Innovative methods of trait recording in dairy cattle as a basis of the modern breeding program of the Nord-Ost-Genetic’. Furthermore, gratitude is expressed to our cooperation partners Nord-Ost-Genetic GmbH & Co. KG, Martin Luther University Halle-Wittenberg, Landesforschungsanstalt für Landwirtschaft und Fischerei MV, Sächsisches Landesamt für Umwelt, Landwirtschaft und Geologie, and Leibniz Institute for Farm Animal Biology. The authors also acknowledge the expert technical assistance of H. Kluding and E. Lass (Institute of Animal Breeding and Husbandry, Christian-Albrechts-University, Kiel, Germany).