1 Introduction
Piezoelectric inkjet (PIJ) is a vital technology that was first used in the press industry, and was later introduced to a diversity of newly emerging applications. Due to its ability to precisely deposit a wide range of different materials including polymers, metals, ceramics, etc. (De Gans, Duineveld & Schubert Reference De Gans, Duineveld and Schubert2004; Derby Reference Derby2011; Kamyshny Reference Kamyshny2011), on various substrates, it is now heavily utilized in the display, electronic device, life science and 3D printing industries (Dijksman et al.
Reference Dijksman, Duineveld, Hack, Pierik, Rensen, Rubingh, Schram and Vernhout2007; Saunders & Derby Reference Saunders and Derby2014; McKerricher, Vaseem & Shamim Reference McKerricher, Vaseem and Shamim2017). To enhance the efficiency and quality of printing, intensive investigations have been carried out to explore the influence of both the driving parameters and the fluid properties on inkjet printing. These studies are mainly focused on two highly interrelated areas, viz., the acoustic properties of the ink channel and the drop formation process. For the former, Bogy & Talke (Reference Bogy and Talke1984) first took into account the compressibility and used linear acoustics to explain the wave propagation phenomena involved in drop ejection. Their studies successfully revealed the relationships of the optimal voltage pulse width, the meniscus motion and the oscillation with the cavity length. Wijshoff (Reference Wijshoff2006) gained insight into more complicated factors of acoustics like the ‘cross-talk’ effect and put forward several drop-size-modulation (DSM) techniques to fire favourable droplets. For the latter, namely, the drop dynamics, the theoretical foundation dated back to Rayleigh’s works (Rayleigh Reference Rayleigh1879) on the instability of jets. One of the most knotty and critical problems in PIJ is the pinch-off mechanism because the breakup of the tail behind the primary drop can lead to satellites which would deteriorate the printing quality. To guarantee the printing stability, the ratio of Reynolds number to Weber number was first proposed as a criterion by Fromm (Reference Fromm1984), and was then widely accepted. Zhang et al. (Zhang Reference Zhang1999) elucidated the effects of ink properties on the dynamics of drop formation through experiments and simulations. Zhong et al. (Reference Zhong, Fang, Ma and Dong2018) considered both the driving parameters of drop-on-demand (DOD) PIJ and the liquid properties, then proposed a new non-dimensional criterion
 $Pj$
with which prior determination for a stable inkjet process is better made.
So far the studies scarcely paid attention to the motion states of a single stable droplet after the pinch-off, whereas it cannot be neglected that the shape and velocity of the moving drop can significantly influence the deposition (Rein Reference Rein1993; Yun Reference Yun2017). Earlier work by Reis (Reis, Ainsley & Derby Reference Reis, Ainsley and Derby2005) illustrated influences of the operating parameters on the volume and velocity of particle suspensions. Shin (Shin et al.
Reference Shin, Jeong, Choi and Shin2015) did similar research using aerosol particles. As for the droplet oscillation, Rayleigh (Reference Rayleigh1879) was the first who investigated the free oscillation of a drop through mathematical deduction and obtained an ideal linear relationship between frequency and
 $\sqrt{\unicode[STIX]{x1D70E}/\unicode[STIX]{x1D70C}r^{3}}$
where
 $\unicode[STIX]{x1D70E}$
is the surface tension coefficient,
 $\unicode[STIX]{x1D70C}$
is the density and
 $r$
is the droplet’s equivalent radius. Becker et al. (Becker, Hiller & Kowalewski Reference Becker, Hiller and Kowalewski1991) examined experimentally and theoretically the nonlinear effects involved in large-amplitude oscillation. Kornek (Kornek et al.
Reference Kornek, Müller, Harth, Hahn, Ganesan, Tobiska and Stannarius2010) used soap bubbles to test the theoretical models set by predecessors in this field. Despite the fact that these studies gained deep understanding of the physics behind the oscillation phenomenon, the bridge between the oscillation theory and applications in PIJ remains unclearly.
In this study we focus on the deformation of single stable droplets excited by a DOD piezoelectric inkjet system. The study includes two parts, both of which are treated by experiments and simulations. In the first part, changes of the droplet velocity and volume are investigated and explained based on Bogy’s theory (Bogy & Talke Reference Bogy and Talke1984). In the second part, the oscillation of the droplets are observed and described. The relation between the
 $Ca$
number and the deformation extent is determined, and the Rayleigh’s linear relation of the oscillation frequency is updated.
2 Experimental description
Experiments were carried upon a DOD piezoelectric inkjet system that consists of two parts: the droplet generation module and the visual observation module. The droplet generation module comprises a pressure controller, a reservoir, drive electronics and a MJ-AT-01 piezo nozzle with an orifice radius of
 $40~\unicode[STIX]{x03BC}\text{m}$
. The pressure controller can precisely regulate the back pressure of the system. The driving electronics is connected to the PC, and offers different forms of drive pulses to the piezo-nozzle. The visual observation module comprises a group of displacement benches, a LED strobe and a CCD camera equipped with a four times magnifier. The LED strobe produces flashes with an exposure time less than
 $10~\unicode[STIX]{x03BC}\text{s}$
to prevent ‘smearing’ of the drop during its journey. The CCD camera has a frame rate of 22 fps, and an effective pixel of 1280
 $\times$
960. A single pixel size is
 $3.75~\unicode[STIX]{x03BC}\text{m}$
, so the actual size of the drop can be calculated by multiplying the measured size by
 $3.75/4$
.
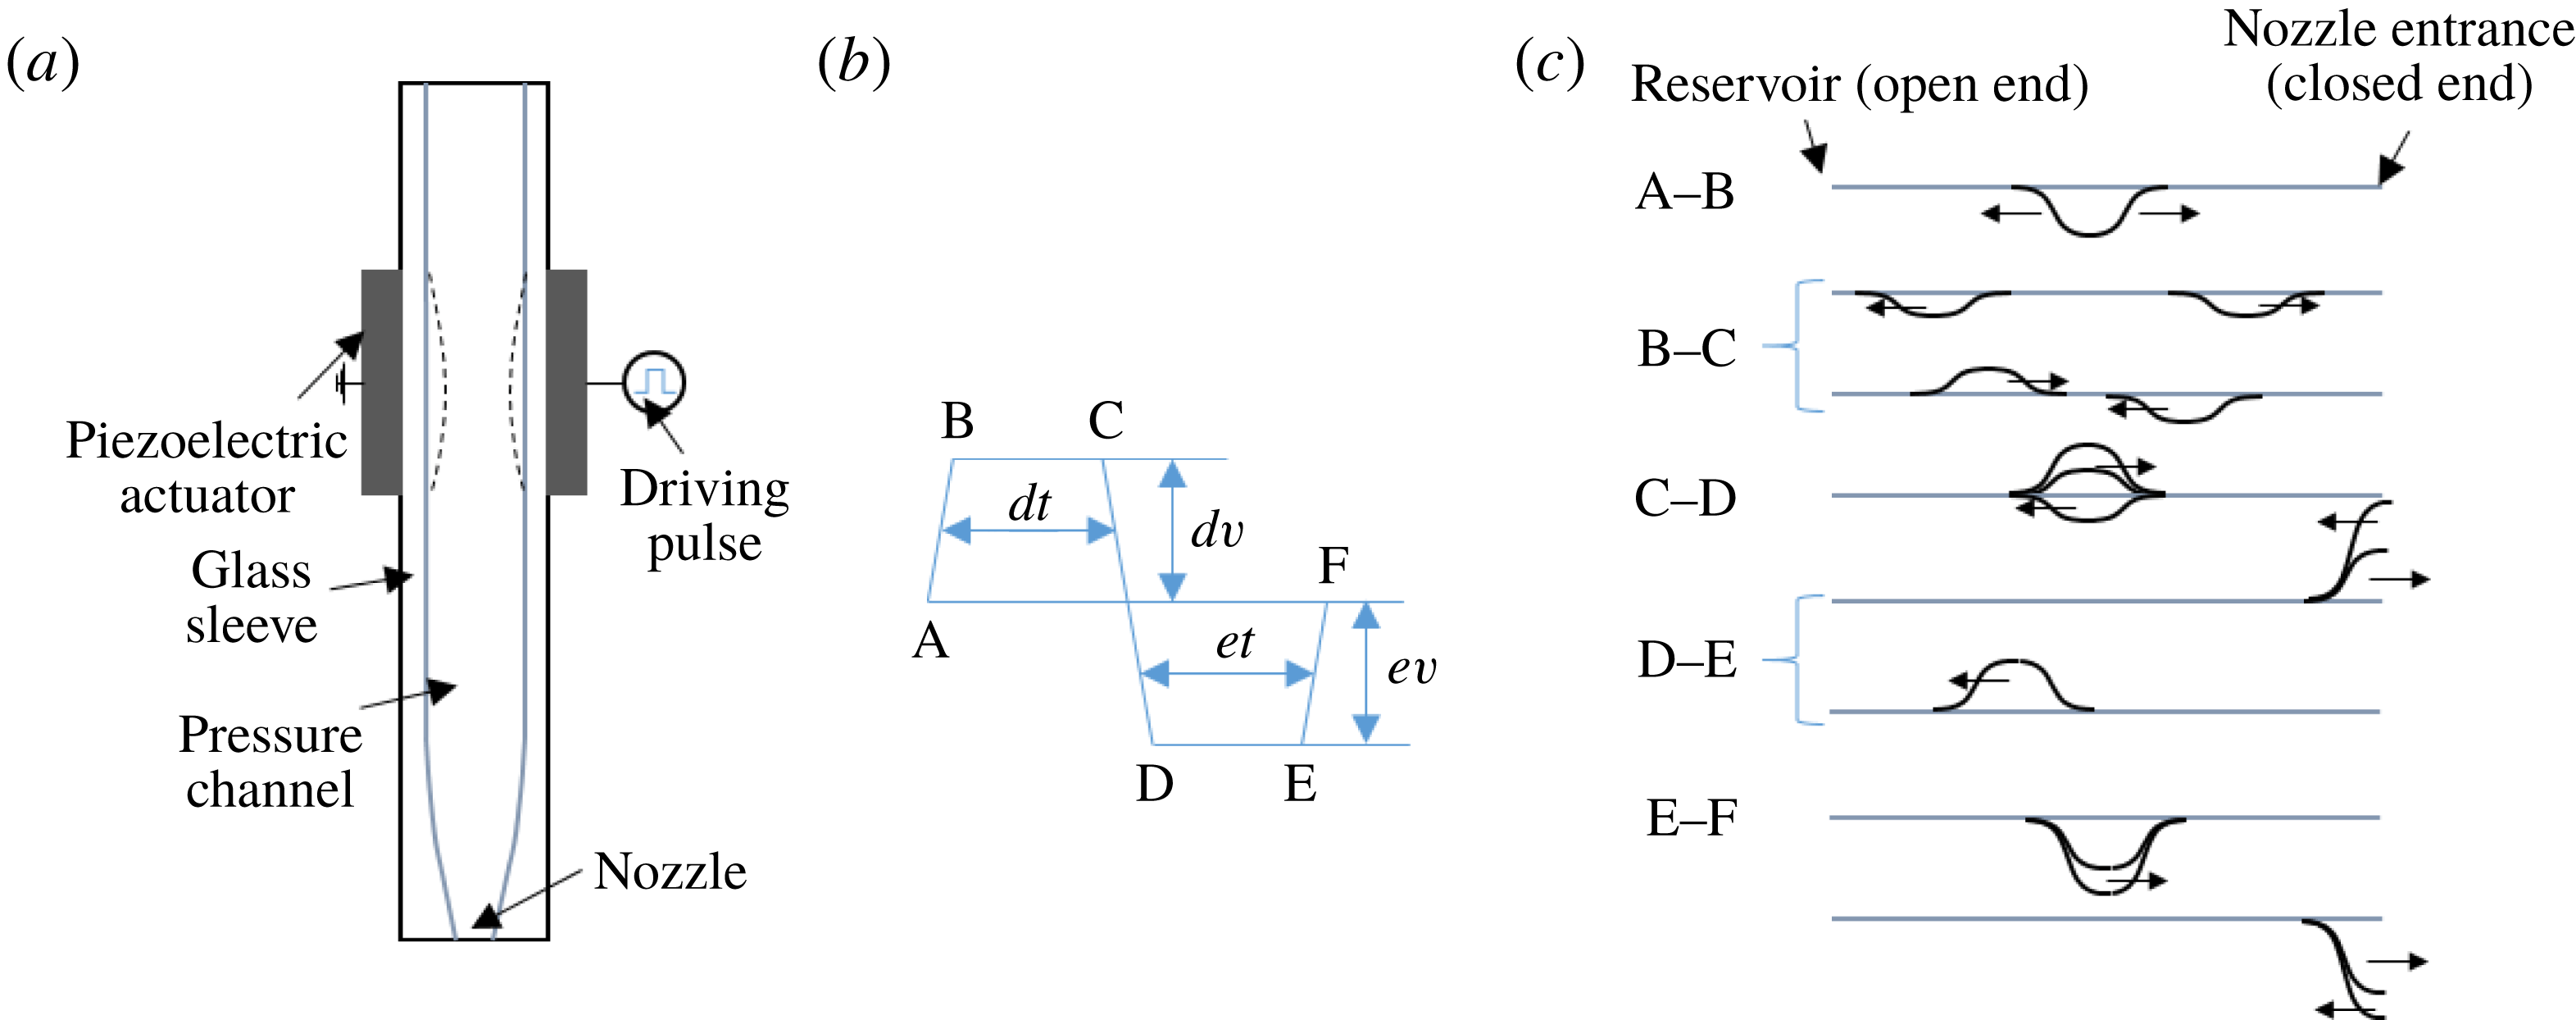
(a) Structure of the piezo-nozzle, (b) the driving pulse and (c) propagation of pressure wave in the pressure channel according to linear acoustics.

Figure 1 shows the detailed structure of the piezo-nozzle, the drive pulse and the resulting channel acoustics. We use a bipolar drive pulse that has four important parameters: the dwell voltage (
 $dv$
), the dwell time (
 $dt$
), the echo voltage (
 $ev$
) and the echo time (
 $et$
). In our study, a dwell voltage of 44–85 V, a dwell time of
 $37{-}41~\unicode[STIX]{x03BC}\text{s}$
, an echo voltage of 32–48 V and an echo time of
 $32{-}50~\unicode[STIX]{x03BC}\text{s}$
are used. After the pulse is applied, a deformation of the PZT (lead zirconate titanate) tube together with the channel occurs accordingly. As shown in figures 1(b) and 2(c), the first slope of the driving form (A–B) leads to an enlargement of the channel, and the resulting negative pressure propagates in opposite directions with half of the amplitude. The pressure is reflected with a reverse phase at the reservoir and with the same phase at the nozzle entrance (B–C). The second slope (C–D) reduces the channel to a size smaller than its original value, adding amplitude to the positive pressure travelling to the right. The compound positive pressure arriving at the nozzle entrance pushes the ink out and finally causes the droplet to form (D–E). The negative pressure travelling to the left is eliminated, and a positive pressure is generated due to the over-contraction. The residual pressure in the channel will continue to propagate and decay. The third slope restores the channel to its original size, and a negative pressure is generated. As the negative pressure reached the nozzle, it pulls back the fluid column, although its effect is limited.
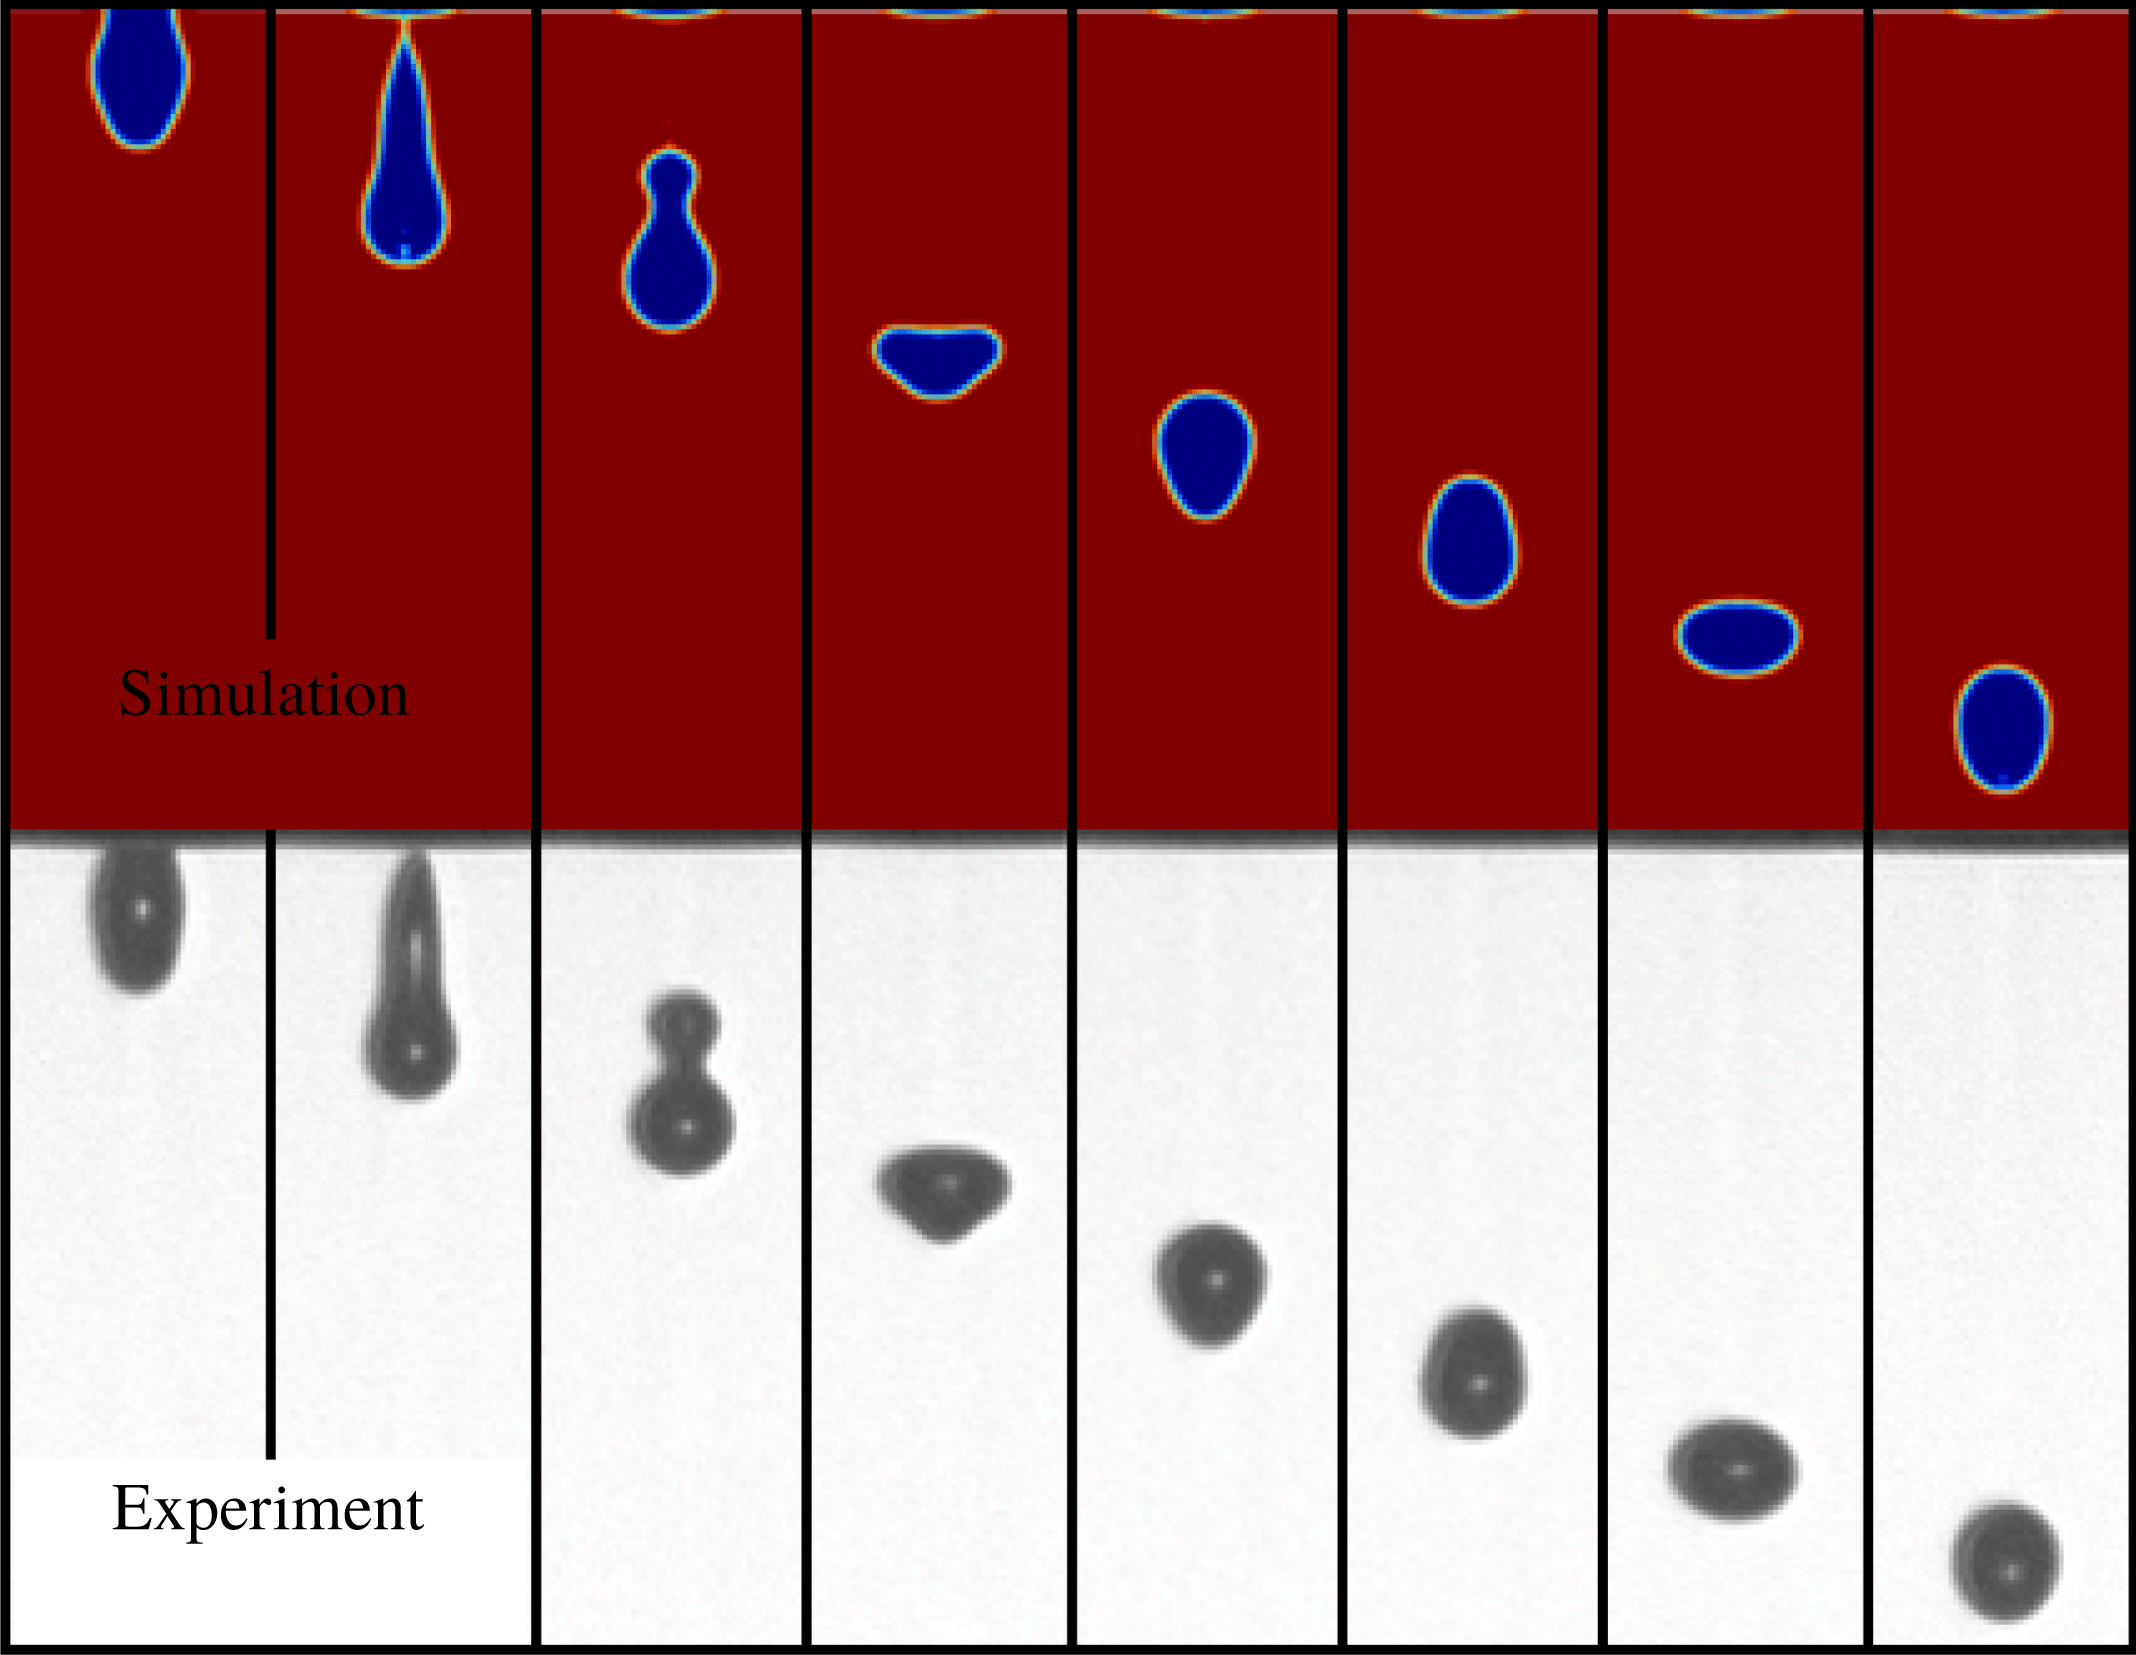
Comparison of numerical results with
 $V_{in}$
at
 $0.9~\text{m}~\text{s}^{-1}$
and experimental images with
 $dv$
at 64 V. Time intervals of consecutive images are
 $20~\unicode[STIX]{x03BC}\text{s}$
.

3 Mathematical models
In numerical simulations, the transient motion of the liquid is governed by incompressible Navier–Stokes equations. The channel acoustic plays an essential role in droplet formation, whereas the effect of compressibility is neglected during numerical calculation according to the narrow channel theory (Wijshoff Reference Wijshoff2010). The pressure is considered as an acoustic variation around a zero static value. Therefore, the incompressible Navier–Stokes equation is chosen for calculation in the study.
 $$\begin{eqnarray}\displaystyle & \displaystyle \unicode[STIX]{x1D70C}\left(\frac{\unicode[STIX]{x2202}\boldsymbol{u}}{\unicode[STIX]{x2202}t}+\boldsymbol{u}\boldsymbol{\cdot }\unicode[STIX]{x1D735}\boldsymbol{u}\right)-\unicode[STIX]{x1D707}\unicode[STIX]{x0394}\boldsymbol{u}+\unicode[STIX]{x1D735}p=\boldsymbol{F}_{st}, & \displaystyle\end{eqnarray}$$
 $$\begin{eqnarray}\displaystyle & \displaystyle (\unicode[STIX]{x1D735}\boldsymbol{\cdot }\boldsymbol{u})=0, & \displaystyle\end{eqnarray}$$
where
 $\unicode[STIX]{x1D70C}$
denotes density,
 $\unicode[STIX]{x1D707}$
denotes the dynamic viscosity,
 $\boldsymbol{u}$
is the velocity,
 $p$
is the pressure and
 $\boldsymbol{F}_{st}$
is the surface tension. The surface tension is dependent on the interface normal
 $\boldsymbol{n}$
of the liquid. To trace the shape and place of the interface, a level set method is adopted. The convection of the reinitialized level set function is as follows (Olsson & Kreiss Reference Olsson and Kreiss2005; Olsson, Kreiss & Zahedi Reference Olsson, Kreiss and Zahedi2007)
 $$\begin{eqnarray}\displaystyle \frac{\unicode[STIX]{x2202}\unicode[STIX]{x1D6F7}}{\unicode[STIX]{x2202}t}+\unicode[STIX]{x1D735}\boldsymbol{\cdot }(\unicode[STIX]{x1D6F7}\boldsymbol{u})+\unicode[STIX]{x1D6FE}\left[\left(\unicode[STIX]{x1D735}\boldsymbol{\cdot }\left(\unicode[STIX]{x1D6F7}(1-\unicode[STIX]{x1D6F7})\frac{\unicode[STIX]{x1D735}\unicode[STIX]{x1D6F7}}{|\unicode[STIX]{x1D735}\unicode[STIX]{x1D6F7}|}\right)\right)-\unicode[STIX]{x1D700}\unicode[STIX]{x1D735}\boldsymbol{\cdot }\unicode[STIX]{x1D735}\unicode[STIX]{x1D6F7}\right]=0. & & \displaystyle\end{eqnarray}$$
Here
 $\unicode[STIX]{x1D6F7}$
is the level set function,
 $\unicode[STIX]{x1D700}$
determines the thickness of the transition layer and
 $\unicode[STIX]{x1D6FE}$
determines the amount of reinitialization. The interface is defined as the 0.5 contour of
 $\unicode[STIX]{x1D6F7}$
, where
 $\unicode[STIX]{x1D6F7}$
equals 0 in air and 1 in liquid. The surface tension can be computed by
 $$\begin{eqnarray}\displaystyle & \displaystyle \boldsymbol{F}_{st}=\unicode[STIX]{x1D735}\boldsymbol{\cdot }\unicode[STIX]{x1D64F}, & \displaystyle\end{eqnarray}$$
 $$\begin{eqnarray}\displaystyle & \displaystyle \unicode[STIX]{x1D64F}=\unicode[STIX]{x1D70E}(\unicode[STIX]{x1D644}-(\boldsymbol{n}\boldsymbol{n}^{\text{T}}))\unicode[STIX]{x1D6FF}, & \displaystyle\end{eqnarray}$$
where
 $\unicode[STIX]{x1D644}$
is the identity matrix, and
 $\unicode[STIX]{x1D70E}$
denotes the surface tension coefficient;
 $\unicode[STIX]{x1D6FF}$
is a Dirac delta function that is non-zero only at the fluid interface approximated by
 $$\begin{eqnarray}\displaystyle \unicode[STIX]{x1D6FF}=6|\unicode[STIX]{x1D6F7}(1-\unicode[STIX]{x1D6F7})||\unicode[STIX]{x1D735}\unicode[STIX]{x1D6F7}|. & & \displaystyle\end{eqnarray}$$
An axisymmetric two-dimensional model is utilized. The zone between the inlet and the nozzle is filled with liquid initially while the zone from the nozzle to the substrate is filled with air. Then the velocity boundary condition at the inlet is set as
 $$\begin{eqnarray}\displaystyle v(r)=4V_{in}\left(\frac{r+0.1~\text{mm}}{0.2~\text{mm}}\right)\left(1-\frac{r+0.1~\text{mm}}{0.2~\text{mm}}\right)\text{m}~\text{s}^{-1}, & & \displaystyle\end{eqnarray}$$
where
 $V_{in}$
denotes the given velocity in the middle of the parabolic profile, and
 $r$
is the radial position. To imitate the actual velocity at the nozzle where there is a push-out and a draw-back process, we use a smooth step function to change the velocity with time, so the time-dependent velocity is
 $$\begin{eqnarray}\displaystyle v(r,t) & = & \displaystyle v(r)\cdot \{[\text{step}(t-1\times 10^{-6})-\text{step}(t-(t_{p}+1\times 10^{-6}))]\nonumber\\ \displaystyle & & \displaystyle -\,1.2[\text{step}(t-(t_{p}+1\times 10^{-6}))-\text{step}(t-(t_{p}+5\times 10^{-6}))]\},\end{eqnarray}$$
where
 $t_{p}$
is the time for which the push-out process lasts while the draw-back time is set as a constant of
 $4~\unicode[STIX]{x03BC}\text{s}$
. The outlet is set at a constant pressure. No slip condition is set on all walls except the substrate where a wetted wall with a contact angle of
 $\unicode[STIX]{x03C0}/2$
and a slip length of
 $10~\unicode[STIX]{x03BC}\text{m}$
are adopted. However, the droplet impacting and spreading processes have not been investigated in the current paper. To guarantee that a single stable droplet without satellites could be generated in the cases, we used an inlet velocity of
 $0.7{-}1.025~\text{m}~\text{s}^{-1}$
, a push-out time of
 $13{-}25~\unicode[STIX]{x03BC}\text{s}$
, a density of
 $600{-}850~\text{kg}~\text{m}^{-3}$
, a viscosity of 0.5–6 cp and a surface tension coefficient of
 $0.02{-}0.06~\text{N}~\text{m}^{-1}$
.
4 Results and discussion
In the present study, we narrow our study on the behaviour of a stable single droplet because this is the most desirable working condition for inkjet printing. A mesh-independence test has been carried out before formal calculations so that the simulation results are not sensitive to the grids. A mesh system of 30 646 grids is employed with an adaptive meshing technique to refine the region around the interface. Figure 2 presents the comparison of experimental and simulated results. It shows that the oscillation pattern in the simulation matches that in real experimental observations very well in terms of both shape and period. Therefore, the applied models and assumptions are reasonable enough to attain the accurate results in the following studies.
4.1 Velocity and equivalent radius of the droplets
In this section, we explore how the velocity
 $v$
and equivalent radius
 $r$
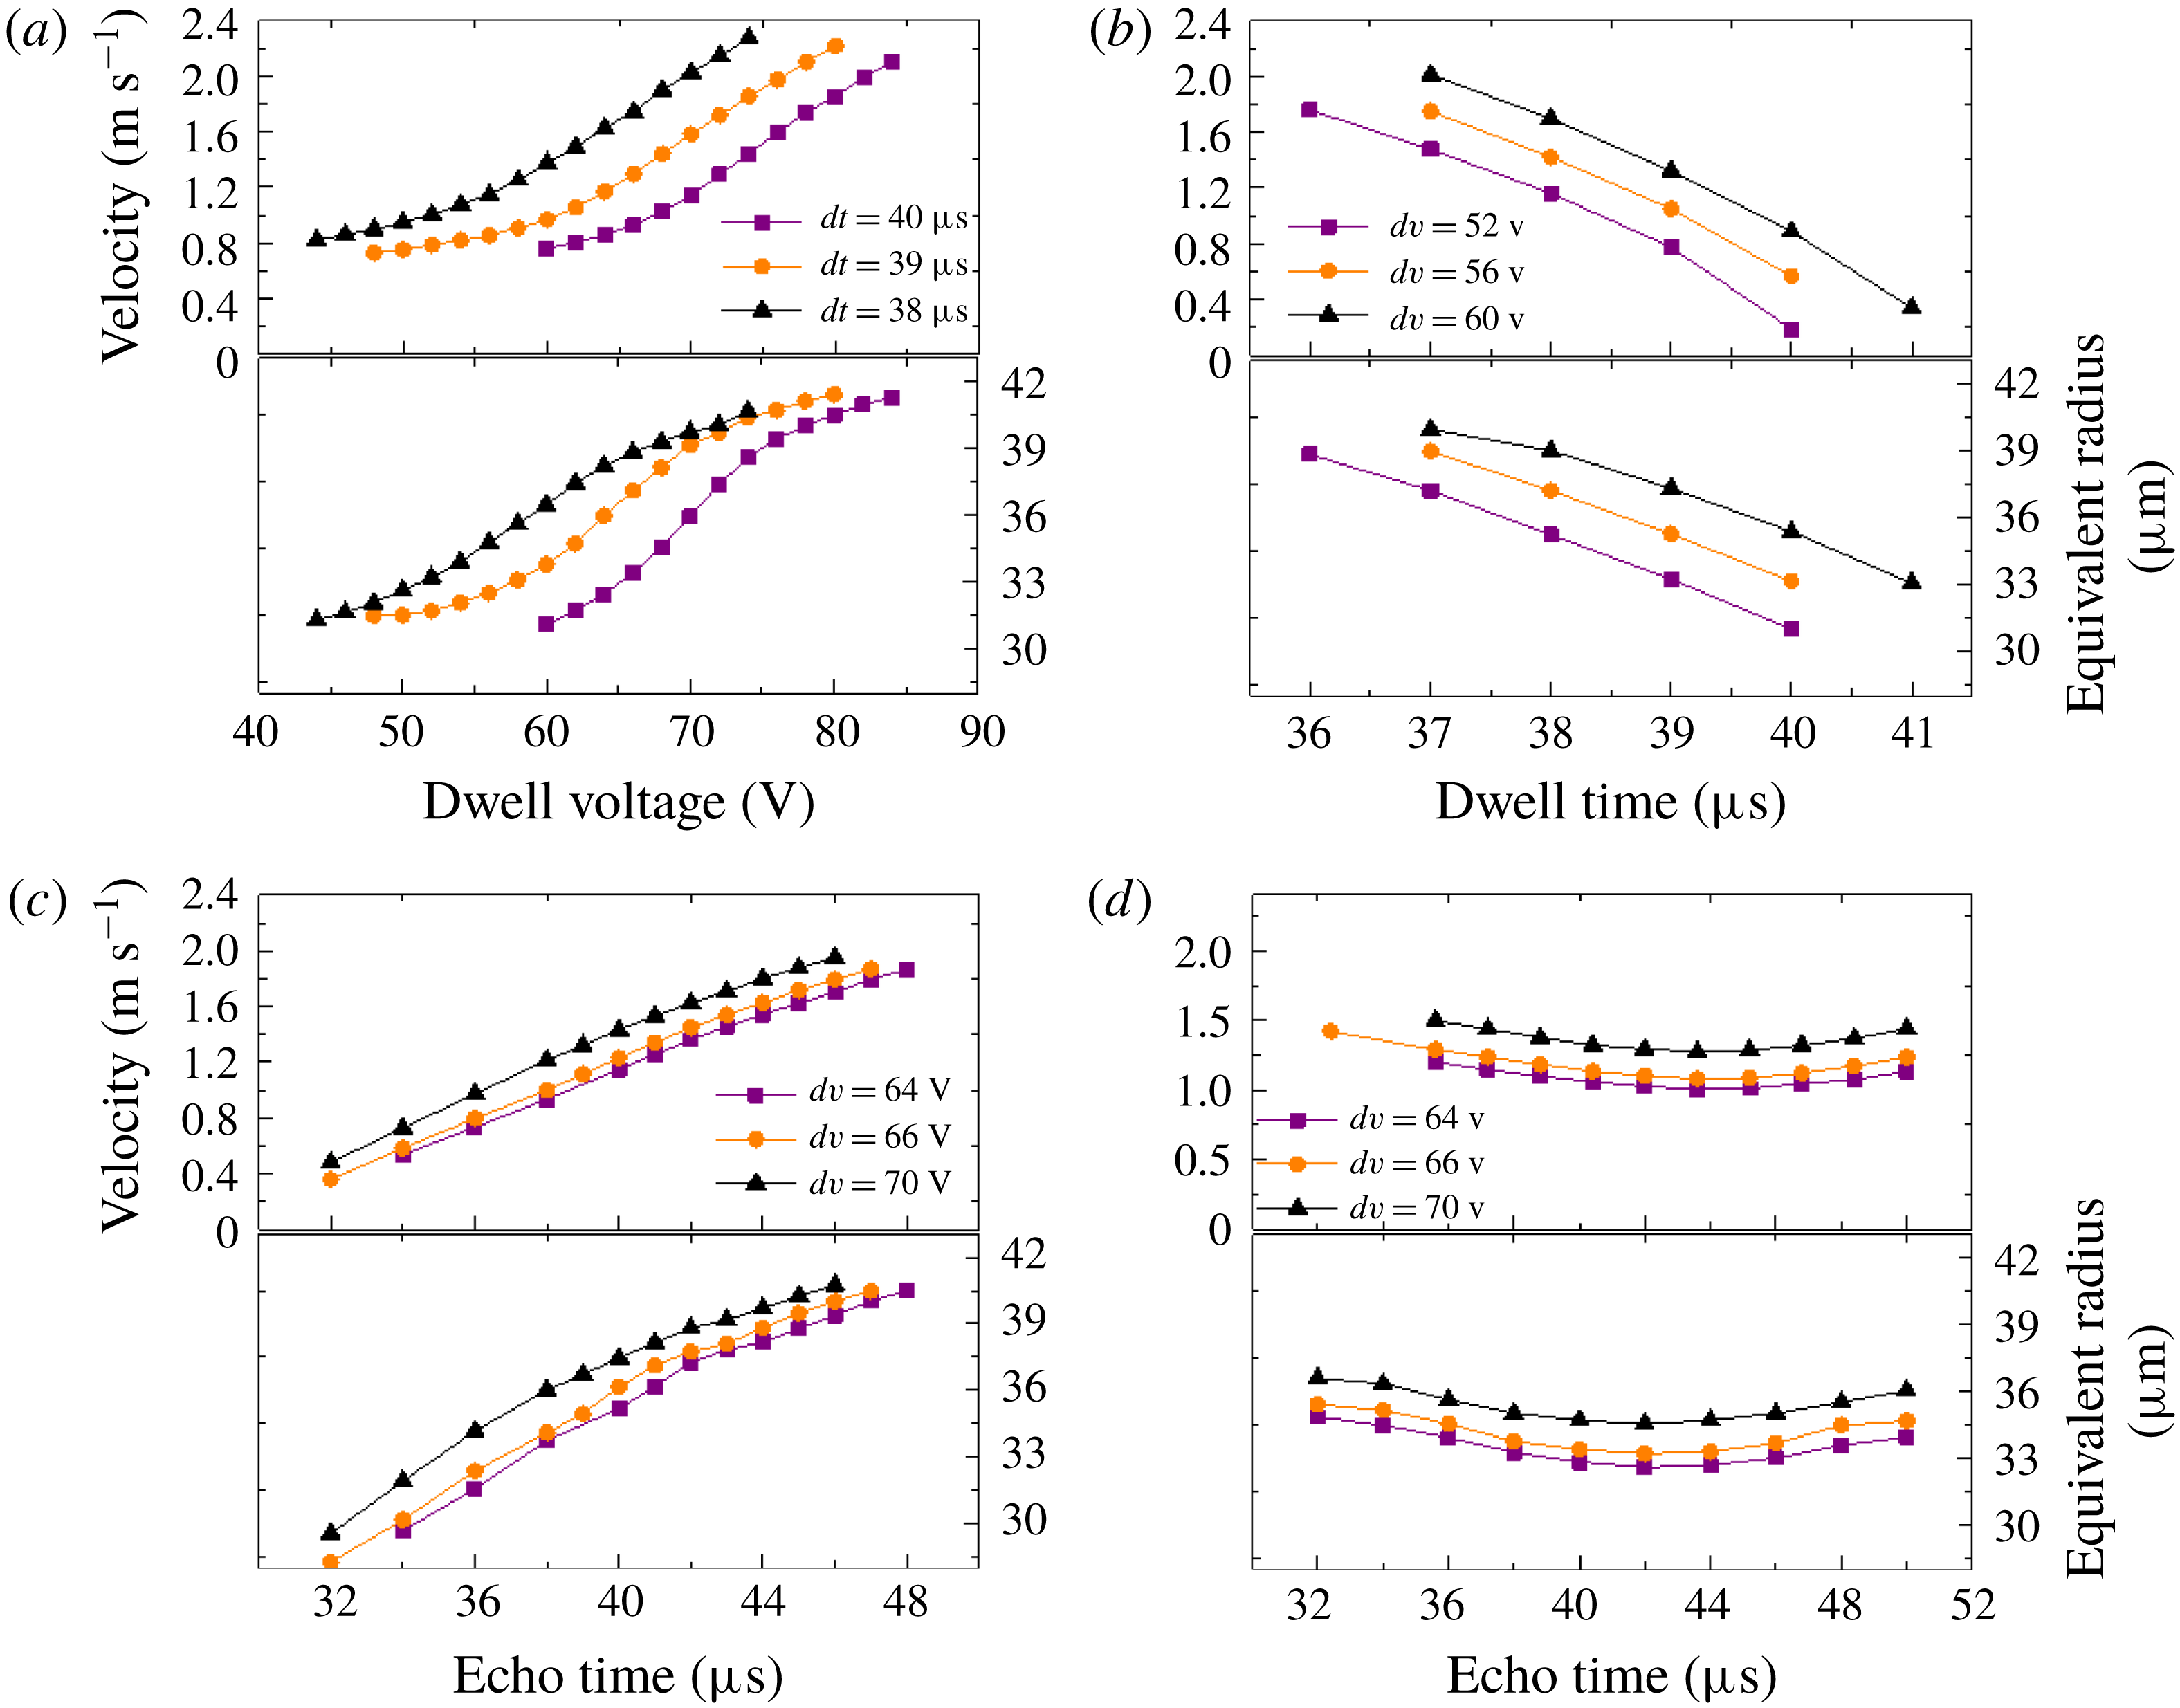
are influenced by the operating parameters and the fluid properties. The drop average velocity is the velocity at the droplet centre of mass, and the equivalent radius is defined as the radius of a virtual spherical droplet with the same volume. As shown in figure 3(a), the velocity and equivalent radius can be adjusted smoothly and finely by changing the dwell voltage. Other parameters are fixed to
 $dt=38~\unicode[STIX]{x03BC}\text{s}$
,
 $ev=40~\text{V}$
and
 $et=40~\unicode[STIX]{x03BC}\text{s}$
. Parameters not specified in the figures below are selected according to these values. Three groups of experiments with varying dwell times were undertaken, and the result indicates a same trend. When a higher dwell voltage is applied, the speed rises almost linearly when the velocity is above
 $1.2~\text{m}~\text{s}^{-1}$
. The equivalent radius of the drop also increases with the rising dwell voltage. Its growth rate first increases and then decreases. The effects of the dwell time is illustrated in figure 3(b). It can be observed that the velocity and volume of the droplets can be largely reduced as the dwell time rises. By raising the echo voltage one can accelerate the drop and increase its volume as well, illustrated in figure 3(c). The underlying mechanism is the same as that of the dwell voltage because a rise of either the dwell voltage or the echo voltage can magnify the deformation of piezoelectric tube, thus enlarging the driving pressure that pushed the liquid out of the nozzle. The influence of the echo time is relatively slight compared with that of the other three parameters. The speed and equivalent radius of the ejected droplets first decline, and then go up by increasing the echo time.
Velocity and equivalent radius as a function of (a) the dwell voltage, (b) the dwell time, (c) the echo voltage and (d) the echo time.

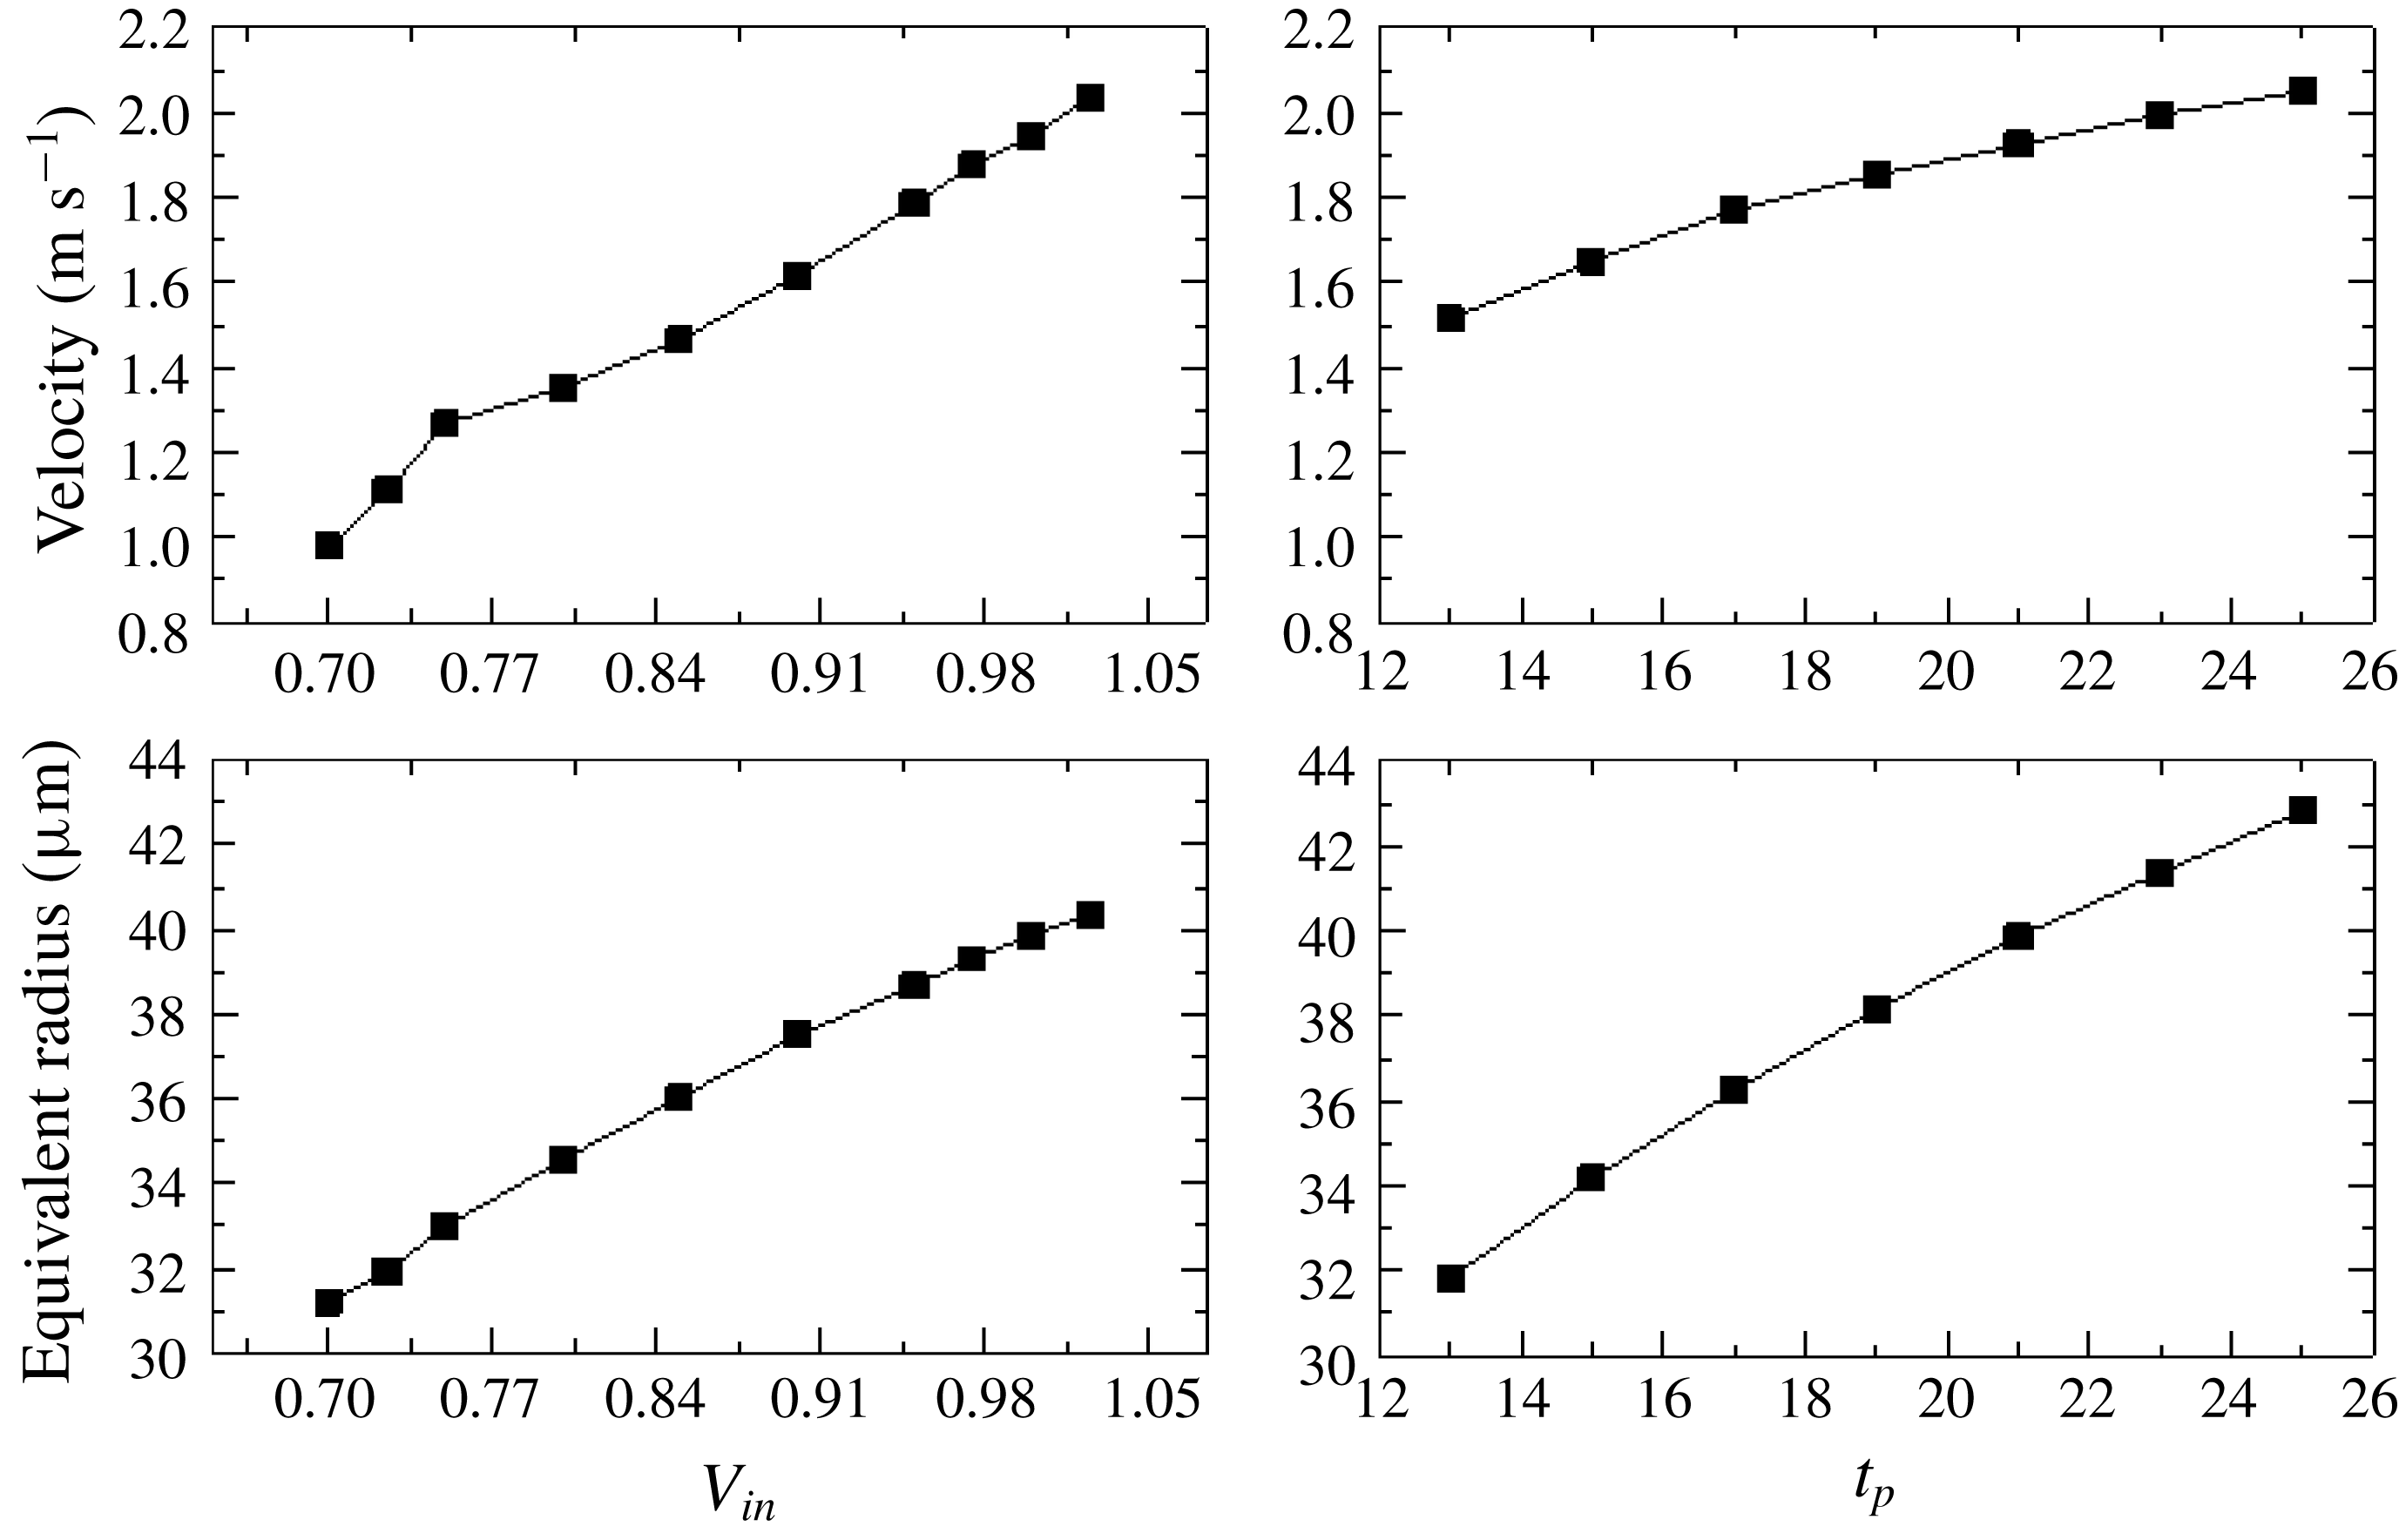
Influence of
 $V_{in}$
and
 $t_{p}$
.

To explain these trends we can attribute the resulting speed and radius to two parameters in the simulation: the inlet velocity
 $V_{in}$
and the push-out time
 $t_{p}$
, as shown in figure 4. Rise of the dwell voltage and the echo voltage both raise the amplitude of pressure thus increasing the speed and volume of the droplets. As for the effect of dwell time, it is a more complicated problem because it affects two parameters. When the dwell time rises, the width of the actual wave expands (equivalent to an increase of
 $t_{p}$
in simulation) while its amplitude descends (equivalent to a decrease of
 $V_{in}$
in simulation). A larger
 $t_{p}$
will generate droplets with higher velocity and bigger size while a smaller
 $V_{in}$
will form droplets with lower velocity and smaller size. As a result, the droplet velocity and size are determined by a combination of these two factors. A comparison of experimental and simulated results reveals that between these two factors the reduction of
 $V_{in}$
plays the overriding role since the speed and equivalent radius of the drop almost diminish linearly as the dwell voltage increases. Similarly, the influence of the echo time is the co-effect of the pull-back amplitude and the time determined by the reflected negative wave initiated by contraction (figure 1(b) C–D) and the negative pressure produced by the restoration of the cavity (figure 1(b) E–F).
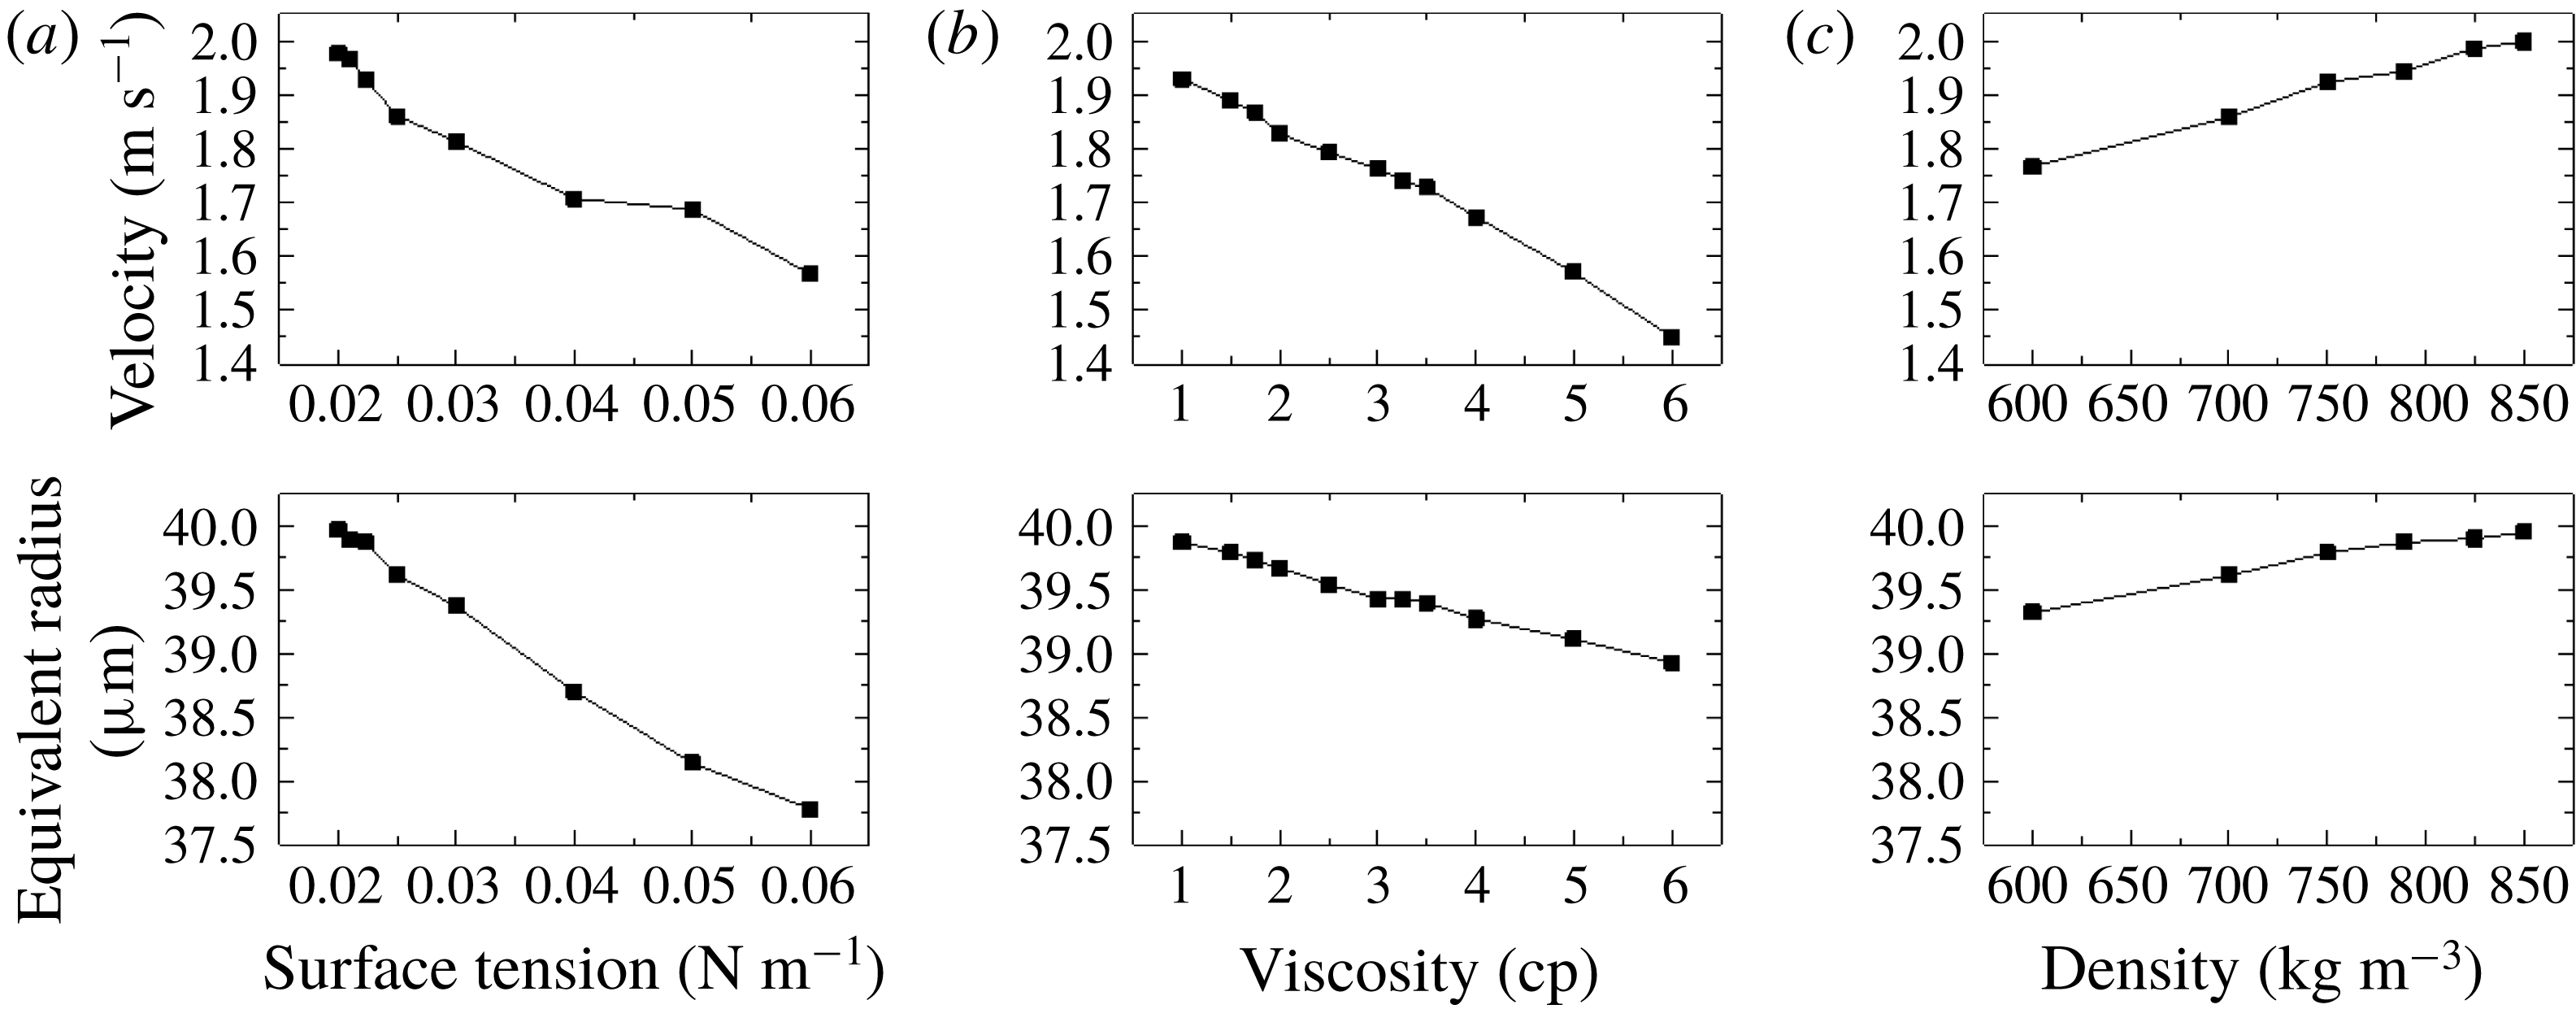
Influence of (a) surface tension, (b) viscosity and (c) density on drop velocity and radius.

The influences of fluid properties, that is, surface tension, viscosity and density, are simulated and illustrated in figure 5. The default liquid is ethanol with properties of
 $\unicode[STIX]{x1D70E}=0.02232~\text{N}~\text{m}^{-1}$
,
 $\unicode[STIX]{x1D707}=1~\text{cp}$
and
 $\unicode[STIX]{x1D70C}=789~\text{kg}~\text{m}^{-3}$
. Larger surface tension coefficient and viscosity cause a larger surface tension force to overcome and a greater viscosity loss at the nozzle. Thus, with the same driving force (
 $V_{in}=1~\text{m}~\text{s}^{-1}$
) and time (
 $t_{p}=21~\unicode[STIX]{x03BC}\text{s}$
), the velocity and equivalent radius of the produced droplets decrease as surface tension and viscosity increase. Density has a relatively weak influence on the volume of droplets.
4.2 Oscillation of the droplets
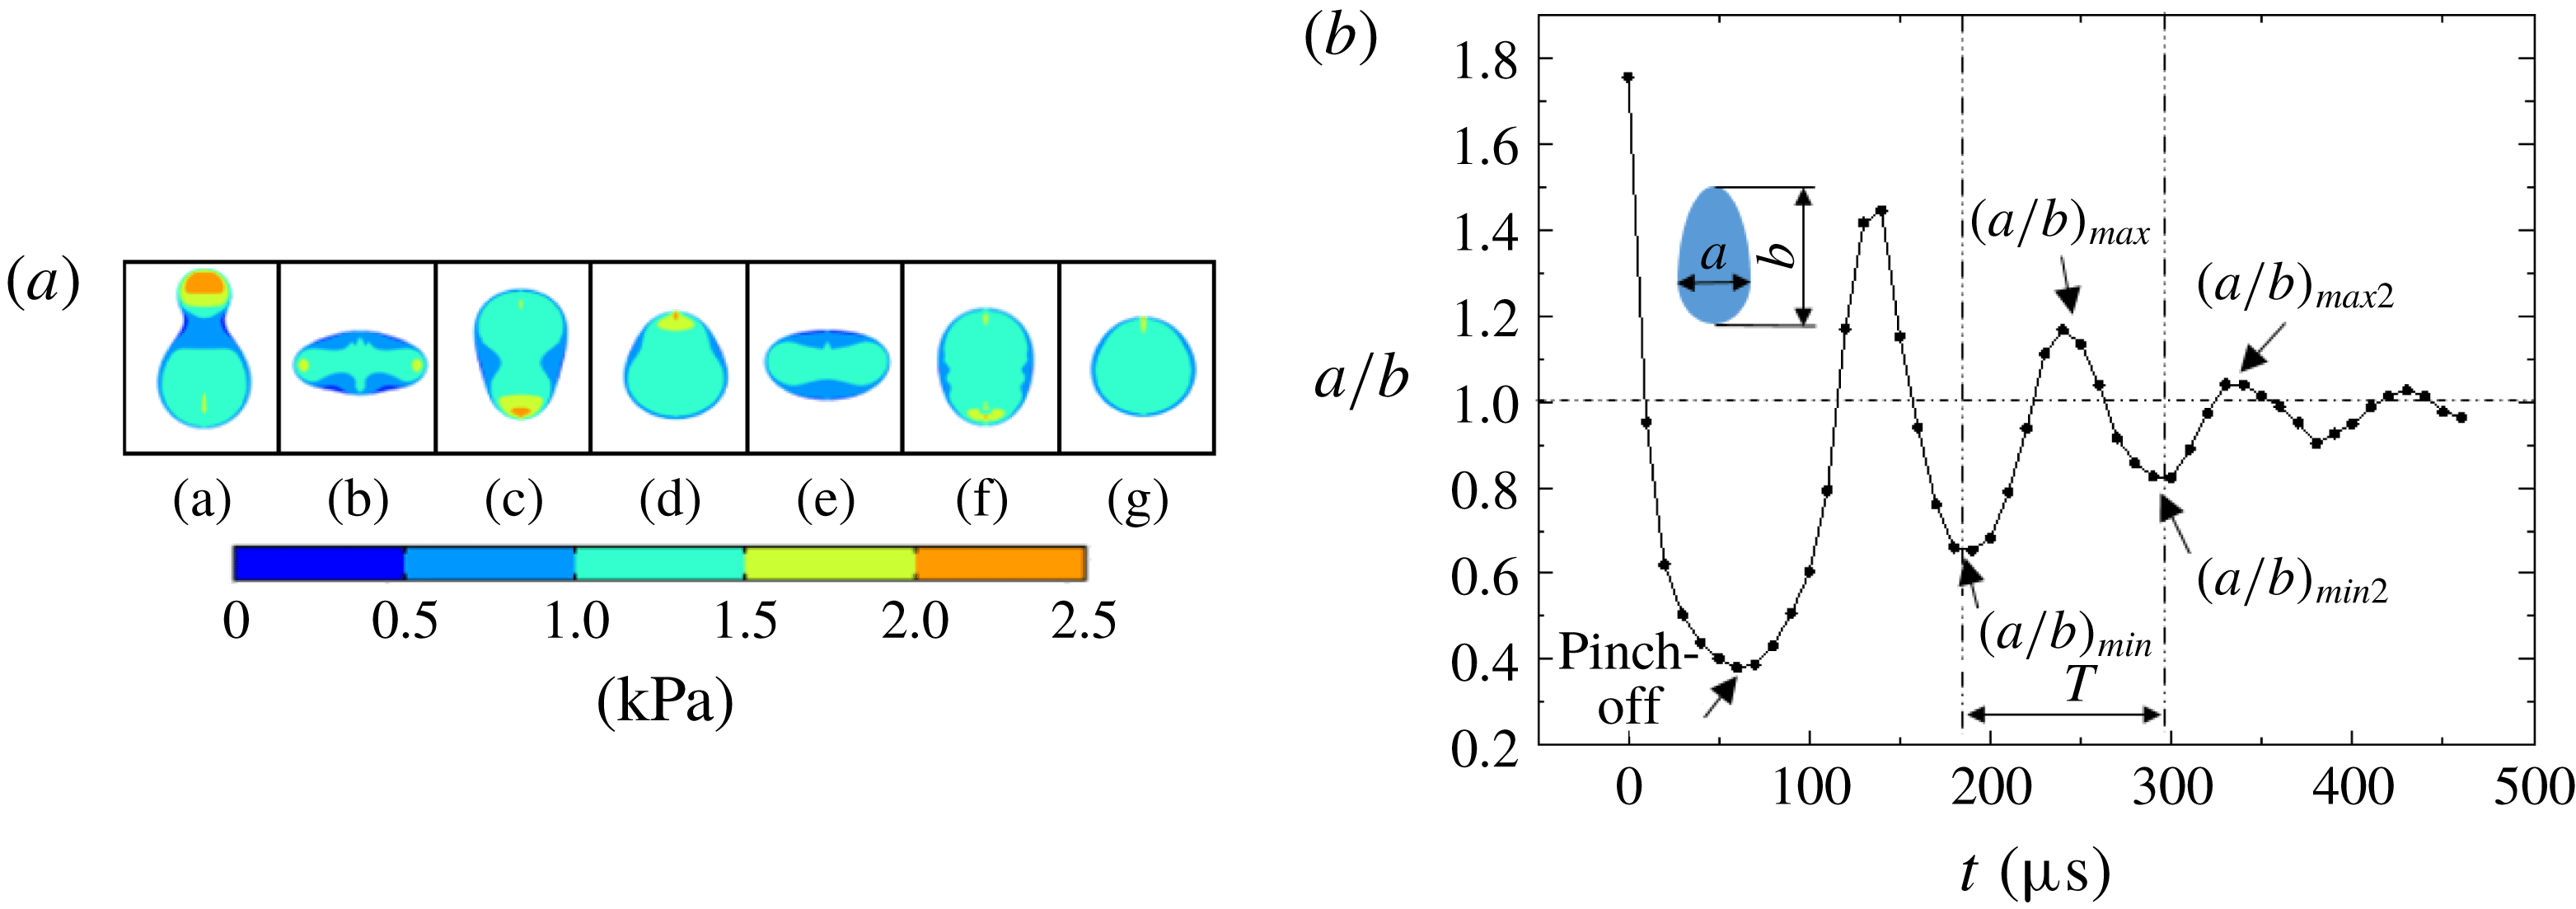
Figure 6(a) illustrates a typical sequence of surface profiles and pressure distribution inside the droplet. According to the Young–Laplace equation, an uneven distributed pressure resulting from different curvatures of the surface accelerates or decelerates parts of the droplets, leading to similar circles of deformation. Figure 6(b) shows the oscillation of droplets in the air after they are ejected from the nozzle. The deformation is characterized by two parameters: the ratio of the width of the droplet to its length
 $(a/b)$
, and the oscillation period between two analogous forms of the drop (
 $T$
). The length of droplet before the pinch-off is defined as the position of nozzle outlet minus the position of the droplet bottom. At
 $t_{0}$
the droplet transforms to an elongated ellipse with a minimum
 $(a/b)$
for the first time, and the oscillation circle begins. We regard this point as
 $(a/b)_{min}$
. After a half-period of time,
 $(a/b)$
reaches its local maximum marked the
 $(a/b)_{max}$
point. Then, at
 $t_{0}+T$
,
 $(a/b)$
reaches again a local minimum defined as
 $(a/b)_{min2}$
. We define other local maxima and minima points in this way.
(a) Pressure distribution of the falling droplet, and (b) deformation of the droplet in the air under conditions of
 $dv=52~\text{V}$
,
 $dt=38~\unicode[STIX]{x03BC}\text{s}$
,
 $ev=42~\text{V}$
and
 $et=40~\unicode[STIX]{x03BC}\text{s}$
.

Here we mainly focus on the investigation of the parameters
 $(a/b)_{max}$
,
 $(a/b)_{min}$
and
 $T$
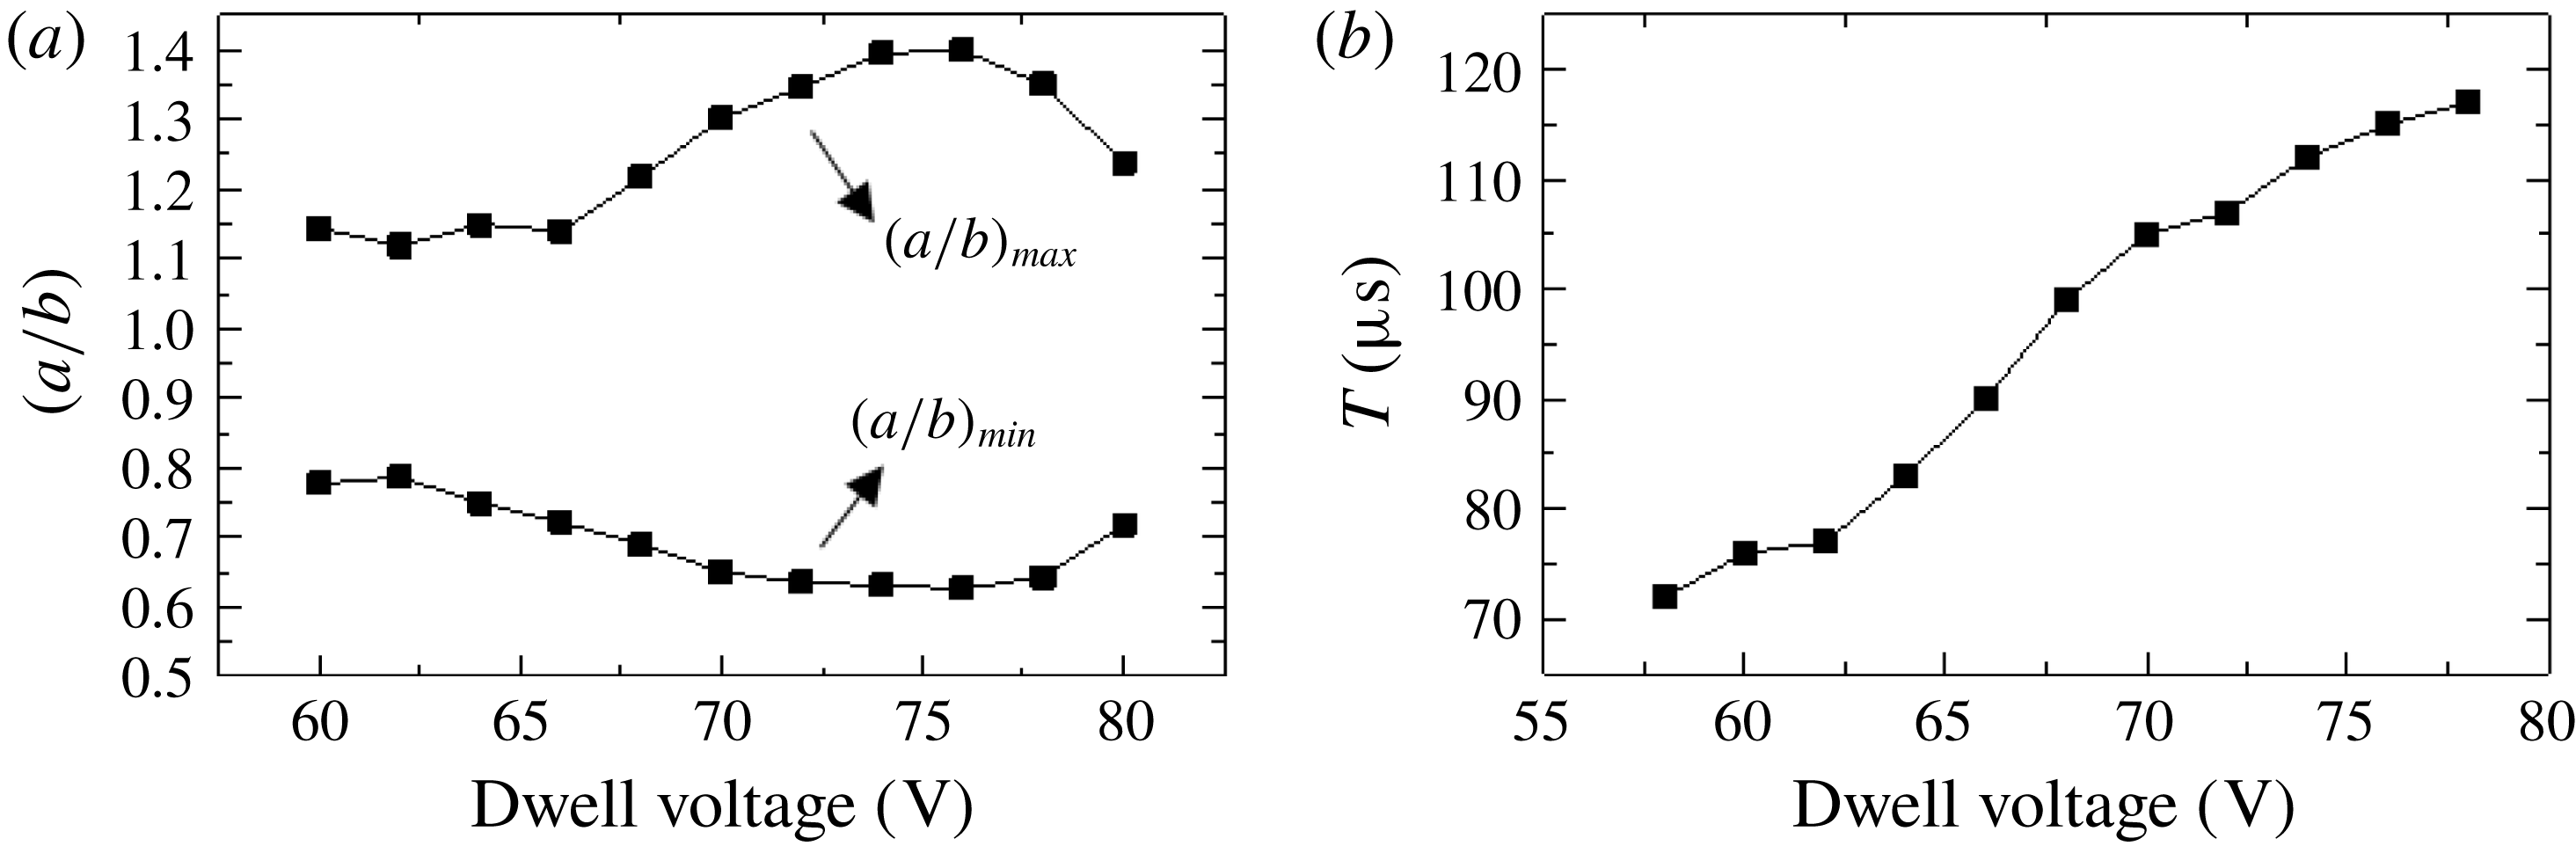
. From figure 7 it is noted that
 $(a/b)_{max}$
first increases and then decreases as the dwell voltage gets larger, while
 $(a/b)_{min}$
undergoes the opposite trend with
 $(a/b)_{max}$
. The existence of the transition points may result from the relative changes of the inside and outside flow influenced by both the droplet mass and the droplet velocity. For convenience we use
 $\unicode[STIX]{x1D700}=(a/b)_{max}-1$
to represent the maximum deformation extent of a droplet. Then we can see that the droplet deformation extent has a maximum value of approximately 0.4 for a dwell voltage of 75 V at the specific working conditions of
 $dt=39~\unicode[STIX]{x03BC}\text{s}$
,
 $ev=40~\text{V}$
and
 $et=40~\unicode[STIX]{x03BC}\text{s}$
. From the experiment we find that the oscillation is almost cyclic, and thus we use the time interval between
 $(a/b)_{min}$
and
 $(a/b)_{min2}$
as the deformation cycle. From figure 7 we can see that when the dwell voltage is set to higher values, the deformation cycle will be extended accordingly.
Influence of dwell voltage (a) on the ratio
 $a/b$
, and (b) on the deformation cycle
 $T$
.

Deformation extent
 $\unicode[STIX]{x1D700}$
versus
 $Ca$
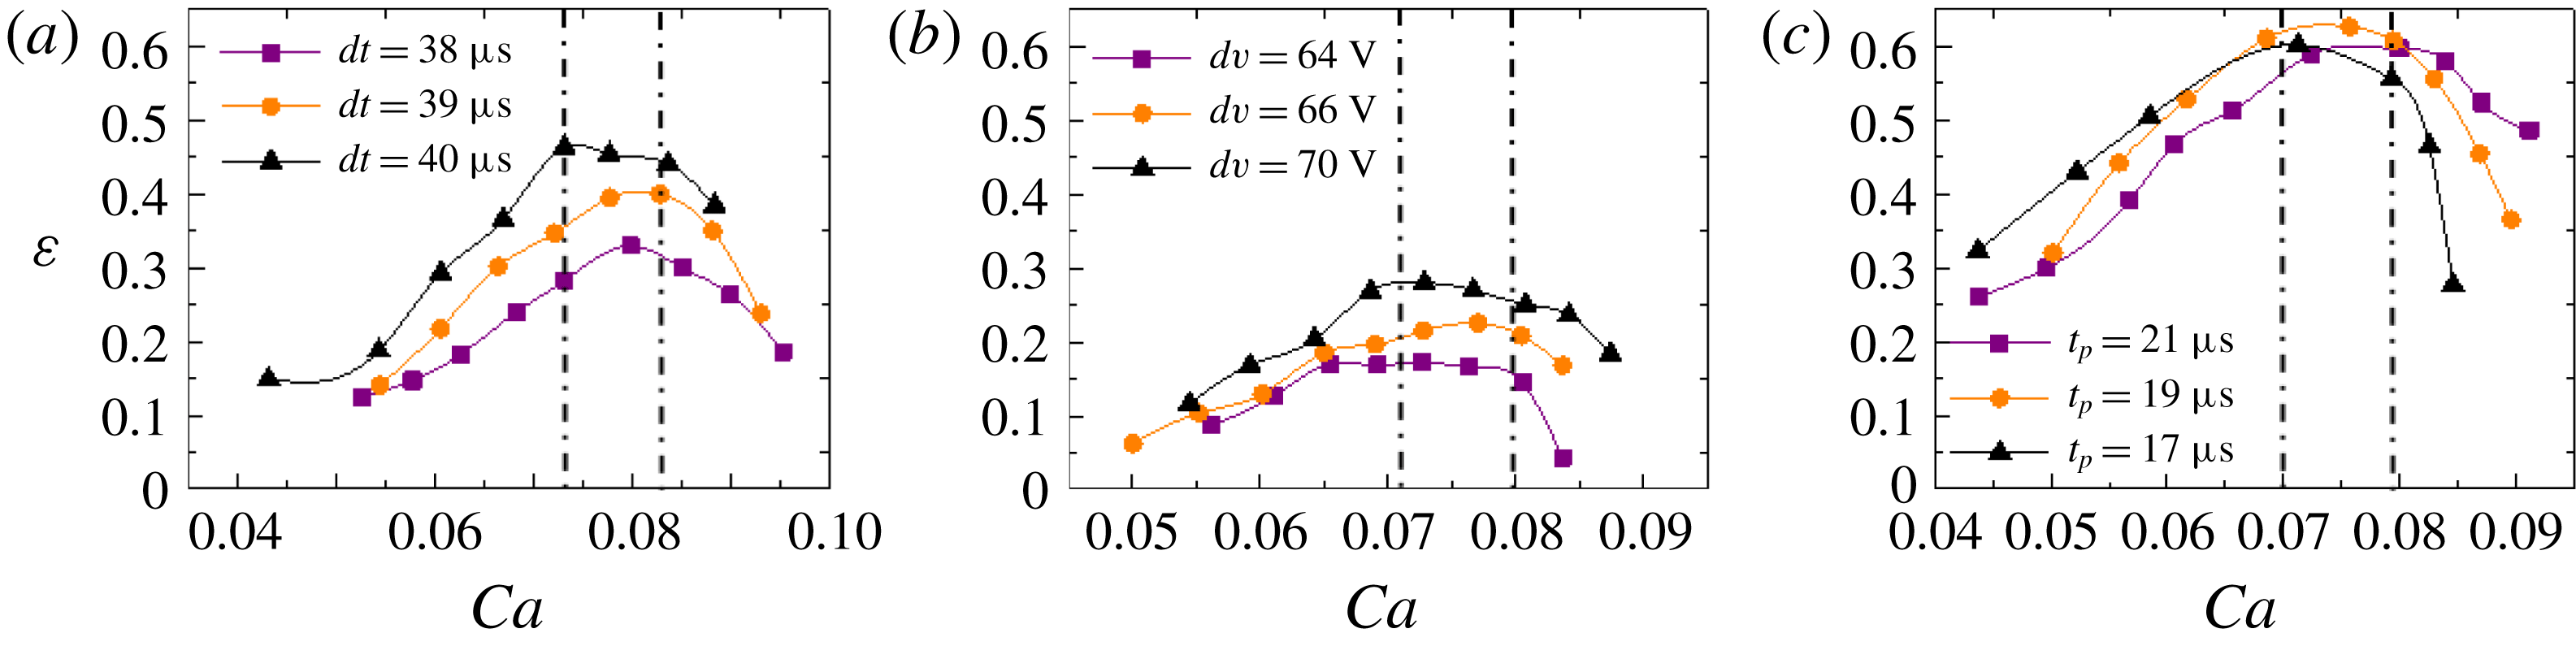
(a) by varying the dwell voltage at three different dwell times, (b) by varying the echo voltage at three different dwell voltages and (c) by varying the inlet velocity at three different push-out times.

The deformation extent of the droplets is mainly affected by two liquid properties: viscosity and surface tension. Therefore, we may intuitively relate
 $\unicode[STIX]{x1D700}$
with the capillary number
 $Ca$
, which describes the relative effect of viscous drag force and surface tension force,
 $$\begin{eqnarray}\displaystyle Ca=\frac{v\unicode[STIX]{x1D707}}{\unicode[STIX]{x1D70E}}. & & \displaystyle\end{eqnarray}$$
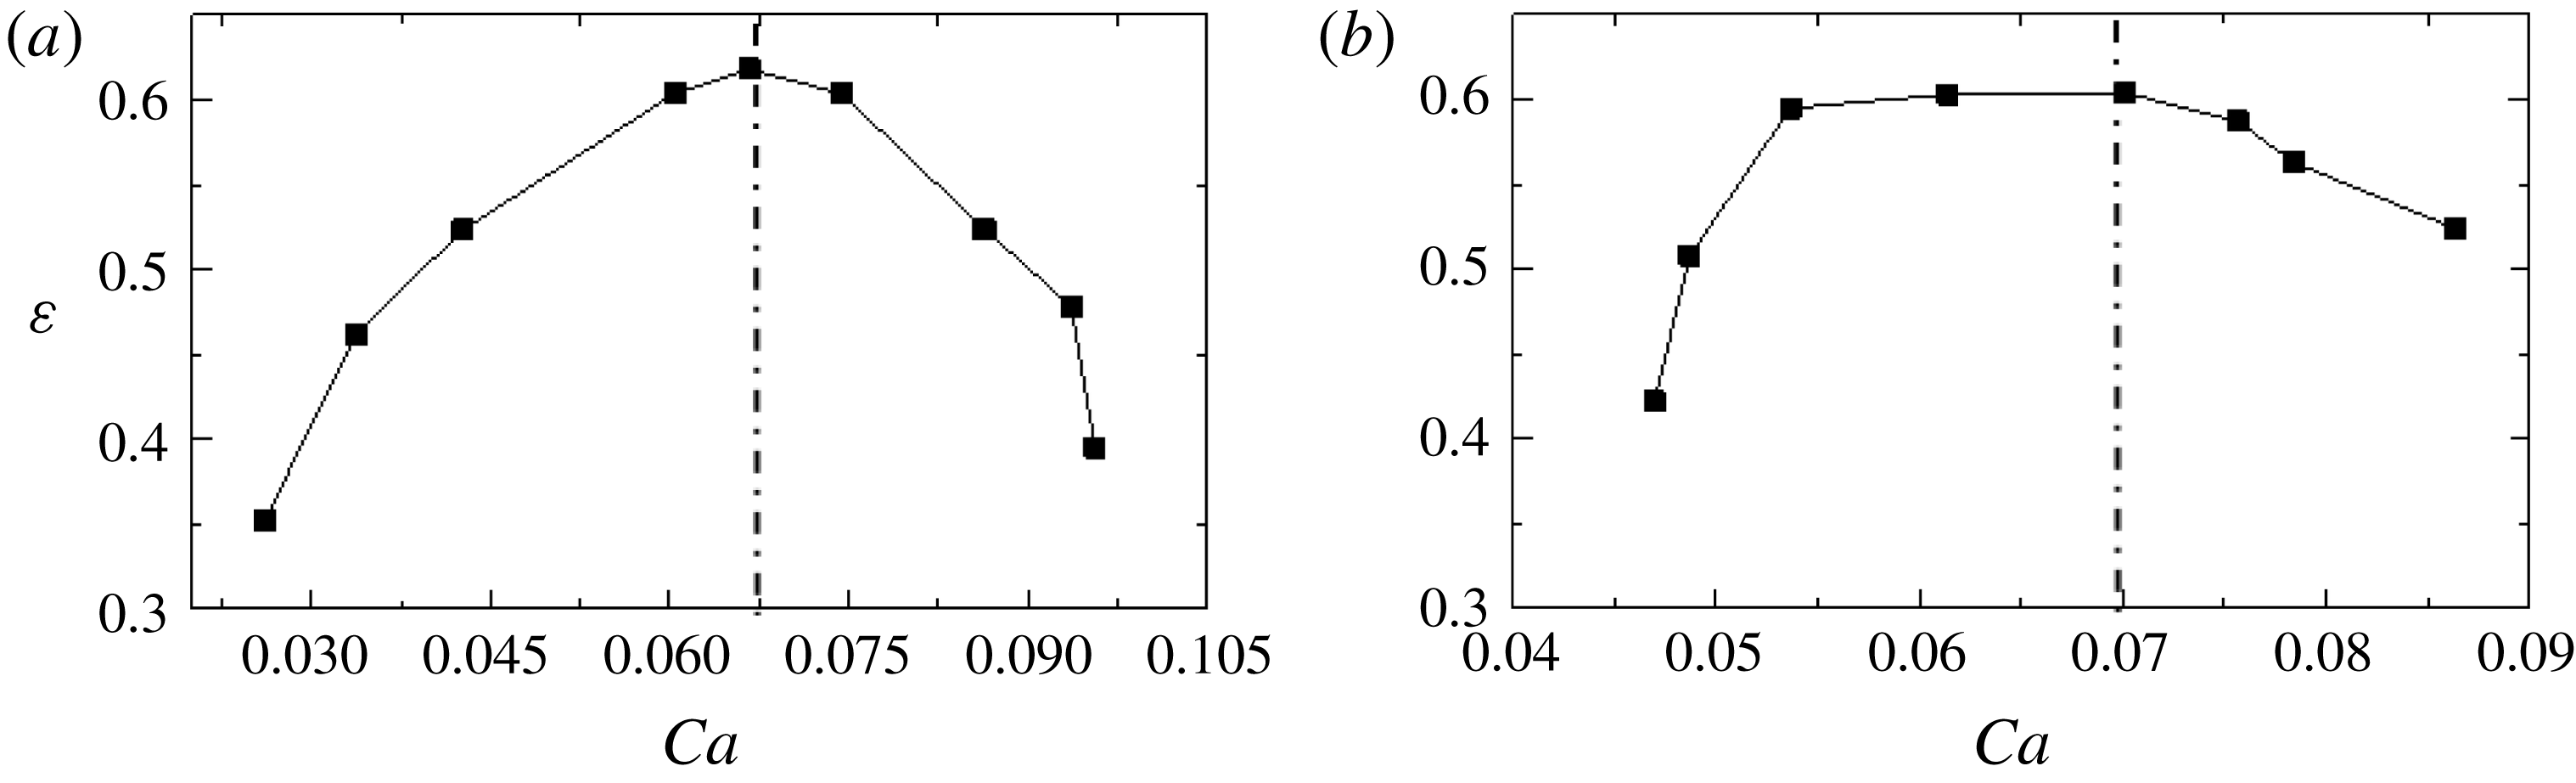
By manipulating operating parameters, we change the velocity of the droplet. As the velocity increases, the capillary number increases accordingly. What is interesting about the oscillation is that the deformation extent does not go through a monotonic increase with
 $Ca$
but has a maximum value within the range of 0.07–0.082, as shown in figure 8. Moreover, at different dwell times or dwell voltages, the deformation extent has different values even
 $Ca$
is the same. This phenomenon illustrates the limitations of using the conventional criteria for determining the drop oscillation process as it is also influenced by the operating conditions, which has a great impact on the ejection period and the initial disturbance of the droplets.
Deformation
 $\unicode[STIX]{x1D700}$
versus
 $Ca$
by varying (a) surface tension, and (b) viscosity.

Frequency as a function of
 $\sqrt{\unicode[STIX]{x1D70E}/\unicode[STIX]{x1D70C}r^{3}}$
.

In the numerical simulation we change
 $Ca$
by varying the inlet velocity and the push-out time shown in figure 8(c). As a consequence, the velocity of the ejected droplet will change accordingly, and this range corresponds with the results from experiments. Afterwards, by varying the liquid properties while keeping the driving pulse constant, it is found that as
 $Ca$
increases the deformation extent represents the same trend, and reaches its maximum for
 $Ca$
at approximately 0.068, slightly less than the lower limit of
 $Ca$
in figure 8. In order to obtain the droplet deformation curves with a largest value, the ranges of the properties (figure 9
a,b) are set to
 $0.02{-}0.06~\text{N}~\text{m}^{-1}$
for surface tension and 0.5–1 cp for viscosity. From the discussion above, we find that there is a critical
 $Ca$
where the deformation extent reaches the maximum value under the same operating parameters. The critical
 $Ca$
falls within the range of 0.068–0.082.
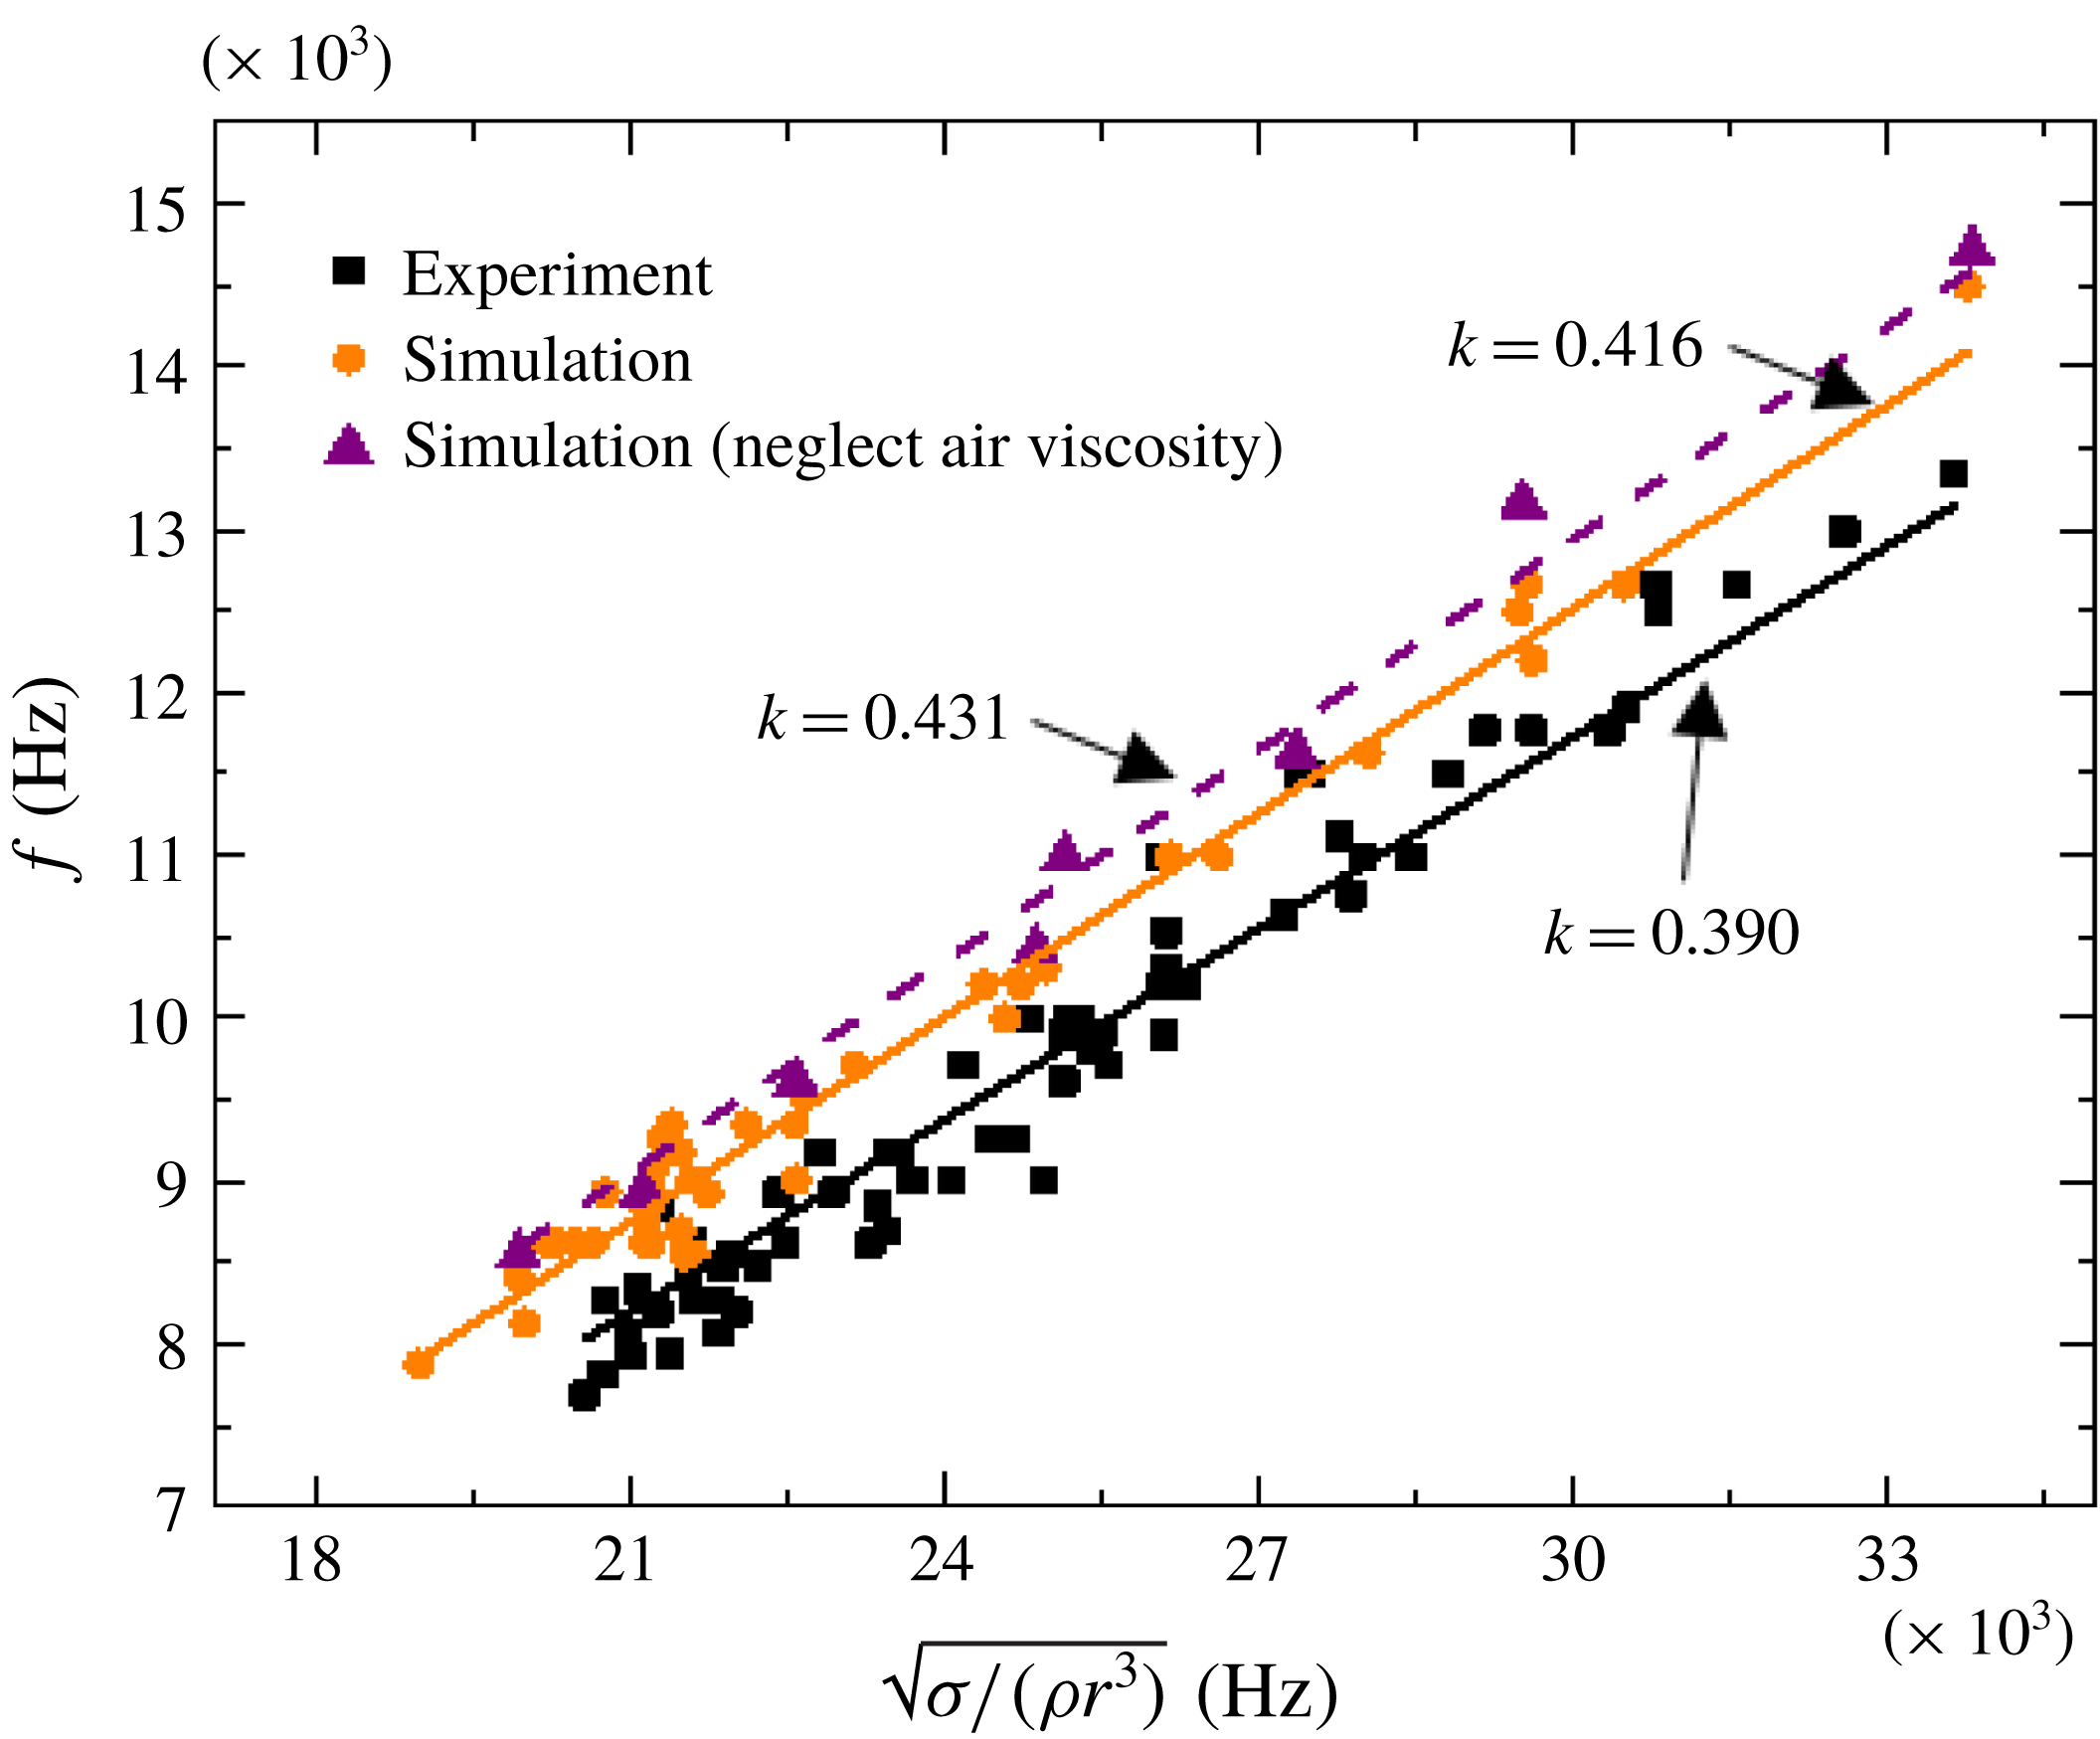
Through dimensional analysis we determine the oscillation frequency
 $f$
, the reciprocal of deformation cycle, has a linear correlation with
 $\sqrt{\unicode[STIX]{x1D70E}/\unicode[STIX]{x1D70C}r^{3}}$
,
 $$\begin{eqnarray}\displaystyle f=k\sqrt{\unicode[STIX]{x1D70E}/\unicode[STIX]{x1D70C}r^{3}}. & & \displaystyle\end{eqnarray}$$
From figure 10, it is seen that all the data points collapse onto the straight lines. The slopes of the lines
 $k$
are 0.416 and 0.390 respectively for simulation and experiment, both of which are smaller than Rayleigh’s (Rayleigh Reference Rayleigh1879) mathematical prediction
 $\sqrt{2}/\unicode[STIX]{x03C0}$
. When applying investigations of incompressible inviscid fluid under the action of surface tension, Rayleigh only considered infinitely small-amplitude perturbations, and implied that the oscillation grows in amplitude along the jet including the vicinity of the nozzle. The difference between our results and Rayleigh’s ideal results from air viscosity, fluid viscosity and the intrinsic nature of perturbations. Therefore, when the air viscosity is neglected by setting the viscosity of air as
 $1\times 10^{-5}$
cp, the oscillation frequency rises, and the corresponding slope increases to 0.431.
5 Conclusions
Drop-on-demand inkjet technology has been of great scientific interest, and has been used in areas of conventional printing, mechanical engineering, electronics and biochemistry. Given the crucial role of the droplet velocity, the droplet diameter and the droplet oscillation in precise deposition control, all of them are investigated with single droplets. They have been investigated by means of numerical modelling and experimental measurements. The influences of driving parameters including the dwell voltage (
 $dv$
), the dwell time (
 $dt$
), the echo voltage (
 $ev$
) and the echo time (
 $et$
) as well as the ink properties including density, viscosity and surface tension are presented. Results show that the rise of the dwell voltage and the echo voltage can effectively increase the velocity and radius of the droplets, and that the dwell time and the echo time have complex impacts on droplet motion due to the complexity of pressure wave propagation within the ink channel. A larger surface tension and viscosity or a lower density value can considerably reduce the velocity of the droplets, whereas the surface tension is a major factor affecting the droplet volume. Through analysing the deformation extent and deformation cycle during the process of droplet oscillation, it is found that deformation is inherently driven by the shift of pressure distribution inside the droplet. As the driving parameters increase, the deformation extent first increases then decreases. As for fluid properties, viscosity influences the deformation extent, and surface tension influences the deformation cycle significantly. The capillary number (
 $Ca$
) is found to be related to the deformation extent, which reaches its maximum value when
 $Ca$
locates within the range of 0.068–0.082. Additionally, the oscillation frequency of the ejected droplet is found to be linearly related to
 $\sqrt{\unicode[STIX]{x1D70E}/\unicode[STIX]{x1D70C}r^{3}}$
with a coefficient of approximate 0.4, which is lower than Rayleigh’s mathematical prediction, in which infinitely small-amplitude perturbations were assumed.
Acknowledgements
This work is supported by the grants from National Natural Science Foundation of China (no. 51876071). S. Wang and Y. Zhong made an equal contribution to this work.