1 Introduction
One important feature of turbulent boundary layers (TBLs) subjected to adverse pressure gradients (APGs) is the increase in the energy of the outer large scales compared to zero pressure gradient (ZPG) TBLs: i.e. a strong secondary peak appears in the pre-multiplied energy spectra of the streamwise velocity fluctuations (Harun et al.
Reference Harun, Monty, Mathis and Marusic2013; Lee Reference Lee2017). Large-scale motions (LSMs) scaled with the outer length scale
 $\unicode[STIX]{x1D6FF}$
, where
 $\unicode[STIX]{x1D6FF}$
is the 99 % boundary layer thickness, the channel half-height or the pipe radius, play an important role in the production of the turbulent kinetic energy and the transport of momentum; they carry approximately one half of the turbulent kinetic energy and the Reynolds shear stress in the turbulent pipe flows (Guala, Hommema & Adrian Reference Guala, Hommema and Adrian2006) and in the turbulent channel flows and ZPG TBLs (Balakumar & Adrian Reference Balakumar and Adrian2007). In addition, the LSMs in the outer region are extended to the near-wall region as footprints (Hoyas & Jiménez Reference Hoyas and Jiménez2006; Hutchins & Marusic Reference Hutchins and Marusic2007a
). Hutchins & Marusic (Reference Hutchins and Marusic2007b
) observed that the amplitudes of the three velocity fluctuations and the Reynolds shear stress are attenuated under negative
 $u_{L}$
, where
 $u_{L}$
is the large-scale streamwise velocity fluctuation. To quantify the influence of such amplitude modulation (AM), Mathis, Hutchins & Marusic (Reference Mathis, Hutchins and Marusic2009) introduced the AM coefficient, which is the correlation between
 $u_{L}$
and the filtered envelope of small-scale streamwise velocity fluctuations. The superposition and AM effects of large scales are utilized to predict near-wall turbulence using a mathematical model (Marusic, Mathis & Hutchins Reference Marusic, Mathis and Hutchins2010). Mathis, Hutchins & Marusic (Reference Mathis, Hutchins and Marusic2011) applied the predictive model of Marusic et al. (Reference Marusic, Mathis and Hutchins2010) to wall-bounded turbulent flows including the APG TBLs. Although extensive research has been carried out on the contribution of the LSMs to the turbulent statistics in TBLs, little attention has been paid to the understanding of the large-scale influence on APG TBLs.
The presence of the APG in TBLs results in an increase in large-scale activity, especially in the outer region (Harun et al.
Reference Harun, Monty, Mathis and Marusic2013). Instantaneous flow fields in APG TBLs show that the negative-
 $u$
structures in the outer region are wider in the spanwise direction than those in ZPG TBLs (Lee & Sung Reference Lee and Sung2009; Lee Reference Lee2017), related to the enhanced contribution of large scales to the turbulence statistics in APG TBLs (Harun et al.
Reference Harun, Monty, Mathis and Marusic2013). Recently, Kitsios et al. (Reference Kitsios, Sekimoto, Atkinson, Sillero, Borrell, Gungor, Jiménez and Soria2017) performed direct numerical simulations (DNSs) of the APG TBLs with
 $\unicode[STIX]{x1D6FD}=1$
and 39, and showed that the vortical structures are more pronounced along the wall-normal direction with higher intensity than those in the ZPG TBL. Here,
 $\unicode[STIX]{x1D6FD}$
is the non-dimensional pressure gradient parameter defined as
 $\unicode[STIX]{x1D6FF}^{\ast }\unicode[STIX]{x1D70F}_{w}^{-1}\,\text{d}p/\text{d}x$
, where
 $\unicode[STIX]{x1D6FF}^{\ast }$
and
 $\unicode[STIX]{x1D70F}_{w}$
are the displacement thickness and the wall shear stress, respectively. As the magnitude of the APG becomes stronger, outer peaks emerge in the turbulence intensities and the Reynolds shear stress, and the values of outer peaks increase. In particular, the outer peak in the streamwise intensity of strong APG TBLs with over
 $\unicode[STIX]{x1D6FD}\approx 4.74$
is higher than the inner peak (Monty, Harun & Marusic Reference Monty, Harun and Marusic2011; Gungor et al.
Reference Gungor, Maciel, Simens and Soria2016; Kitsios et al.
Reference Kitsios, Sekimoto, Atkinson, Sillero, Borrell, Gungor, Jiménez and Soria2017; Lee Reference Lee2017). The pre-multiplied energy spectra of
 $u$
in APG TBLs show that the increase in the outer peak value is due to the enhancement of the large-scale energy in the outer region (Harun et al.
Reference Harun, Monty, Mathis and Marusic2013; Kitsios et al.
Reference Kitsios, Sekimoto, Atkinson, Sillero, Borrell, Gungor, Jiménez and Soria2017; Lee Reference Lee2017).
Hutchins & Marusic (Reference Hutchins and Marusic2007a
) showed that the large-scale energy of the pre-multiplied spectra of
 $u$
in the outer region increases with increasing Reynolds number and that the large-scale energy in the inner region is also enhanced owing to the superposition effects of the outer large scales as footprints in the ZPG TBLs. They observed that the filtered flow pattern in the near-wall region is visually similar to the long negative-
 $u$
region in the logarithmic region. In the APG TBLs (
 $\unicode[STIX]{x1D6FD}\leqslant 9$
), the long-wavelength energy near the wall in the uu energy spectra is also enhanced (Harun et al.
Reference Harun, Monty, Mathis and Marusic2013; Lee Reference Lee2017), indicating that the influence of the enhanced outer LSMs is significantly extended into the near-wall region. In the strong APG TBL (
 $\unicode[STIX]{x1D6FD}=39$
) of Kitsios et al. (Reference Kitsios, Sekimoto, Atkinson, Sillero, Borrell, Gungor, Jiménez and Soria2017), the uu energy near the wall decreases significantly with weakened footprints. Given that the footprints of large-scale negative-
 $u$
structures are narrower than those of the positive-
 $u$
structures, the influence of large-scale negative- and positive-
 $u$
structures in the outer region is asymmetric in the near-wall region (Hwang et al.
Reference Hwang, Lee, Sung and Zaki2016b
). The nature of this asymmetric influence is related to the near-wall spanwise motions of the large-scale circulations under the large-scale negative- and positive-
 $u$
structures, respectively (Hwang et al.
Reference Hwang, Lee, Sung and Zaki2016b
; Yoon et al.
Reference Yoon, Hwang, Lee, Sung and Kim2016b
). Lee et al. (Reference Lee, Lee, Lee and Sung2010) and Lee (Reference Lee2017) reported that the strength and size of the large-scale circulations in the APG TBLs are augmented by the ejection and sweep motions greater than those in the ZPG TBL.
In addition, enhanced large scales in APG TBLs modulate the amplitudes of fluctuating signals strongly. The AM coefficient of the streamwise velocity fluctuations in the APG TBL is larger than that in the ZPG TBL, and the wall-normal location of its zero crossing is farther from the wall compared to the ZPG TBL (Harun et al.
Reference Harun, Monty, Mathis and Marusic2013). The former indicates that the AM influence of
 $u_{L}$
on the small-scale streamwise velocity fluctuations is greater in the APG TBL, and the latter represents that the size of the roll-cell motions increases in the APG TBL. Ganapathisubramani et al. (Reference Ganapathisubramani, Hutchins, Monty, Chung and Marusic2012) statistically investigated the influence of the AM on small-scale streamwise velocity fluctuations as a function of
 $u_{L}$
in the ZPG TBL. By using the conditional sampling for
 $u_{L}$
, they showed that the amplitudes of the near-wall small scales are attenuated or amplified under the negative- or positive-
 $u_{L}$
events, respectively. Talluru et al. (Reference Talluru, Baidya, Hutchins and Marusic2014) reported that the amplitudes of the small scales of the cross-stream velocity fluctuations are modulated by
 $u_{L}$
in the ZPG TBLs. Since the near-wall vortical motions are associated with the small-scale velocity fluctuations, the vortical motions could be affected by the LSMs. Hwang & Sung (Reference Hwang and Sung2017) examined the AM behaviour of the streamwise and wall-normal swirling strengths with respect to the strength of
 $u_{L}$
and showed that the modulated velocity fields under the large-scale negative- and positive-
 $u$
structures directly contribute to the dependence of the swirling motions on the
 $u_{L}$
event. The near-wall vortical motions in the APG TBLs are steeper and stronger than those in the ZPG TBL (Lee & Sung Reference Lee and Sung2009). The spanwise vortical motions are densely aggregated in the wake region (Lee et al.
Reference Lee, Lee, Lee and Sung2010). As
 $\unicode[STIX]{x1D6FD}$
increases, the root-mean-square (r.m.s.) values of all vorticity fluctuations increase in the outer region (Lee & Sung Reference Lee and Sung2008). Although enhanced vortical motions in APG TBLs are observed, most studies of APG TBLs have not considered the influence of LSMs on the vortical motions.
The outer LSMs affect the near-wall turbulent structures as well as the skin friction. Abe, Kawamura & Choi (Reference Abe, Kawamura and Choi2004) observed in the turbulent channel flows that the large scales in the spanwise spectra of the wall shear-stress fluctuations are dominant, and these become prominent with increasing Reynolds number in the ZPG TBLs (Örlü & Schlatter Reference Örlü and Schlatter2011). Schlatter et al. (Reference Schlatter, Örlü, Li, Brethouwer, Fransson, Johansson, Alfredsson and Henningson2009) showed the secondary peak in the spanwise two-point correlation of the wall shear stress, implying that the LSMs play a significant role in the skin friction. Mathis et al. (Reference Mathis, Marusic, Chernyshenko and Hutchins2013) suggested a predictive model for the wall shear stress in the ZPG TBLs by employing the superposition and AM effects of large scales. Deck et al. (Reference Deck, Renard, Laraufie and Weiss2014) quantified the superposition effects of large scales on the skin friction by combining the streamwise co-spectra of the Reynolds shear stress in the ZPG TBLs. The LSMs contribute to approximately half of the total skin friction, and their contribution to the skin friction increases with an increase in the Reynolds number. Yoon et al. (Reference Yoon, Hwang, Lee, Sung and Kim2016b ) showed that the large scales including footprints occupy 45.4 % of the total skin friction, representing that the contribution of the large scales to the skin friction is dominant.
The vortical motions play a major role in the skin friction (Robinson Reference Robinson1991; Kravchenko, Choi & Moin Reference Kravchenko, Choi and Moin1993); streamwise vortices are one of main components in the self-sustaining process (Hamilton, Kim & Waleffe Reference Hamilton, Kim and Waleffe1995; Waleffe Reference Waleffe1997). Weakened near-wall streamwise vortices are generally observed in all drag-reduced flows irrespective of drag reduction methods (Kim Reference Kim2011), representing that the streamwise vortices near the wall are closely related to the skin friction. The velocity–vorticity correlations
 $\langle v\unicode[STIX]{x1D714}_{z}\rangle$
and
 $\langle -w\unicode[STIX]{x1D714}_{y}\rangle$
are connected to the streamwise vortical motions. Here, angled brackets indicate time-averaged quantities. The process of the spanwise vorticity lifting (negative
 $\langle v\unicode[STIX]{x1D714}_{z}\rangle :\,v>0,\unicode[STIX]{x1D714}_{z}<0$
) in the near-wall region leads to the formation of a pair of counter-rotating streamwise vortices (Kline et al.
Reference Kline, Reynolds, Schraub and Runstadler1967; Sheng, Malkiel & Katz Reference Sheng, Malkiel and Katz2009). In addition, positive
 $\langle -w\unicode[STIX]{x1D714}_{y}\rangle$
is associated with the stretching of hairpin vortex legs (i.e. the quasi-streamwise vortices (Adrian, Meinhart & Tomkins Reference Adrian, Meinhart and Tomkins2000)) evolving outwards from the wall (Eyink Reference Eyink2008; Chin et al.
Reference Chin, Philip, Klewicki, Ooi and Marusic2014). Yoon et al. (Reference Yoon, Ahn, Hwang and Sung2016a
) derived an expression for the skin friction coefficient (
 $C_{f}$
) that quantifies the contributions of
 $\langle v\unicode[STIX]{x1D714}_{z}\rangle$
and
 $\langle -w\unicode[STIX]{x1D714}_{y}\rangle$
to the local skin friction.
The objective of the present study is to explore the contribution of the LSMs to the skin friction with respect to the vortical motions in an APG TBL. Our approach relies on DNS data of a TBL subjected to a moderate APG (
 $\unicode[STIX]{x1D6FD}=1.45$
) at
 $Re_{\unicode[STIX]{x1D703}}=5400$
(
 $Re_{\unicode[STIX]{x1D70F}}$
 $=$
834). For comparison, a ZPG TBL was performed at
 $Re_{\unicode[STIX]{x1D70F}}=837$
. In order to examine the superposition and AM effects of the LSMs on the vortical motions, we present two approaches based on the skin friction decomposition method of Yoon et al. (Reference Yoon, Ahn, Hwang and Sung2016a
): (i) the contribution of large scales to the skin friction are quantified in the spanwise co-spectra of
 $\langle v\unicode[STIX]{x1D714}_{z}\rangle$
and
 $\langle -w\unicode[STIX]{x1D714}_{y}\rangle ;$
(ii) the modulated vortical motions and associated
 $C_{f}$
are conditionally averaged with respect to the strength
 $u_{L}$
. In § 3.2, we examine the enhanced contribution of large scales to
 $\langle uu\rangle$
and
 $\langle ww\rangle$
in the pre-multiplied spanwise energy spectra. The superposition effects of large scales on the skin friction induced by
 $\langle v\unicode[STIX]{x1D714}_{z}\rangle$
and
 $\langle -w\unicode[STIX]{x1D714}_{y}\rangle$
are examined by determining the spanwise co-spectra of
 $v$
and
 $\unicode[STIX]{x1D714}_{z}(\unicode[STIX]{x1D719}_{v\unicode[STIX]{x1D714}_{z}})$
and of –
 $w$
and
 $\unicode[STIX]{x1D714}_{y}(\unicode[STIX]{x1D719}_{-w\unicode[STIX]{x1D714}_{y}})$
in § 3.3. We use the conditional sampling method to classify large-scale negative- and positive-
 $u$
structures in accordance with the strength of
 $u_{L}$
(§ 3.4). In § 3.5, the two velocity–vorticity correlations are conditionally averaged with respect to
 $u_{L}$
, and the AM influences of negative- and positive-
 $u_{L}$
events on the skin friction induced by
 $\langle v\unicode[STIX]{x1D714}_{z}\rangle$
and
 $\langle -w\unicode[STIX]{x1D714}_{y}\rangle$
are examined. Finally, the conclusions of the present study are summarized in § 4.
2 Numerical simulation
The equations governing incompressible flows can be written in non-dimensional form:
 $$\begin{eqnarray}\displaystyle & \displaystyle \frac{\unicode[STIX]{x2202}\tilde{u} _{i}}{\unicode[STIX]{x2202}t}+\frac{\unicode[STIX]{x2202}\tilde{u} _{i}\tilde{u} _{j}}{\unicode[STIX]{x2202}x_{j}}=-\frac{\unicode[STIX]{x2202}\tilde{p}}{\unicode[STIX]{x2202}x_{i}}+\frac{1}{Re_{\unicode[STIX]{x1D6FF}_{0}}}\frac{\unicode[STIX]{x2202}}{\unicode[STIX]{x2202}x_{j}}\frac{\unicode[STIX]{x2202}\tilde{u} _{i}}{\unicode[STIX]{x2202}x_{j}}, & \displaystyle\end{eqnarray}$$
 $$\begin{eqnarray}\displaystyle & \displaystyle \frac{\unicode[STIX]{x2202}\tilde{u} _{i}}{\unicode[STIX]{x2202}x_{i}}=0, & \displaystyle\end{eqnarray}$$
where
 $x_{i}$
are the Cartesian coordinates and
 $\tilde{u} _{i}$
are the corresponding velocity components
 $(\tilde{u} _{i}=U_{i}+u_{i})$
. The letters
 $x$
,
 $y$
and
 $z$
denote the streamwise, wall-normal and spanwise directions, respectively, and
 $u$
,
 $v$
and
 $w$
are the corresponding velocity fluctuations. Each term in the governing equations was normalized by the inlet free-stream velocity (
 $U_{0}$
) and the inlet boundary layer thickness (
 $\unicode[STIX]{x1D6FF}_{0}$
). The Reynolds number is defined as
 $Re_{\unicode[STIX]{x1D6FF}_{0}}=U_{0}\unicode[STIX]{x1D6FF}_{0}/\unicode[STIX]{x1D708}$
, where
 $\unicode[STIX]{x1D708}$
is the kinetic viscosity. The pressure and the velocity were decoupled by using the fractional step method of Kim, Baek & Sung (Reference Kim, Baek and Sung2002) to solve the governing equations. The second-order Crank–Nicolson scheme was used to discretize implicitly the convection and viscous terms in time. The second-order central difference scheme was used to discretize all terms in space with a staggered grid. Details of the numerical procedure can be found in Kim et al. (Reference Kim, Baek and Sung2002).
The inflow condition was imposed as a superposition of a Blasius velocity profile and isotropic free-stream turbulence. The free-stream turbulence was generated from the Orr–Sommerfeld and Squire modes in the wall-normal direction and from the Fourier modes in time and in the spanwise direction (Jacobs & Durbin Reference Jacobs and Durbin2001). The intensity of the free-stream turbulence was set to 5 % and superimposed up to 2
 $\unicode[STIX]{x1D6FF}_{0}$
at the inlet. Details of the generation of inflow for TBLs and the simulation set-up for the ZPG TBL can be found in Hwang & Sung (Reference Hwang and Sung2017). The boundary layer was developed along a long domain from
 $Re_{\unicode[STIX]{x1D703}}(=U_{\infty }\unicode[STIX]{x1D703}/\unicode[STIX]{x1D708})\approx 108$
extending up to
 $Re_{\unicode[STIX]{x1D703}}\approx 6000$
, where
 $U_{\infty }$
is the free-stream velocity and
 $\unicode[STIX]{x1D703}$
is the momentum thickness. A periodic boundary condition was applied to the spanwise direction, and a no-slip boundary condition was applied to the bottom wall. The convective boundary condition (
 $\unicode[STIX]{x2202}\tilde{u} /\unicode[STIX]{x2202}t+c\unicode[STIX]{x2202}\tilde{u} /\unicode[STIX]{x2202}x=0$
, where
 $c$
is the local bulk velocity) was used at the exit boundary, and the Neumann boundary condition
 $(\unicode[STIX]{x2202}\tilde{u} /\unicode[STIX]{x2202}y=\unicode[STIX]{x2202}\tilde{w}/\unicode[STIX]{x2202}y=0)$
was used at the upper boundary. The power-law distribution of the free-stream velocity,
 $U_{\infty }=U_{0}(1-x/200\unicode[STIX]{x1D6FF}_{0})^{-0.2}$
, was imposed on the Neumann boundary condition by using the continuity
 $\unicode[STIX]{x2202}\tilde{v}/\unicode[STIX]{x2202}y=-\unicode[STIX]{x2202}U_{\infty }/\unicode[STIX]{x2202}x$
, for an equilibrium TBL (Townsend Reference Townsend1961; Mellor & Gibson Reference Mellor and Gibson1966). A power-law distribution of
 $U_{\infty }$
was applied beyond
 $x/\unicode[STIX]{x1D6FF}_{0}=600$
, which means that the APG is activated far from the inlet. The computational domain sizes (
 $L_{x}$
,
 $L_{y}$
and
 $L_{z}$
) were
 $1834\unicode[STIX]{x1D6FF}_{0}$
,
 $100\unicode[STIX]{x1D6FF}_{0}$
and
 $130\unicode[STIX]{x1D6FF}_{0}$
in the streamwise, wall-normal and spanwise directions, respectively. The dimensions of the grid were 10497 (
 $x$
), 541 (
 $y$
) and 1025 (
 $z$
). The uniform grid spacings in the wall-parallel plane were
 $\unicode[STIX]{x0394}x^{+}\approx 3.34$
and
 $\unicode[STIX]{x0394}z^{+}\approx 2.43$
, and stretched grids were used from the bottom wall to the upper boundary (
 $\unicode[STIX]{x0394}y_{min}^{+}\approx 0.098$
and
 $\unicode[STIX]{x0394}y_{100}^{+}\approx 0.296$
, which is the resolution of the 100th grid point from the wall) in the wall-normal direction. The superscript
 $+$
indicates the quantities normalized by the wall unit. In the present study, the reference streamwise location was chosen at
 $Re_{\unicode[STIX]{x1D70F}}=834$
and 837 for the APG and ZPG TBLs, respectively, where
 $Re_{\unicode[STIX]{x1D70F}}$
is the friction Reynolds number (
 $=u_{\unicode[STIX]{x1D70F}}\unicode[STIX]{x1D6FF}/\unicode[STIX]{x1D708}$
). The parameters of the computational domain, including those for the ZPG TBL, are summarized in table 1. The time step in the wall unit
 $\unicode[STIX]{x0394}t^{+}$
was 0.0744, and the total averaging time
 $t_{avg}$
was 6160
 $\unicode[STIX]{x1D6FF}_{0}/U_{0}$
. Hybrid parallel computing with OpenMP and MPI was employed in the code, and the simulation was performed by using 1024 cores of Tachyon II (SUN B6275) at the KISTI Supercomputing Centre.
Parameters of the computational domain.
 $L_{i}$
and
 $N_{i}$
are the domain size and the number of grid points in each direction, respectively.
 $\unicode[STIX]{x0394}x^{+},\unicode[STIX]{x0394}y^{+}$
and
 $\unicode[STIX]{x0394}z^{+}$
are the grid resolutions in the streamwise, wall-normal and spanwise directions, respectively. The inner-normalized resolutions are taken at
 $Re_{\unicode[STIX]{x1D70F}}=834$
and
 $Re_{\unicode[STIX]{x1D70F}}=837$
for the APG and ZPG TBLs, respectively.

3 Results and discussion
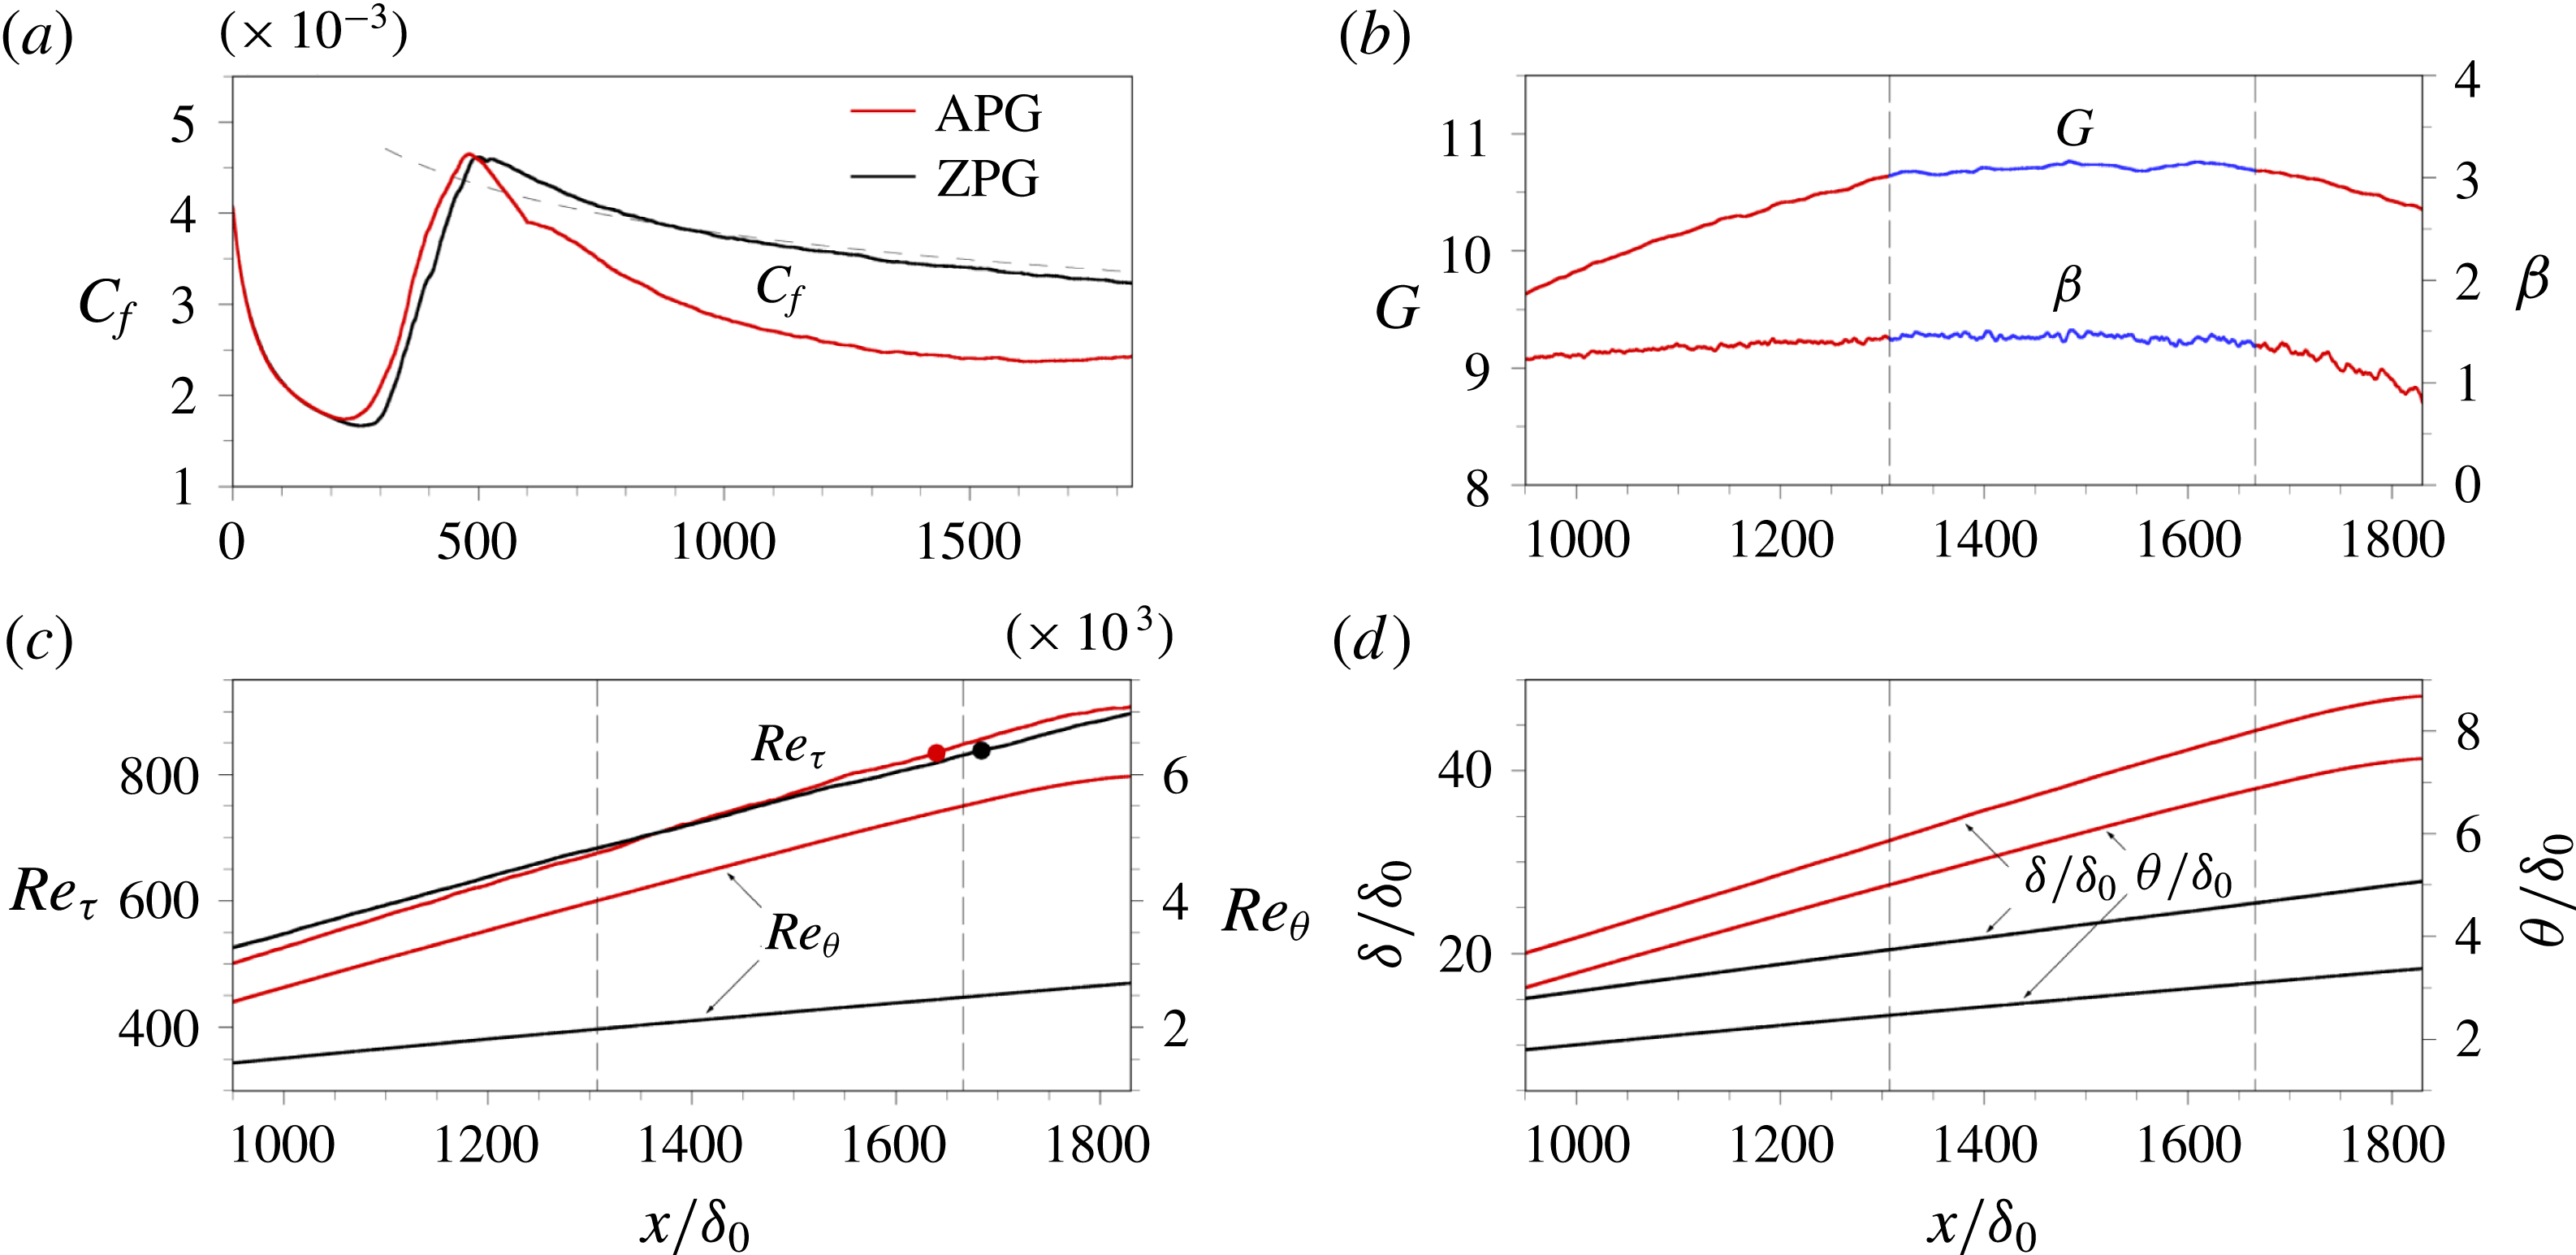
Figure 1(a) shows the skin friction coefficient. The dashed line indicates the prediction of
 $C_{f}$
for turbulent flow
 $(C_{f}=0.0576Re_{x}^{-0.2})$
. The non-dimensional pressure gradient parameter,
 $\unicode[STIX]{x1D6FD}\equiv \unicode[STIX]{x1D6FF}^{\ast }\unicode[STIX]{x1D70F}_{w}^{-1}(\text{d}p/\text{d}x)=-\unicode[STIX]{x1D6E5}u_{\unicode[STIX]{x1D70F}}^{-1}(\text{d}U_{\infty }/\text{d}x)$
and the defect shape factor,
 $G\equiv \unicode[STIX]{x1D6E5}^{-1}\int _{0}^{\unicode[STIX]{x1D6FF}}(U_{\infty }-U)^{2}u_{\unicode[STIX]{x1D70F}}^{-2}\,\text{d}y$
(Clauser Reference Clauser1954) are shown in figure 1(b). Here,
 $\unicode[STIX]{x1D6FF}^{\ast }(\equiv \int _{0}^{\unicode[STIX]{x1D6FF}}(U_{\infty }-U)U_{\infty }^{-1}\,\text{d}y)$
is the displacement thickness and
 $\unicode[STIX]{x1D6E5}(\equiv \int _{0}^{\unicode[STIX]{x1D6FF}}(U_{\infty }-U)u_{\unicode[STIX]{x1D70F}}^{-1}\,\text{d}y)$
is the Rotta–Clauser length scale known as the defect displacement thickness. The APG TBLs contain an equilibrium region in which
 $\unicode[STIX]{x1D6FD}$
and
 $G$
are constant (Mellor & Gibson Reference Mellor and Gibson1966; Skote, Henningson & Henkes Reference Skote, Henningson and Henkes1998; Lee & Sung Reference Lee and Sung2008; Bobke et al.
Reference Bobke, Vinuesa, Örlü and Schlatter2017). In the results of the present study,
 $\unicode[STIX]{x1D6FD}$
and
 $G$
are nearly constant (
 $\unicode[STIX]{x1D6FD}=1.45$
and
 $G=10.73$
) from
 $x/\unicode[STIX]{x1D6FF}_{0}=1307$
to 1666 for
 $Re_{\unicode[STIX]{x1D703}}$
in the range 4000–5500. The development of the friction Reynolds number (
 $Re_{\unicode[STIX]{x1D70F}}$
) and momentum thickness Reynolds number (
 $Re_{\unicode[STIX]{x1D703}}$
) along the streamwise direction is shown in figure 1(c), where two enclosed circles represent the target Reynolds number in the present study as
 $Re_{\unicode[STIX]{x1D70F}}=834$
(
 $Re_{\unicode[STIX]{x1D703}}=5400$
) for the APG TBL and
 $Re_{\unicode[STIX]{x1D70F}}=837$
(
 $Re_{\unicode[STIX]{x1D703}}=2500$
) for the ZPG TBL. Figure 1(d) shows the boundary layer thickness (
 $\unicode[STIX]{x1D6FF}$
), defined as the wall-normal location of
 $U=0.99U_{\infty }$
, and the momentum thickness
 $\unicode[STIX]{x1D703}(\equiv \int _{0}^{\unicode[STIX]{x1D6FF}}(UU_{\infty }^{-1})(U_{\infty }-U)U_{\infty }^{-1}\,\text{d}y)$
. In the equilibrium region in the APG TBL,
 $\unicode[STIX]{x1D6FF}/\unicode[STIX]{x1D6FF}_{0}$
and
 $\unicode[STIX]{x1D703}/\unicode[STIX]{x1D6FF}_{0}$
are approximately 1.7 and 2.1 times larger than those in the ZPG TBL, respectively.
(a) Skin friction coefficient
 $C_{f}$
. (b) The non-dimensional pressure gradient parameter
 $\unicode[STIX]{x1D6FD}$
and the defect shape factor
 $G$
. Blue line between two vertical dashed lines indicates the equilibrium region. (c) The Reynolds number development. Enclosed circles indicate target
 $Re_{\unicode[STIX]{x1D70F}}$
in each TBL:
 $Re_{\unicode[STIX]{x1D70F}}=834$
for the APG TBL and
 $Re_{\unicode[STIX]{x1D70F}}=837$
for the ZPG TBL. (d) The boundary layer thickness
 $\unicode[STIX]{x1D6FF}$
and the momentum thickness
 $\unicode[STIX]{x1D703}$
.

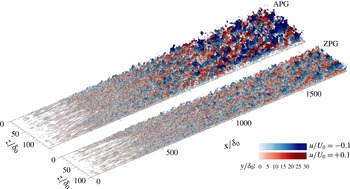
Figure 2 shows the isosurfaces of the streamwise velocity fluctuations. The depth of colour indicates the wall-normal distance, and the blue and red isosurfaces represent the negative- and positive-
 $u$
structures (
 $u/U_{0}=-0.1$
and
 $u/U_{0}=+0.1$
), respectively. Since the inflow was generated by the superposition of the Blasius velocity profile and the isotropic free-stream turbulence, one computational domain contains laminar, transient, and turbulent flow regions. Around
 $x/\unicode[STIX]{x1D6FF}_{0}=200$
, laminar streaks are observed in both TBLs. Beyond
 $x/\unicode[STIX]{x1D6FF}_{0}\approx 300$
, at which point
 $C_{f}$
increases sharply (figure 1
a), the streaks develop into a patch of irregular motions due to the penetration of the free-stream turbulence. In the fully turbulent region, the difference between the LSMs of the APG and ZPG TBLs is significant. The negative- and positive-
 $u$
structures subjected to the APG are wider in the spanwise direction (Lee & Sung Reference Lee and Sung2009; Lee Reference Lee2017; Maciel, Simens & Gungor Reference Maciel, Simens and Gungor2017) and extend farther from the wall (Kitsios et al.
Reference Kitsios, Sekimoto, Atkinson, Sillero, Borrell, Gungor, Jiménez and Soria2017). When the LSMs are more active due to an APG, several features are evident: (i) enhanced large-scale energy in the outer region in the pre-multiplied energy spectra of the streamwise velocity fluctuations (Harun et al.
Reference Harun, Monty, Mathis and Marusic2013; Kitsios et al.
Reference Kitsios, Sekimoto, Atkinson, Sillero, Borrell, Gungor, Jiménez and Soria2017; Lee Reference Lee2017); (ii) the increase in the influence of the AM on small scales by the LSMs (Monty et al.
Reference Monty, Harun and Marusic2011; Harun et al.
Reference Harun, Monty, Mathis and Marusic2013; Lee Reference Lee2017); (iii) high turbulent kinetic energy production in the outer region (Skåre & Krogstad Reference Skåre and Krogstad1994; Kitsios et al.
Reference Kitsios, Atkinson, Sillero, Borrell, Gungor, Jiménez and Soria2016, Reference Kitsios, Sekimoto, Atkinson, Sillero, Borrell, Gungor, Jiménez and Soria2017). In the present study, we focused on the superposition and AM effects of large scales on the vortical motions, which ultimately contribute to the local skin friction.
Isosurfaces of the streamwise velocity fluctuations. The blue and red areas are the negative- and positive-
 $u$
structures (
 $u/U_{0}=-0.1$
and
 $+0.1$
), respectively.

3.1 Turbulence statistics
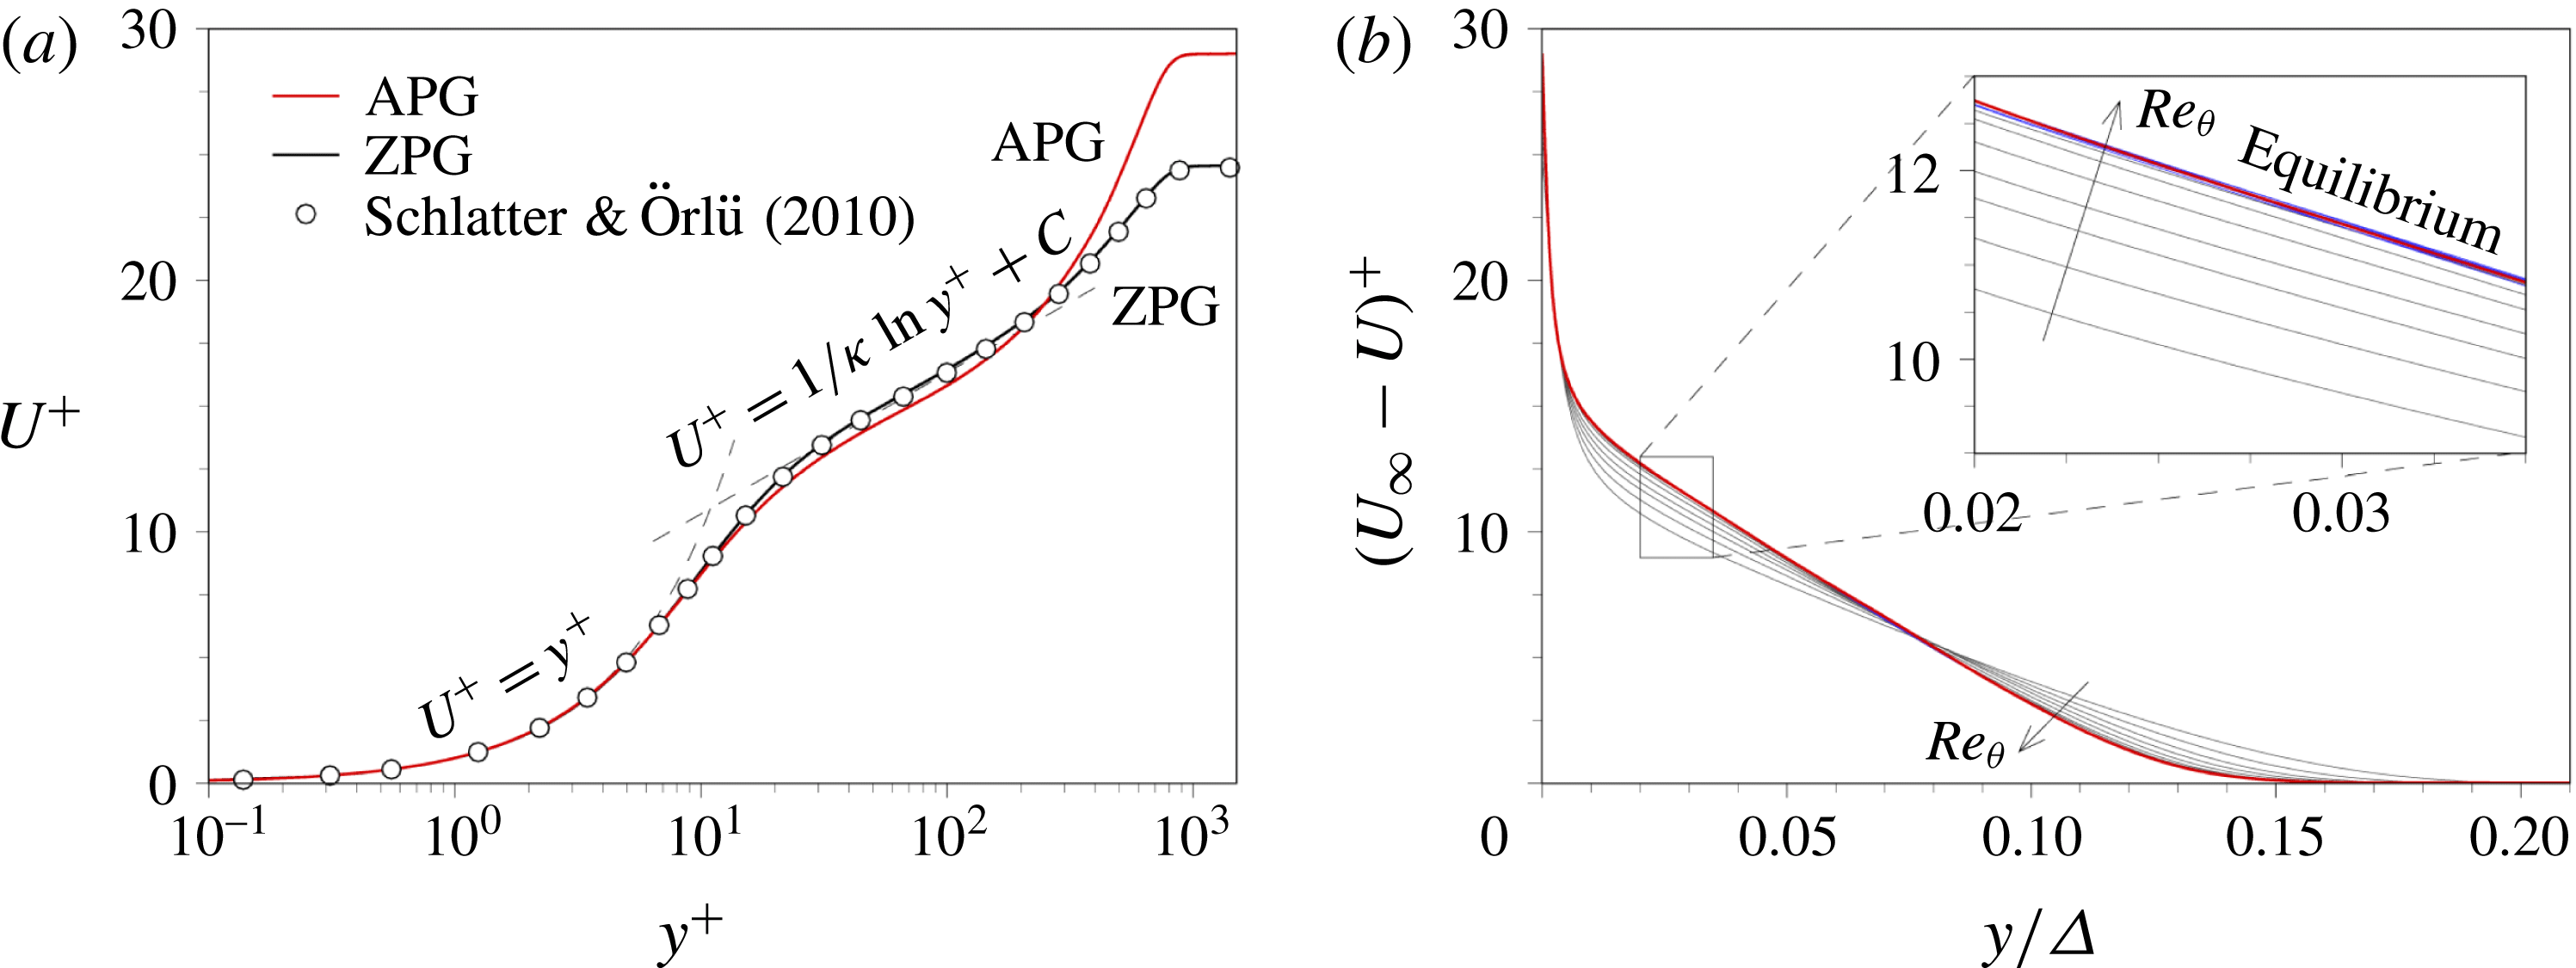
The mean velocity profiles are shown in figure 3(a) along with the DNS data for the ZPG TBL (
 $Re_{\unicode[STIX]{x1D70F}}=830$
) reported by Schlatter & Örlü (Reference Schlatter and Örlü2010). The red and black lines are for the APG and ZPG TBLs, respectively. The logarithmic law of the APG TBL is slightly shifted downward, and there is a large wake region above
 $y^{+}\approx 300$
. Note that the turbulence statistics obtained in the present study were averaged over the region
 $x^{\prime }=x_{r}\pm 0.5\unicode[STIX]{x1D6FF}$
, where
 $x_{r}$
is the reference position at
 $Re_{\unicode[STIX]{x1D70F}}\approx 835$
. Figure 3(b) shows the defect velocity profiles (
 $U_{\infty }$
–
 $U$
)
 $^{+}$
versus
 $y/\unicode[STIX]{x1D6E5}$
for the equilibrium region in the APG TBL. The grey and blue lines represent the profiles at
 $Re_{\unicode[STIX]{x1D703}}=2100$
–3900 and at
 $Re_{\unicode[STIX]{x1D703}}=4100$
–5300 within the equilibrium region, respectively, for increments of
 $Re_{\unicode[STIX]{x1D703}}=300$
. As shown in the inset of figure 3(b), all the defect velocity profiles (blue) collapse onto a single curve, indicating that the flows in the equilibrium region satisfy self-similarity (Henkes Reference Henkes1998; Skote et al.
Reference Skote, Henningson and Henkes1998; Lee Reference Lee2017).
(a) Mean velocity profiles in wall units: red, the APG TBL at
 $Re_{\unicode[STIX]{x1D70F}}=834$
(
 $Re_{\unicode[STIX]{x1D703}}=5400$
); black, the ZPG TBL at
 $Re_{\unicode[STIX]{x1D70F}}=837$
. Dashed lines indicate the linear law and the logarithmic law, where
 $\unicode[STIX]{x1D705}$
is the von Kármán constant of 0.41 and
 $C$
is constant value of 5.1. Defect velocity profiles normalized by (b) the friction velocity
 $u_{\unicode[STIX]{x1D70F}}$
and the Rotta–Clauser length scale
 $\unicode[STIX]{x1D6E5}$
: grey,
 $Re_{\unicode[STIX]{x1D703}}=2100$
–3900; blue,
 $Re_{\unicode[STIX]{x1D703}}=4100$
–5300 for increments of
 $Re_{\unicode[STIX]{x1D703}}=300$
.

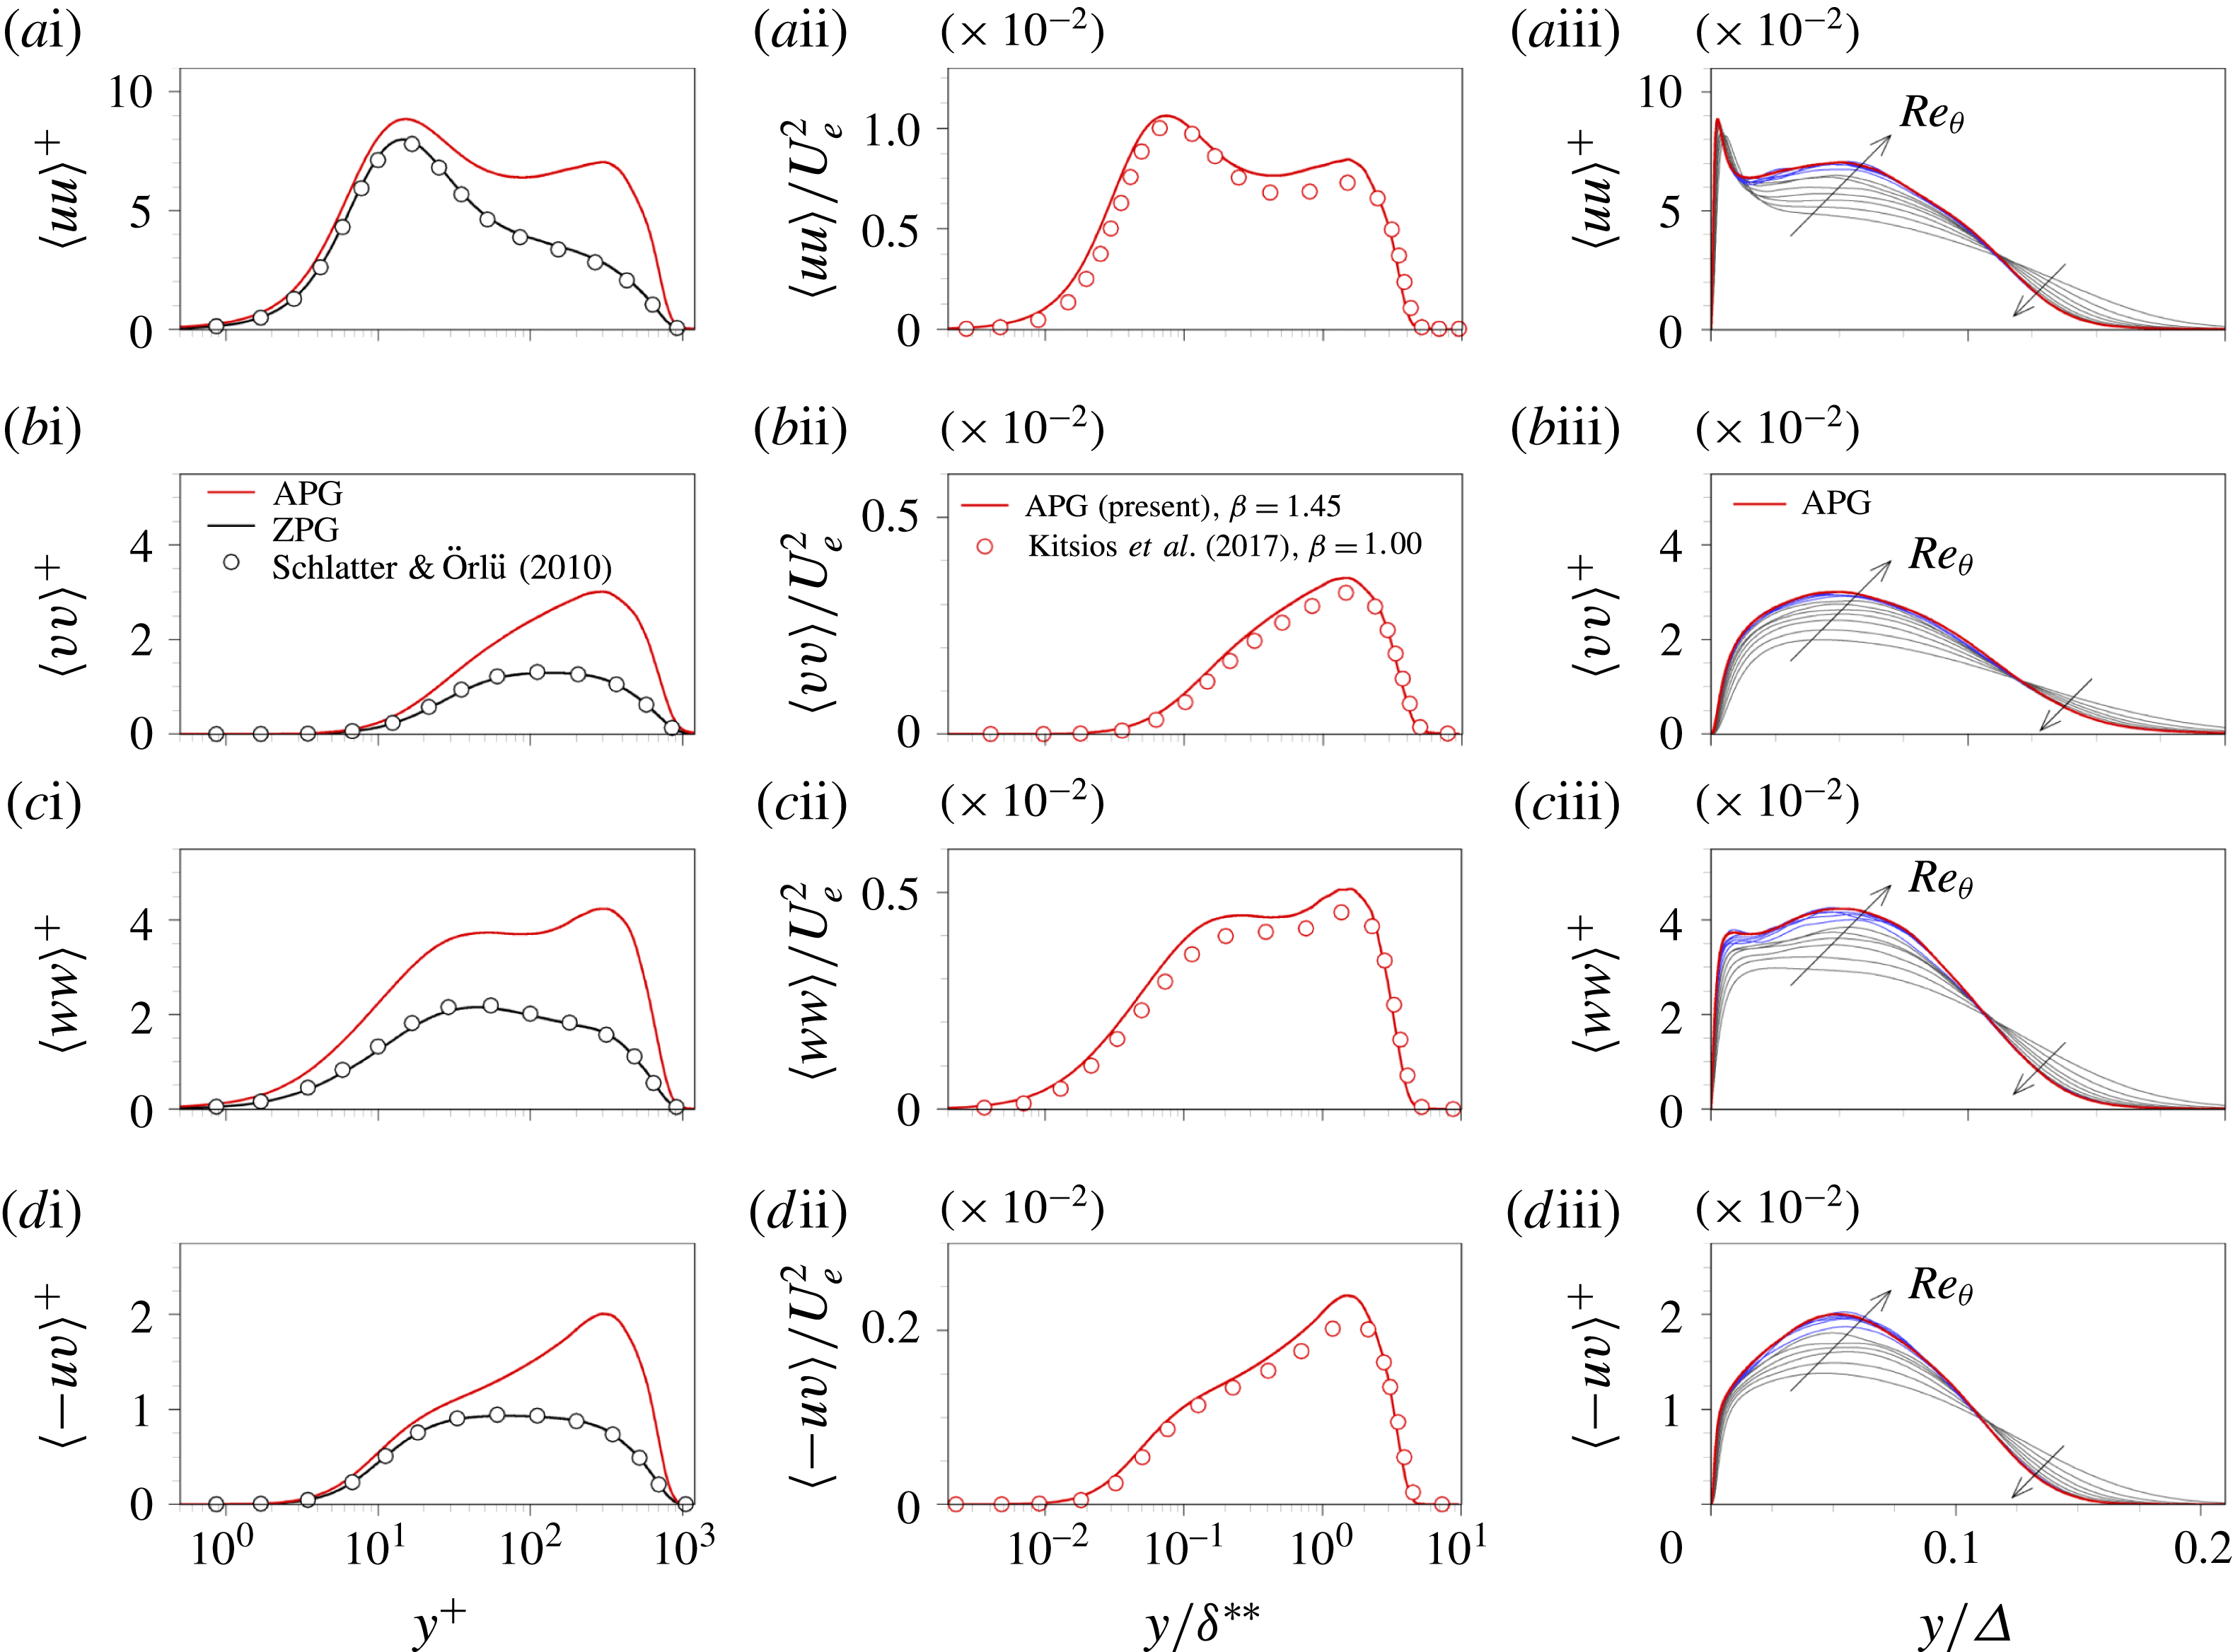
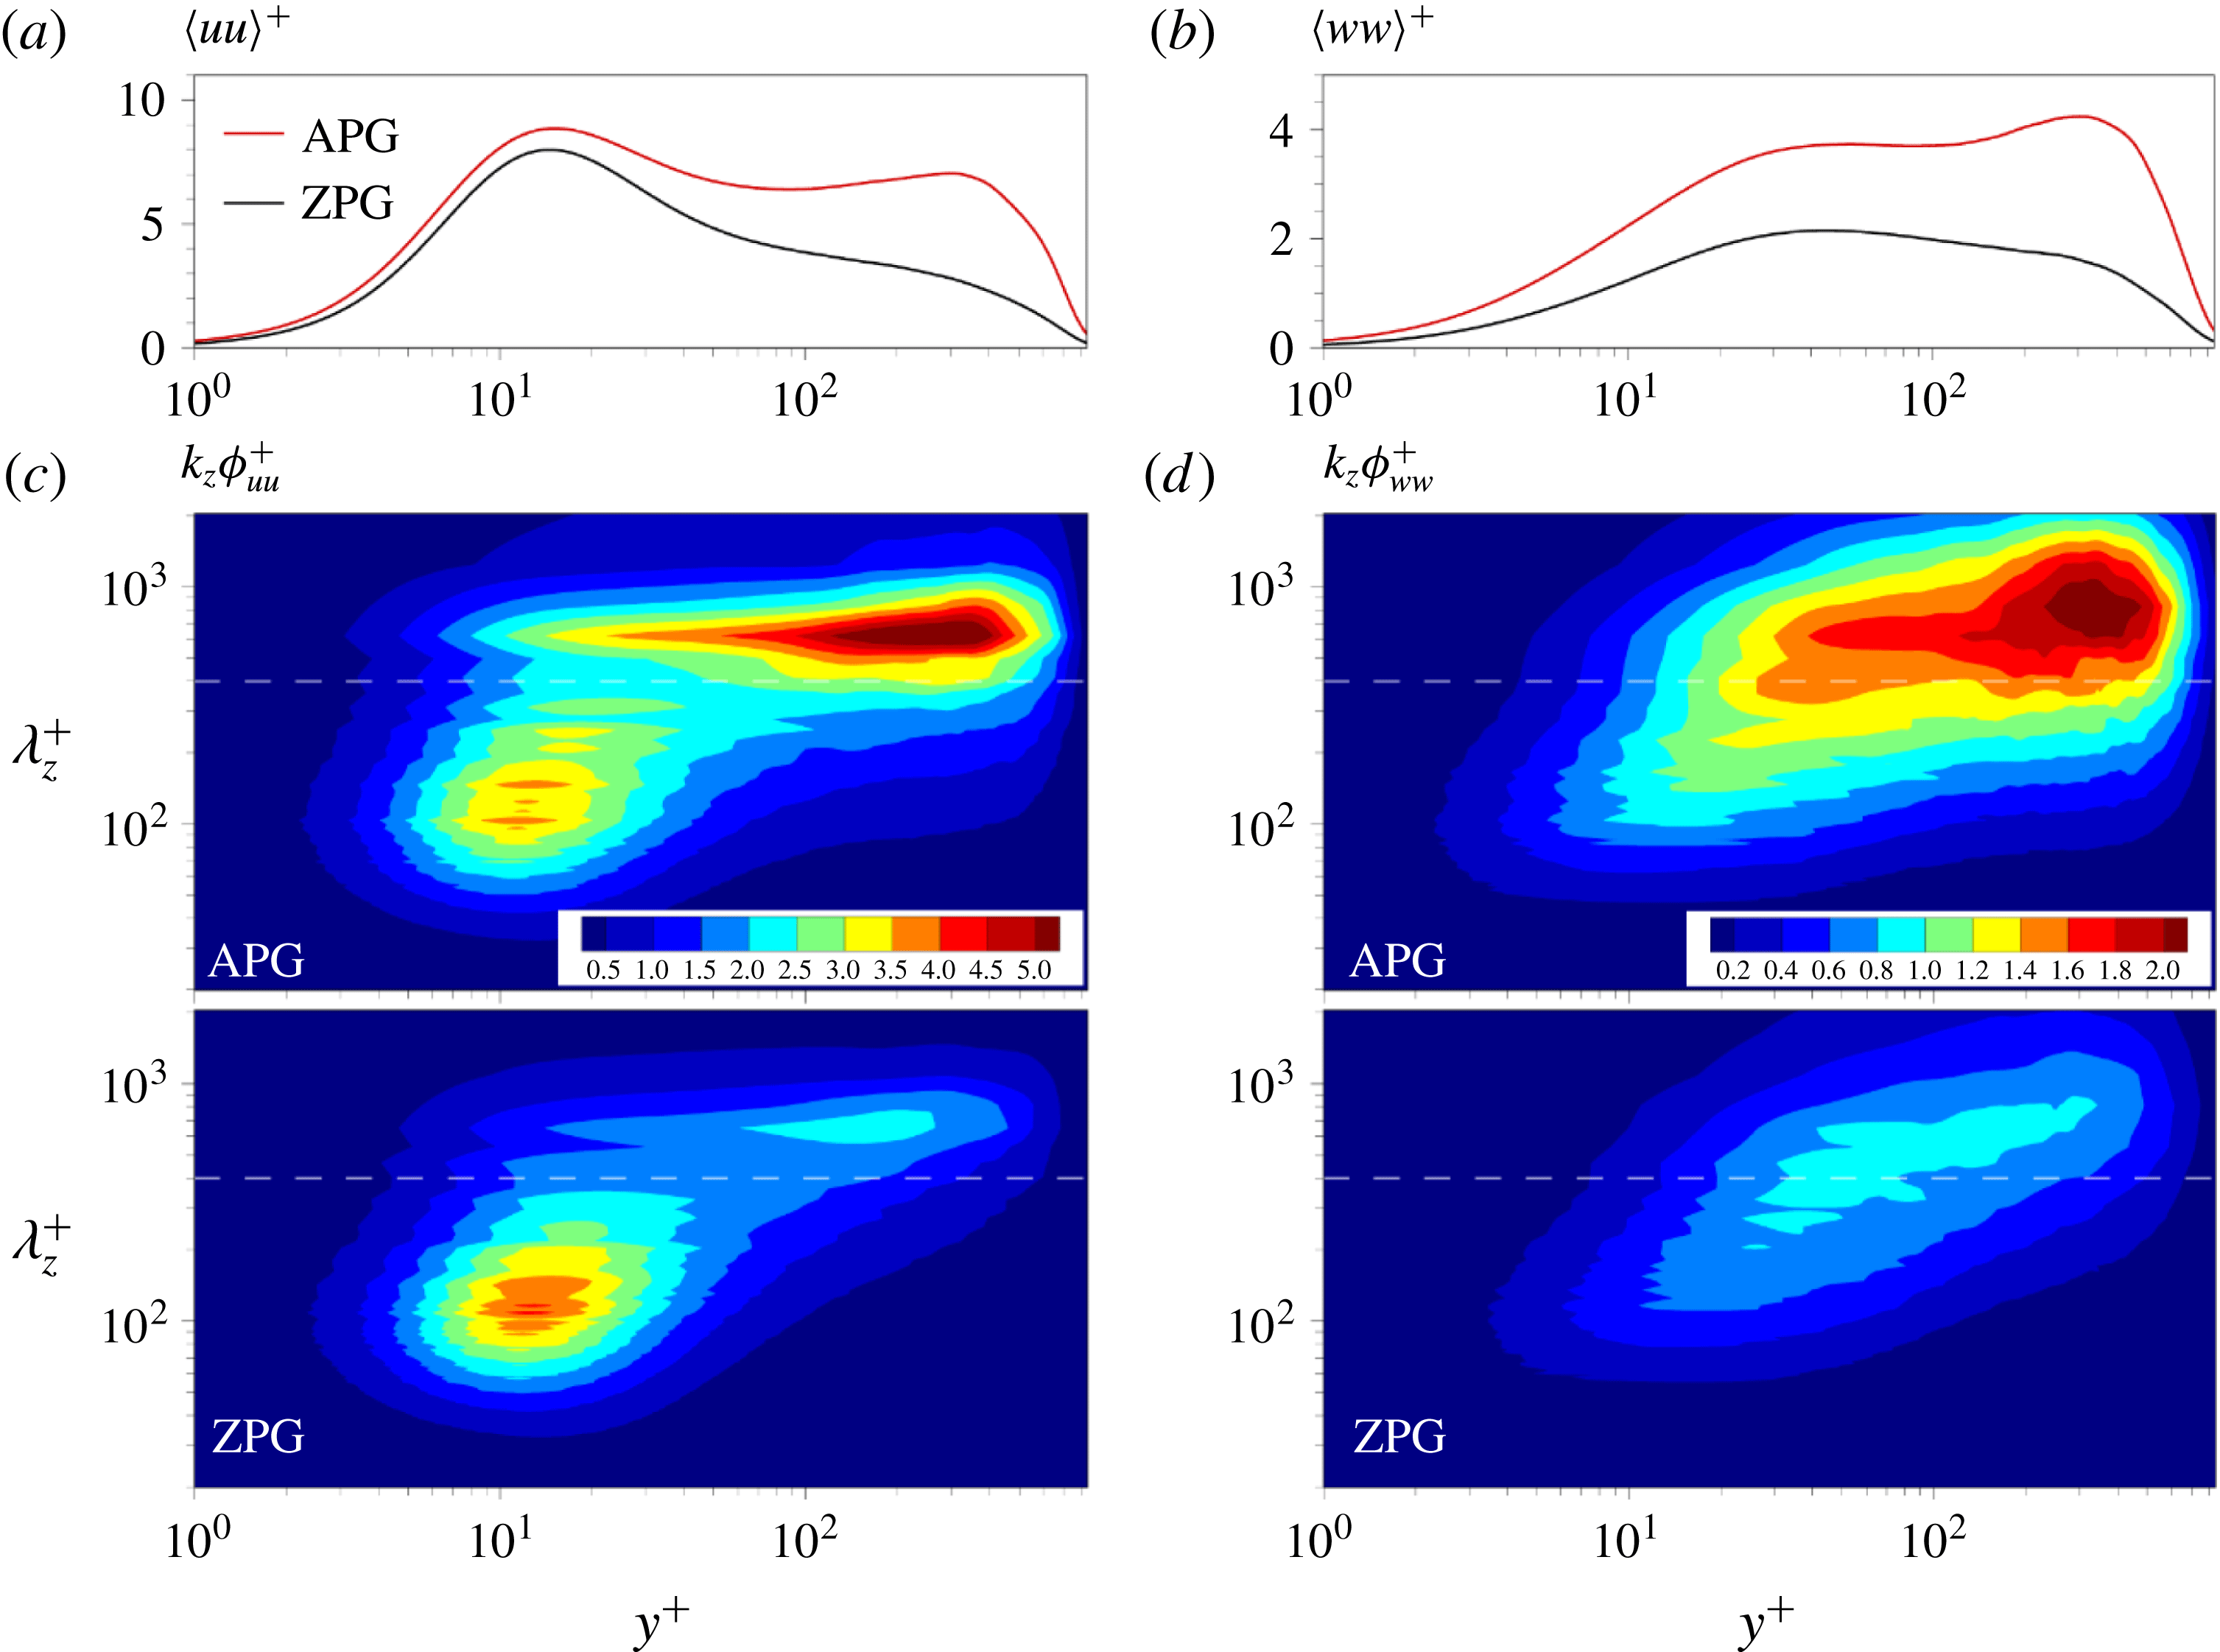
Figure 4(ai–di) shows the Reynolds stresses (i.e.
 $\langle uu\rangle$
,
 $\langle vv\rangle$
,
 $\langle ww\rangle$
and
 $\langle -uv\rangle$
), which have a clear peak at
 $y^{+}\approx 300$
due to the strong turbulence in the wake region. All the Reynolds stresses are higher for all wall-normal locations in the APG TBL, especially in the outer region. In particular, the value of
 $\langle ww\rangle$
is significantly higher below
 $y^{+}=20$
; there is a plateau in the range
 $20<y^{+}<80$
and also a clear outer peak. Given that the wall-parallel components carried by the large scales were non-zero close to the wall in the sense of Townsend’s attached eddy hypothesis (Townsend Reference Townsend1976), the difference in the wall-parallel components (
 $\langle uu\rangle$
and
 $\langle ww\rangle$
) close to the wall could imply the influence of enhanced large scales in the outer region; this point will be discussed in detail in §§ 3.2 and 3.4.
The Reynolds stresses: (a)
 $\langle uu\rangle$
, (b)
 $\langle vv\rangle$
, (c)
 $\langle ww\rangle$
and (d)
 $\langle -uv\rangle$
. The quantities in (i) were normalized by the wall units, in (ii) were normalized by the reference velocity
 $U_{e}$
and the displacement thickness
 $\unicode[STIX]{x1D6FF}^{\ast \ast }$
, and in (iii) were normalized by the friction velocity
 $u_{\unicode[STIX]{x1D70F}}$
and the Rotta–Clauser thickness
 $\unicode[STIX]{x1D6E5}$
. Grey and blue lines in (iii) are the same as those in figure 3(b).

The Reynolds stresses scaled with the reference velocity (
 $U_{e}$
) and the displacement thickness (
 $\unicode[STIX]{x1D6FF}^{\ast \ast }$
) similar to those of Spalart & Watmuff (Reference Spalart and Watmuff1993) are shown in figure 4(aii–dii), where red circles indicate DNS data of a self-similar APG TBL with
 $\unicode[STIX]{x1D6FD}=1.00$
at
 $Re_{\unicode[STIX]{x1D703}}=4150$
(Kitsios et al.
Reference Kitsios, Sekimoto, Atkinson, Sillero, Borrell, Gungor, Jiménez and Soria2017). Note that
 $U_{e}$
is defined as
 $U_{e}(x)=-\int _{0}^{y_{th}(x)}\unicode[STIX]{x1D6FA}_{z}(x,y)\,\text{d}y$
and
 $\unicode[STIX]{x1D6FF}^{\ast \ast }$
can be calculated as
 $\unicode[STIX]{x1D6FF}^{\ast \ast }(x)=-U_{e}^{-1}(x)\int _{0}^{y_{th}(x)}y\unicode[STIX]{x1D6FA}_{z}(x,y)\,\text{d}y$
, where
 $y_{th}(x)$
is the wall-normal position at 0.2 % of
 $\unicode[STIX]{x1D6FA}_{z}(x)|_{y=0}$
(Kitsios et al.
Reference Kitsios, Sekimoto, Atkinson, Sillero, Borrell, Gungor, Jiménez and Soria2017). As shown in figure 4(aii–dii), all the Reynolds stresses are in good agreement with the data of Kitsios et al. (Reference Kitsios, Sekimoto, Atkinson, Sillero, Borrell, Gungor, Jiménez and Soria2017). Figure 4(aiii–diii) shows the Reynolds stresses with respect to
 $y/\unicode[STIX]{x1D6E5}$
, where the grey and blue lines are the same as those in figure 3. As shown, the profiles in the equilibrium region fall onto a single curve, representing the self-similarity in the equilibrium region of the present APG TBL.
3.2 Large scales in the pre-multiplied spanwise spectra
To further explore the contribution of scale to the differences between two TBLs in
 $\langle uu\rangle$
and
 $\langle ww\rangle$
, the pre-multiplied spanwise energy spectra of the streamwise and spanwise velocity fluctuations (
 $k_{z}\unicode[STIX]{x1D719}_{uu}$
and
 $k_{z}\unicode[STIX]{x1D719}_{ww}$
) are displayed in figure 5(c,d). Here,
 $k_{z}$
(
 $=2\unicode[STIX]{x03C0}/\unicode[STIX]{x1D706}_{z}$
) is the spanwise wavenumber. The profiles of
 $\langle uu\rangle$
and
 $\langle ww\rangle$
in figure 5(a,b) can be obtained by integrating
 $k_{z}\unicode[STIX]{x1D719}_{uu}$
and
 $k_{z}\unicode[STIX]{x1D719}_{ww}$
with respect to
 $k_{z}$
. The uu energy spectrum of the APG TBL contains a strong peak in the outer region (
 $y^{+}\approx 300$
), which results from the energy carried by the long-wavelength motions
 $(\unicode[STIX]{x1D706}_{z}^{+}\approx 630)$
. The value of this outer peak is 2.7 times larger than that of the ZPG TBL. In the present study, the cutoff spanwise wavelength of
 $\unicode[STIX]{x1D706}_{z,c}^{+}=400(\unicode[STIX]{x1D706}_{z,c}/\unicode[STIX]{x1D6FF}\approx 0.5)$
was selected to separate the large- and small-scale streamwise velocity fluctuations (Bernardini & Pirozzoli Reference Bernardini and Pirozzoli2011; Ahn et al.
Reference Ahn, Lee, Jang and Sung2013; Hwang & Sung Reference Hwang and Sung2017). The uu energy in the inner region is slightly lower than that of the ZPG TBL, which is related to the self-sustaining processes of small scales (Hamilton et al.
Reference Hamilton, Kim and Waleffe1995; Waleffe Reference Waleffe1997). As shown in figure 5(c), however, the value of the inner peak of
 $\langle uu\rangle$
for the APG TBL is larger than that for the ZPG TBL, which indicates that the superimposed LSMs
 $(\unicode[STIX]{x1D706}_{z}^{+}\geqslant 400)$
in the near-wall region make the dominant contribution to the increase in the value of the inner peak of
 $\langle uu\rangle$
. In other words, the contribution of the LSMs to
 $\langle uu\rangle$
is enhanced not only in the outer region but also in the near-wall region. The enhanced footprints of the LSMs in the APG TBL are likely to have greater influence on the near-wall turbulence than those in the ZPG TBL.
As shown in figure 4(ci), the value of
 $\langle ww\rangle$
for the APG TBL is much higher than that for the ZPG TBL in both the inner and outer regions. The ww energy spectrum contains an outer peak (
 $y^{+}\approx 330$
) that results from the outer long-wavelength motions with
 $\unicode[STIX]{x1D706}_{z}^{+}\approx 830\;(\unicode[STIX]{x1D706}_{z}\approx \unicode[STIX]{x1D6FF})$
, which is the spanwise characteristic length scale of
 $w$
structures (Kim & Adrian Reference Kim and Adrian1999). The value of the outer peak of the ww energy spectrum for the APG TBL is 1.6 times higher than that for the ZPG TBL. Similar to
 $k_{z}\unicode[STIX]{x1D719}_{uu}$
, the large-scale ww energy is extended to the near-wall region. In contrast to the trend in
 $k_{z}\unicode[STIX]{x1D719}_{uu}$
, the small-scale energy of
 $k_{z}\unicode[STIX]{x1D719}_{ww}$
near the wall increases significantly, which implies that the AM influences of the LSMs on the small-scale spanwise velocity fluctuations near the wall are enhanced in the APG TBL. The enhanced LSMs result in the increased AM influence on the small-scale streamwise velocity fluctuations (Harun et al.
Reference Harun, Monty, Mathis and Marusic2013). Besides, the AM effects on other velocity components (Talluru et al.
Reference Talluru, Baidya, Hutchins and Marusic2014) and on the swirling strengths (Hwang & Sung Reference Hwang and Sung2017) were reported in ZPG TBLs. Thus, the AM influence of the LSMs on the vortical motions could be greater in the APG TBL than in the ZPG TBL.
Profiles of (a)
 $\langle uu\rangle$
and (b)
 $\langle ww\rangle$
. Pre-multiplied spanwise energy spectra of (c) the streamwise and (d) the spanwise velocity fluctuations. The white dashed line indicates the cutoff wavelength,
 $\unicode[STIX]{x1D706}_{z,c}^{+}=400$
.

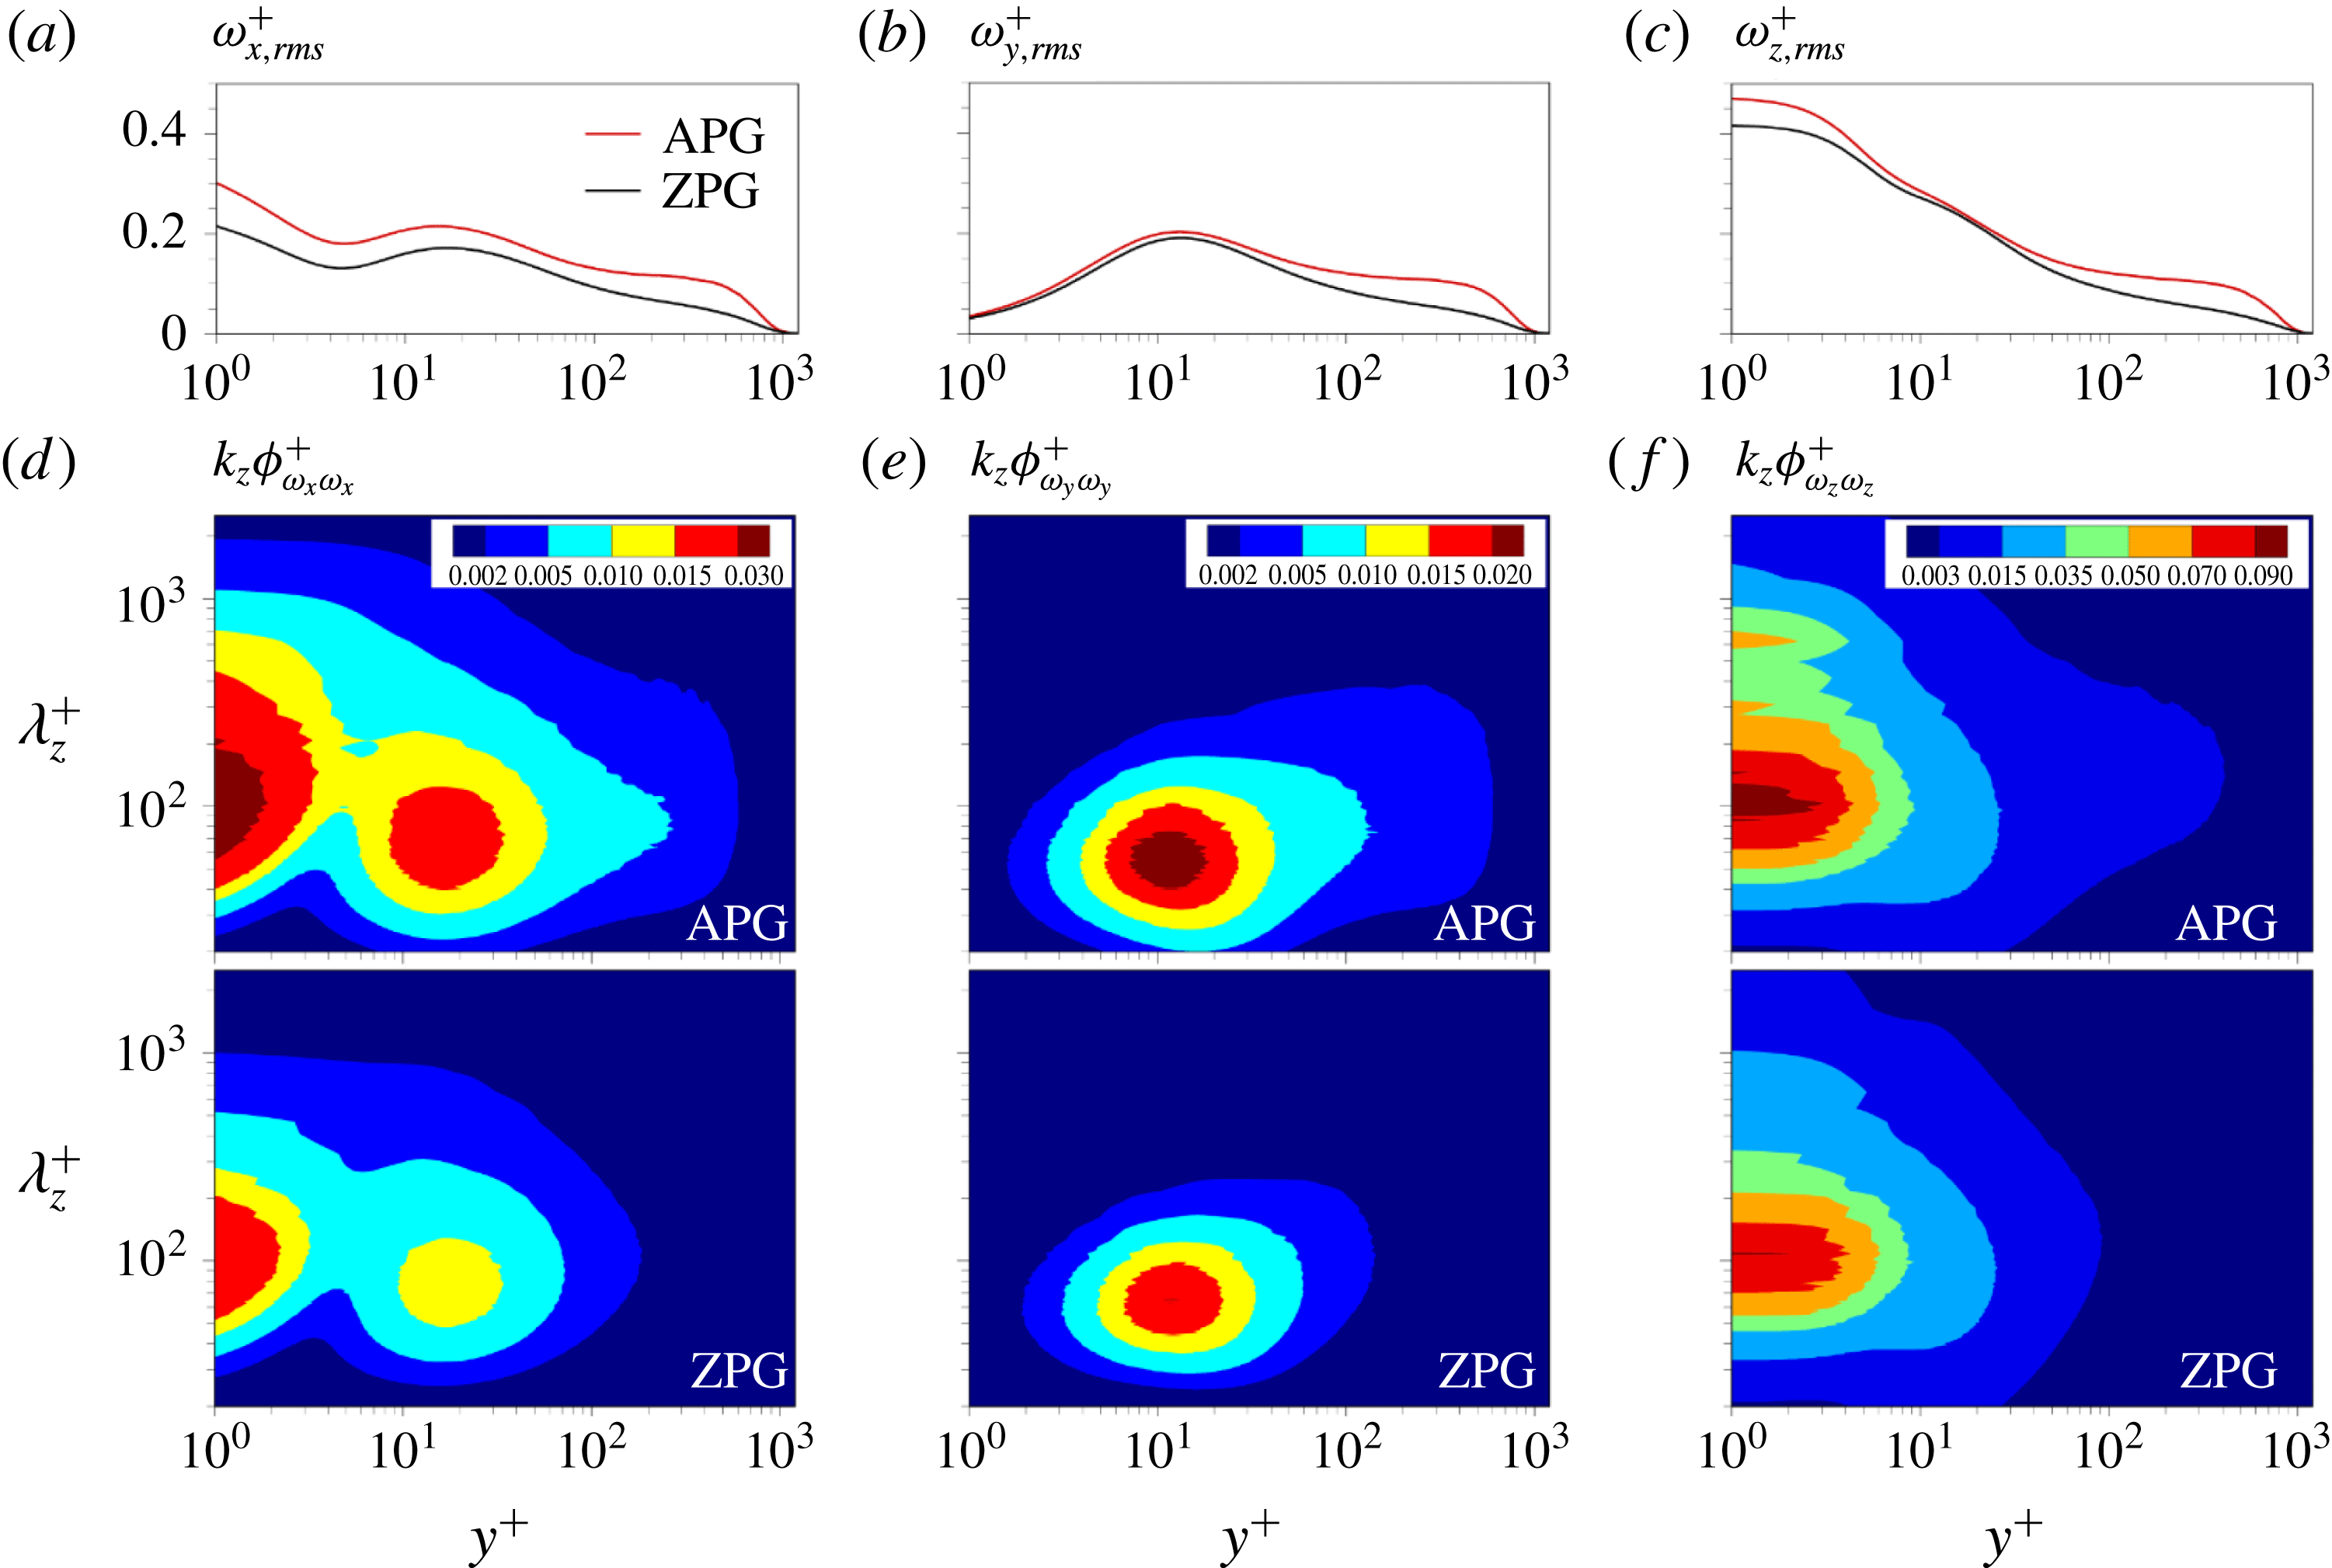
Figure 6(a–c) shows the r.m.s. values of the streamwise, wall-normal and spanwise vorticity fluctuations (
 $\unicode[STIX]{x1D714}_{x,rms}$
,
 $\unicode[STIX]{x1D714}_{y,rms}$
and
 $\unicode[STIX]{x1D714}_{z,rms}$
). In the near-wall region (
 $y^{+}<15$
), the higher r.m.s. values are observed in the APG TBL, and in particular the difference is more prominent for the streamwise and spanwise components. To further examine the difference, the pre-multiplied spanwise energy spectra of the vorticity fluctuations in the streamwise, wall-normal and spanwise directions (
 $k_{z}\unicode[STIX]{x1D719}_{\unicode[STIX]{x1D714}_{x}\unicode[STIX]{x1D714}_{x}},k_{z}\unicode[STIX]{x1D719}_{\unicode[STIX]{x1D714}_{y}\unicode[STIX]{x1D714}_{y}}$
and
 $k_{z}\unicode[STIX]{x1D719}_{\unicode[STIX]{x1D714}_{z}\unicode[STIX]{x1D714}_{z}}$
) are shown in figure 6(d–f). The peaks are observed at
 $\unicode[STIX]{x1D706}_{z}^{+}\approx 100$
and the energy contained around the peak is enhanced, indicating that the vortical motions are more active due to the presence of the APG. In addition, the large scales
 $(\unicode[STIX]{x1D706}_{z}^{+}\geqslant 400)$
of
 $\unicode[STIX]{x1D714}_{x}$
and
 $\unicode[STIX]{x1D714}_{z}$
are more pronounced in the near-wall region. The intense r.m.s. values of the vorticity fluctuations (figure 6
a–c) arise from the enhanced small-scale energy, and also those of
 $\unicode[STIX]{x1D714}_{x}$
and
 $\unicode[STIX]{x1D714}_{z}$
result from the superposition of large scales. This means that the enhanced large scales are connected to the active vortical motions, and thus the increase in the small scales near the wall might be attributed to the AM effects of the LSMs.
Profiles of (a)
 $\unicode[STIX]{x1D714}_{x,rms}$
, (b)
 $\unicode[STIX]{x1D714}_{y,rms}$
and (c)
 $\unicode[STIX]{x1D714}_{z,rms}$
. Pre-multiplied spanwise energy spectra of (d) the streamwise, (e) wall-normal and (f) spanwise vorticity fluctuations.

The vortical motions are closely related to the ejection and sweep motions, which are major contributors to the Reynolds shear stress (Robinson Reference Robinson1991). The wall-normal derivative of the Reynolds shear stress
 $(\unicode[STIX]{x2202}\langle -uv\rangle /\unicode[STIX]{x2202}y)$
is referred as the net mean effect of the turbulent inertia that acts as a momentum source or sink. In addition,
 $\unicode[STIX]{x2202}\langle -uv\rangle /\unicode[STIX]{x2202}y$
is directly related to
 $\langle v\unicode[STIX]{x1D714}_{z}\rangle$
and
 $\langle -w\unicode[STIX]{x1D714}_{y}\rangle$
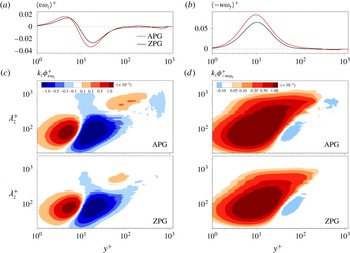
corresponding to the advective transport and the vortex stretching, respectively. To further explore the vortical motions under the presence of the APG, the velocity–vorticity correlations and their spanwise co-spectra are shown in figure 7. Figure 7(a,b) shows the profiles of
 $\langle v\unicode[STIX]{x1D714}_{z}\rangle$
and
 $\langle -w\unicode[STIX]{x1D714}_{y}\rangle$
. The zero-crossing location arises at
 $y^{+}\approx 8$
in the profile of
 $\langle v\unicode[STIX]{x1D714}_{z}\rangle$
, and
 $\langle v\unicode[STIX]{x1D714}_{z}\rangle$
passes through a positive peak at
 $y^{+}\approx 5$
and a negative peak at
 $y^{+}\approx 18$
. The positive
 $\langle v\unicode[STIX]{x1D714}_{z}\rangle$
near the wall can be interpreted physically as the vertical advection of the sublayer streaks, and the negative
 $\langle v\unicode[STIX]{x1D714}_{z}\rangle$
in the buffer region indicates the outward motions of the hairpin vortex heads (Klewicki, Murray & Falco Reference Klewicki, Murray and Falco1994; Chin et al.
Reference Chin, Philip, Klewicki, Ooi and Marusic2014).
 $\langle -w\unicode[STIX]{x1D714}_{y}\rangle$
has positive values for all wall-normal locations with a positive peak at
 $y^{+}\approx 10$
. The positive values of
 $\langle -w\unicode[STIX]{x1D714}_{y}\rangle$
correspond physically to a simultaneous collapse of two adjacent hairpin vortex legs resulted from the stretching of hairpin vortex (Eyink Reference Eyink2008; Chin et al.
Reference Chin, Philip, Klewicki, Ooi and Marusic2014). The peak locations of
 $\langle v\unicode[STIX]{x1D714}_{z}\rangle$
and
 $\langle -w\unicode[STIX]{x1D714}_{y}\rangle$
are similar, but the magnitude of the peaks for the APG TBL is greater than that for the ZPG TBL, indicating that the near-wall vortical motions are enhanced in the APG TBL. This observation accords with the increase in near-wall energy of the vorticities (figure 6) and in the r.m.s. values of the swirling strength in the APG TBL (Lee et al.
Reference Lee, Lee, Lee and Sung2010).
Profiles of (a)
 $\langle v\unicode[STIX]{x1D714}_{z}\rangle$
and (b)
 $\langle -w\unicode[STIX]{x1D714}_{y}\rangle$
. Pre-multiplied spanwise co-spectra of (c)
 $\langle v\unicode[STIX]{x1D714}_{z}\rangle$
and (d)
 $\langle -w\unicode[STIX]{x1D714}_{y}\rangle$
.

The two velocity–vorticity correlations can be expressed as the pre-multiplied spanwise co-spectra of
 $\langle v\unicode[STIX]{x1D714}_{z}\rangle (k_{z}\unicode[STIX]{x1D719}_{v\unicode[STIX]{x1D714}_{z}})$
and of
 $\langle -w\unicode[STIX]{x1D714}_{y}\rangle (k_{z}\unicode[STIX]{x1D719}_{-w\unicode[STIX]{x1D714}_{y}})$
by using the Fourier transform,
 $$\begin{eqnarray}\langle v\unicode[STIX]{x1D714}_{z}\rangle =\int _{0}^{\infty }k_{z}\unicode[STIX]{x1D719}_{v\unicode[STIX]{x1D714}_{z}}\,\text{d}\ln k_{z},\quad \langle -w\unicode[STIX]{x1D714}_{y}\rangle =\int _{0}^{\infty }k_{z}\unicode[STIX]{x1D719}_{-w\unicode[STIX]{x1D714}_{y}}\,\text{d}\ln k_{z}.\end{eqnarray}$$
Hence, the co-spectra represent the contributions from different spanwise wavelengths (
 $\unicode[STIX]{x1D706}_{z}$
). Figure 7(c,d) shows the pre-multiplied spanwise co-spectra
 $k_{z}\unicode[STIX]{x1D719}_{v\unicode[STIX]{x1D714}_{z}}$
and
 $k_{z}\unicode[STIX]{x1D719}_{-w\unicode[STIX]{x1D714}_{y}}$
, where the small scales
 $(\unicode[STIX]{x1D706}_{z}^{+}<400)$
below
 $y^{+}=100$
are dominant in both co-spectra. The values of the positive and negative peaks of
 $k_{z}\unicode[STIX]{x1D719}_{v\unicode[STIX]{x1D714}_{z}}$
are greater in the APG TBL, although the small-scale energy of
 $k_{z}\unicode[STIX]{x1D719}_{uu}$
near the wall is attenuated (figure 5
c). This implies that the AM influences of the LSMs on the vortical motions are related to the increase in the intensity of
 $k_{z}\unicode[STIX]{x1D719}_{v\unicode[STIX]{x1D714}_{z}}$
in the near-wall region. In addition, the positive values of the large scales
 $(\unicode[STIX]{x1D706}_{z}^{+}\geqslant 400)$
of
 $k_{z}\unicode[STIX]{x1D719}_{v\unicode[STIX]{x1D714}_{z}}$
increase around
 $60<y^{+}<300$
, and the negative values of those emerge near the boundary edge (figure 7
a). The enhanced positive values of
 $k_{z}\unicode[STIX]{x1D719}_{v\unicode[STIX]{x1D714}_{z}}$
by the LSMs contribute to the increase in the skin friction induced by
 $\langle v\unicode[STIX]{x1D714}_{z}\rangle$
(§ 3.3). The vortical motions of the large-scale
 $v\unicode[STIX]{x1D714}_{z}$
in the outer region are different from those of the small-scale
 $v\unicode[STIX]{x1D714}_{z}$
in the inner region. The physical interpretation of these results can be found in § 3.5.
Similar to
 $k_{z}\unicode[STIX]{x1D719}_{v\unicode[STIX]{x1D714}_{z}}$
, the value of the positive peak of
 $k_{z}\unicode[STIX]{x1D719}_{-w\unicode[STIX]{x1D714}_{y}}$
is significantly greater in the APG TBL. Near the boundary edge, a negative value of
 $k_{z}\unicode[STIX]{x1D719}_{-w\unicode[STIX]{x1D714}_{y}}$
is observed above
 $\unicode[STIX]{x1D706}_{z}^{+}=400$
. Furthermore, the contribution of the large scales
 $(\unicode[STIX]{x1D706}_{z}^{+}\geqslant 400)$
to
 $k_{z}\unicode[STIX]{x1D719}_{-w\unicode[STIX]{x1D714}_{y}}$
is greater than that of the ZPG TBL. The value of the LSMs of
 $k_{z}\unicode[STIX]{x1D719}_{-w\unicode[STIX]{x1D714}_{y}}$
increases near the wall, and their contribution to
 $k_{z}\unicode[STIX]{x1D719}_{-w\unicode[STIX]{x1D714}_{y}}$
is extended to the viscous sublayer (
 $y^{+}<5$
), representing that the superposition effects of the LSMs on the vortical motions of
 $\langle -w\unicode[STIX]{x1D714}_{y}\rangle$
are enhanced in the APG TBL. In particular, the large scales of
 $k_{z}\unicode[STIX]{x1D719}_{-w\unicode[STIX]{x1D714}_{y}}$
are remarkable near
 $y^{+}=200$
and observed up to
 $y^{+}=240$
.
The large scales above
 $y^{+}=100$
in the pre-multiplied streamwise co-spectra of
 $\langle -w\unicode[STIX]{x1D714}_{y}\rangle (k_{x}\unicode[STIX]{x1D719}_{-w\unicode[STIX]{x1D714}_{y}})$
emerge and increase as the increase in the Reynolds number (Chin et al.
Reference Chin, Philip, Klewicki, Ooi and Marusic2014), and those contribute to the increase in the large-scale accelerating motions
 $(\unicode[STIX]{x2202}\langle -uv\rangle /\unicode[STIX]{x2202}y>0)$
at higher Reynolds number. According to the scaling of Tennekes & Lumley (Reference Tennekes and Lumley1972),
 $\langle -w\unicode[STIX]{x1D714}_{y}\rangle$
can be expressed as
 $u^{\ast }(\unicode[STIX]{x2202}U/\unicode[STIX]{x2202}y)(\unicode[STIX]{x2202}l/\unicode[STIX]{x2202}y)$
, where
 $u^{\ast }$
and
 $l$
indicate the characteristic velocity and length scales and is associated with the change of eddy size (
 $\unicode[STIX]{x2202}l/\unicode[STIX]{x2202}y$
) with the vorticity of order
 $\unicode[STIX]{x2202}U/\unicode[STIX]{x2202}y$
. When the vortices are stretched, the energy of the mean flow is transferred to eddies, and then the velocity fluctuations perpendicular to the vorticity vector become strong. Hence, enhanced large scales over
 $y^{+}=100$
in
 $k_{x}\unicode[STIX]{x1D719}_{-w\unicode[STIX]{x1D714}_{y}}$
can be interpreted as the amplitude modulation (change of scale effect) of the small scales by the LSMs (Chin et al.
Reference Chin, Philip, Klewicki, Ooi and Marusic2014; Hwang et al.
Reference Hwang, Lee, Sung and Zaki2016b
). The presence of the APG results in the increase in the AM influences of the LSMs on the small scales (Harun et al.
Reference Harun, Monty, Mathis and Marusic2013). Thus, the increase in the large scales of
 $k_{z}\unicode[STIX]{x1D719}_{-w\unicode[STIX]{x1D714}_{y}}$
near
 $y^{+}=200$
could be attributed to the increase in the AM influences of the LSMs on the small scales.
3.3 Superposition effects of the large scales on the skin friction
In this section, we investigate the large-scale influences on the skin friction by quantifying the contributions of
 $\langle v\unicode[STIX]{x1D714}_{z}\rangle$
and
 $\langle -w\unicode[STIX]{x1D714}_{y}\rangle$
. Applying triple integration to the spanwise component of the mean vorticity equation,
 $C_{f}$
can be decomposed into five terms as follows (Yoon et al.
Reference Yoon, Ahn, Hwang and Sung2016a
):
 $$\begin{eqnarray}\displaystyle C_{f} & = & \displaystyle \underbrace{2\int _{0}^{1}\left(1-\frac{y}{\unicode[STIX]{x1D6FF}}\right)\frac{\langle v\unicode[STIX]{x1D714}_{z}\rangle }{U_{\infty }^{2}/\unicode[STIX]{x1D6FF}}\,\text{d}\frac{y}{\unicode[STIX]{x1D6FF}}}_{C_{f,1}}+\underbrace{2\int _{0}^{1}\left(1-\frac{y}{\unicode[STIX]{x1D6FF}}\right)\frac{\langle -w\unicode[STIX]{x1D714}_{y}\rangle }{U_{\infty }^{2}/\unicode[STIX]{x1D6FF}}\,\text{d}\frac{y}{\unicode[STIX]{x1D6FF}}}_{C_{f,2}}\nonumber\\ \displaystyle & & \displaystyle +\underbrace{\frac{\unicode[STIX]{x1D708}\unicode[STIX]{x1D6FF}}{U_{\infty }^{2}}\left.\frac{\unicode[STIX]{x2202}\unicode[STIX]{x1D6FA}_{z}}{\unicode[STIX]{x2202}y}\right|_{y=0}-\frac{2\unicode[STIX]{x1D708}}{U_{\infty }^{2}}\int _{0}^{1}\unicode[STIX]{x1D6FA}_{z}\,\text{d}\frac{y}{\unicode[STIX]{x1D6FF}}+\int _{0}^{1}\left(1-\frac{y}{\unicode[STIX]{x1D6FF}}\right)^{2}\frac{\langle I_{x}\rangle }{U_{\infty }^{2}/\unicode[STIX]{x1D6FF}^{2}}\,\text{d}\frac{y}{\unicode[STIX]{x1D6FF}}}_{C_{f,others}},\end{eqnarray}$$
where
 $\langle I_{x}\rangle =\unicode[STIX]{x2202}(U\unicode[STIX]{x1D6FA}_{z}+\langle u\unicode[STIX]{x1D714}_{z}\rangle -\langle w\unicode[STIX]{x1D714}_{x}\rangle )/\unicode[STIX]{x2202}x+\unicode[STIX]{x2202}(V\unicode[STIX]{x1D6FA}_{z})/\unicode[STIX]{x2202}y-\unicode[STIX]{x1D708}\unicode[STIX]{x2202}^{2}\unicode[STIX]{x1D6FA}_{z}/\unicode[STIX]{x2202}x^{2}$
is a streamwise-inhomogeneous term. The first and second terms (
 $C_{f,1}$
and
 $C_{f,2}$
) are the contributions of
 $\langle v\unicode[STIX]{x1D714}_{z}\rangle$
and
 $\langle -w\unicode[STIX]{x1D714}_{y}\rangle$
to the skin friction, respectively. The third and fourth terms are the contributions of the molecular diffusion at the wall and the molecular transfer due to the mean vorticity, respectively. The fifth term is the contribution of the spatial development in the streamwise direction. Note that
 $C_{f,others}$
in (3.2) is the sum of the last three terms.
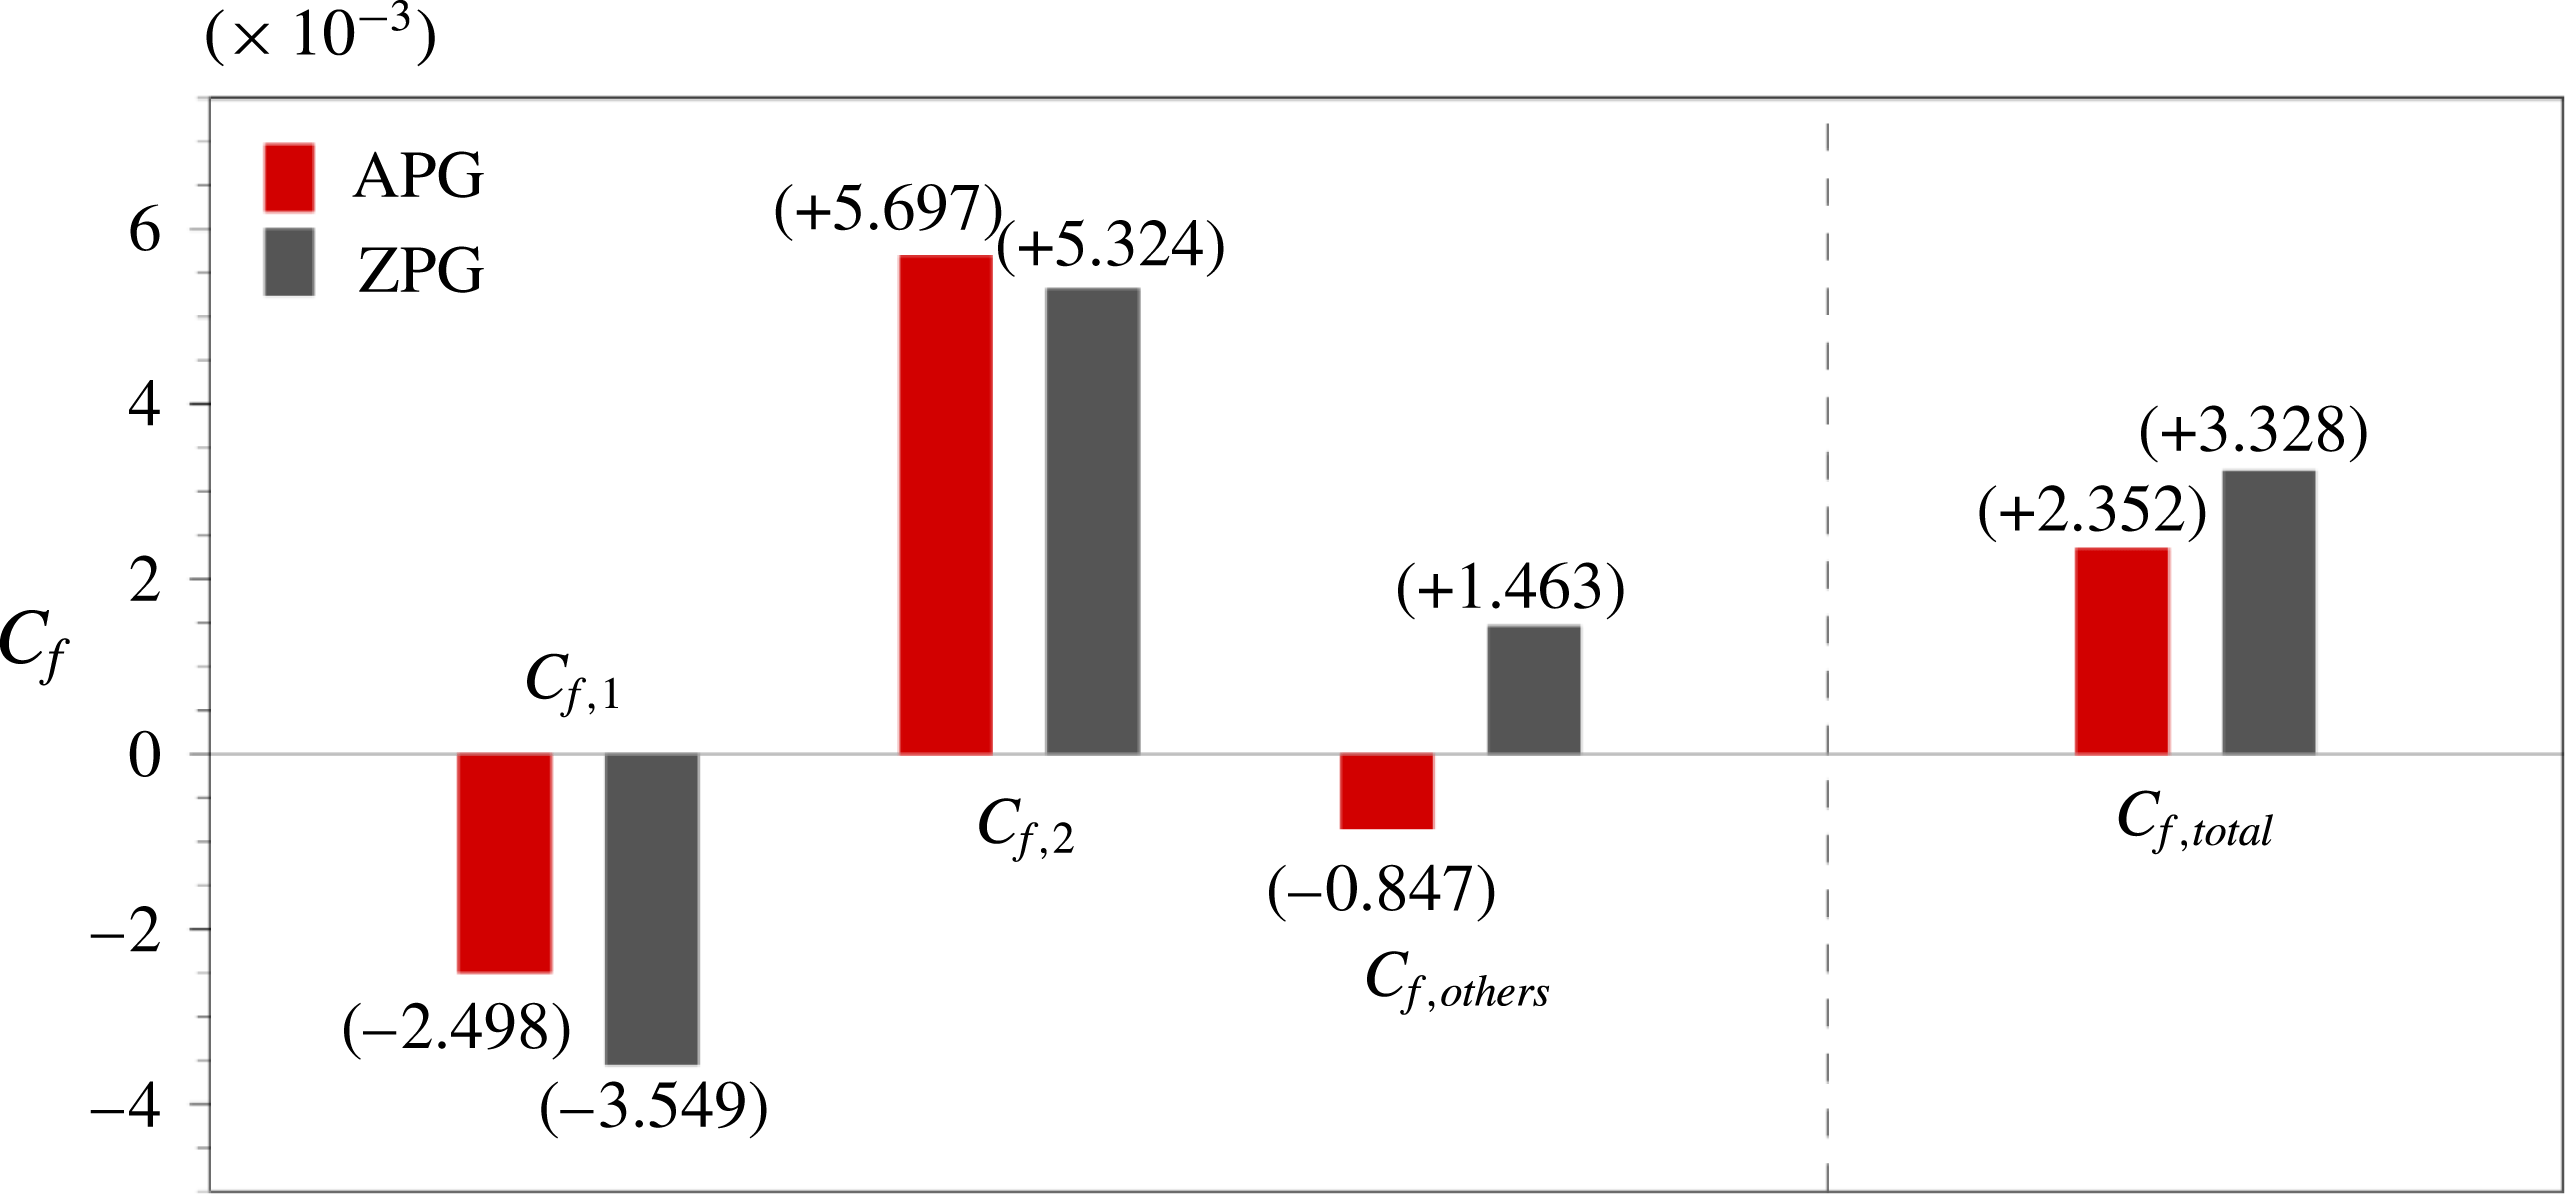
Figure 8 shows the decomposition of the skin friction coefficient according to (3.2). We found that
 $C_{f,1}$
and
 $C_{f,2}$
constitute the majority of the total
 $C_{f}$
. Accordingly, we focused on
 $C_{f,1}$
and
 $C_{f,2}$
in the present study.
 $C_{f,1}$
contributes to the decrease in the total skin friction (
 $C_{f,total}$
), while
 $C_{f,2}$
increases
 $C_{f,total}$
. The negative contribution of
 $C_{f,1}$
is lower in the APG TBL, whereas the positive contribution of
 $C_{f,2}$
is higher. This variation in
 $C_{f,1}$
and
 $C_{f,2}$
increases the total
 $C_{f}$
, but the total
 $C_{f}$
in the APG TBL is approximately 28 % lower than that in the ZPG TBL due to the negative contribution of
 $C_{f,others}$
. The third term
 $(\unicode[STIX]{x1D708}\unicode[STIX]{x1D6FF}/U_{\infty }^{2})(\unicode[STIX]{x2202}\unicode[STIX]{x1D6FA}_{z}/\unicode[STIX]{x2202}y)|_{y=0}$
is the main contributor to the negative value of
 $C_{f,others}$
. At the wall,
 $\unicode[STIX]{x2202}\unicode[STIX]{x1D6FA}_{z}/\unicode[STIX]{x2202}y$
(
 $=-\unicode[STIX]{x2202}^{2}U/\unicode[STIX]{x2202}y^{2}$
) is negative in the APG TBL due to the inflection point of the mean velocity profile close to the wall.
Decomposition of the skin friction coefficient.

To further explore the contributions of turbulent motions to
 $C_{f,1}$
and
 $C_{f,2}$
, we examined the pre-multiplied spanwise co-spectra of
 $\langle v\unicode[STIX]{x1D714}_{z}\rangle$
and
 $\langle -w\unicode[STIX]{x1D714}_{y}\rangle$
with the decomposition method of Yoon et al. (Reference Yoon, Ahn, Hwang and Sung2016a
). The two velocity–vorticity correlations in (3.2) are expressed in terms of the pre-multiplied spanwise co-spectra
 $k_{z}\unicode[STIX]{x1D719}_{v\unicode[STIX]{x1D714}_{z}}$
and
 $k_{z}\unicode[STIX]{x1D719}_{-w\unicode[STIX]{x1D714}_{y}}$
as shown in (3.1). Thus,
 $C_{f,1}$
and
 $C_{f,2}$
in (3.2) can be expressed as the spanwise co-spectra
 $\unicode[STIX]{x1D719}_{f,1}$
and
 $\unicode[STIX]{x1D719}_{f,2}$
,
 $$\begin{eqnarray}\left.\begin{array}{@{}c@{}}\displaystyle C_{f,1}=\int _{-\infty }^{0}\int _{0}^{\infty }yk_{z}\underbrace{2\left(1-\frac{y}{\unicode[STIX]{x1D6FF}}\right)\frac{\unicode[STIX]{x1D719}_{v\unicode[STIX]{x1D714}_{z}}}{U_{\infty }^{2}/\unicode[STIX]{x1D6FF}}}_{=\,\unicode[STIX]{x1D719}_{f,1}(k_{z},y)}\,\text{d}\ln k_{z}\,\text{d}\ln \frac{y}{\unicode[STIX]{x1D6FF}},\\ \displaystyle C_{f,2}=\int _{-\infty }^{0}\int _{0}^{\infty }yk_{z}\underbrace{2\left(1-\frac{y}{\unicode[STIX]{x1D6FF}}\right)\frac{\unicode[STIX]{x1D719}_{-w\unicode[STIX]{x1D714}_{y}}}{U_{\infty }^{2}/\unicode[STIX]{x1D6FF}}}_{=\,\unicode[STIX]{x1D719}_{f,2}(k_{z},y)}\,\text{d}\ln k_{z}\,\text{d}\ln \frac{y}{\unicode[STIX]{x1D6FF}}.\end{array}\!\!\right\}\end{eqnarray}$$
In addition, the difference in
 $yk_{z}\unicode[STIX]{x1D719}_{f,1}$
between the APG and ZPG TBLs can be calculated as
 $yk_{z}\unicode[STIX]{x0394}\unicode[STIX]{x1D719}_{f,1}=yk_{z}\unicode[STIX]{x1D719}_{f,1}|_{APG}-yk_{z}\unicode[STIX]{x1D719}_{f,1}|_{ZPG}$
, and
 $yk_{z}\unicode[STIX]{x0394}\unicode[STIX]{x1D719}_{f,2}=yk_{z}\unicode[STIX]{x1D719}_{f,2}|_{APG}-yk_{z}\unicode[STIX]{x1D719}_{f,2}|_{ZPG}$
for
 $C_{f,2}$
.
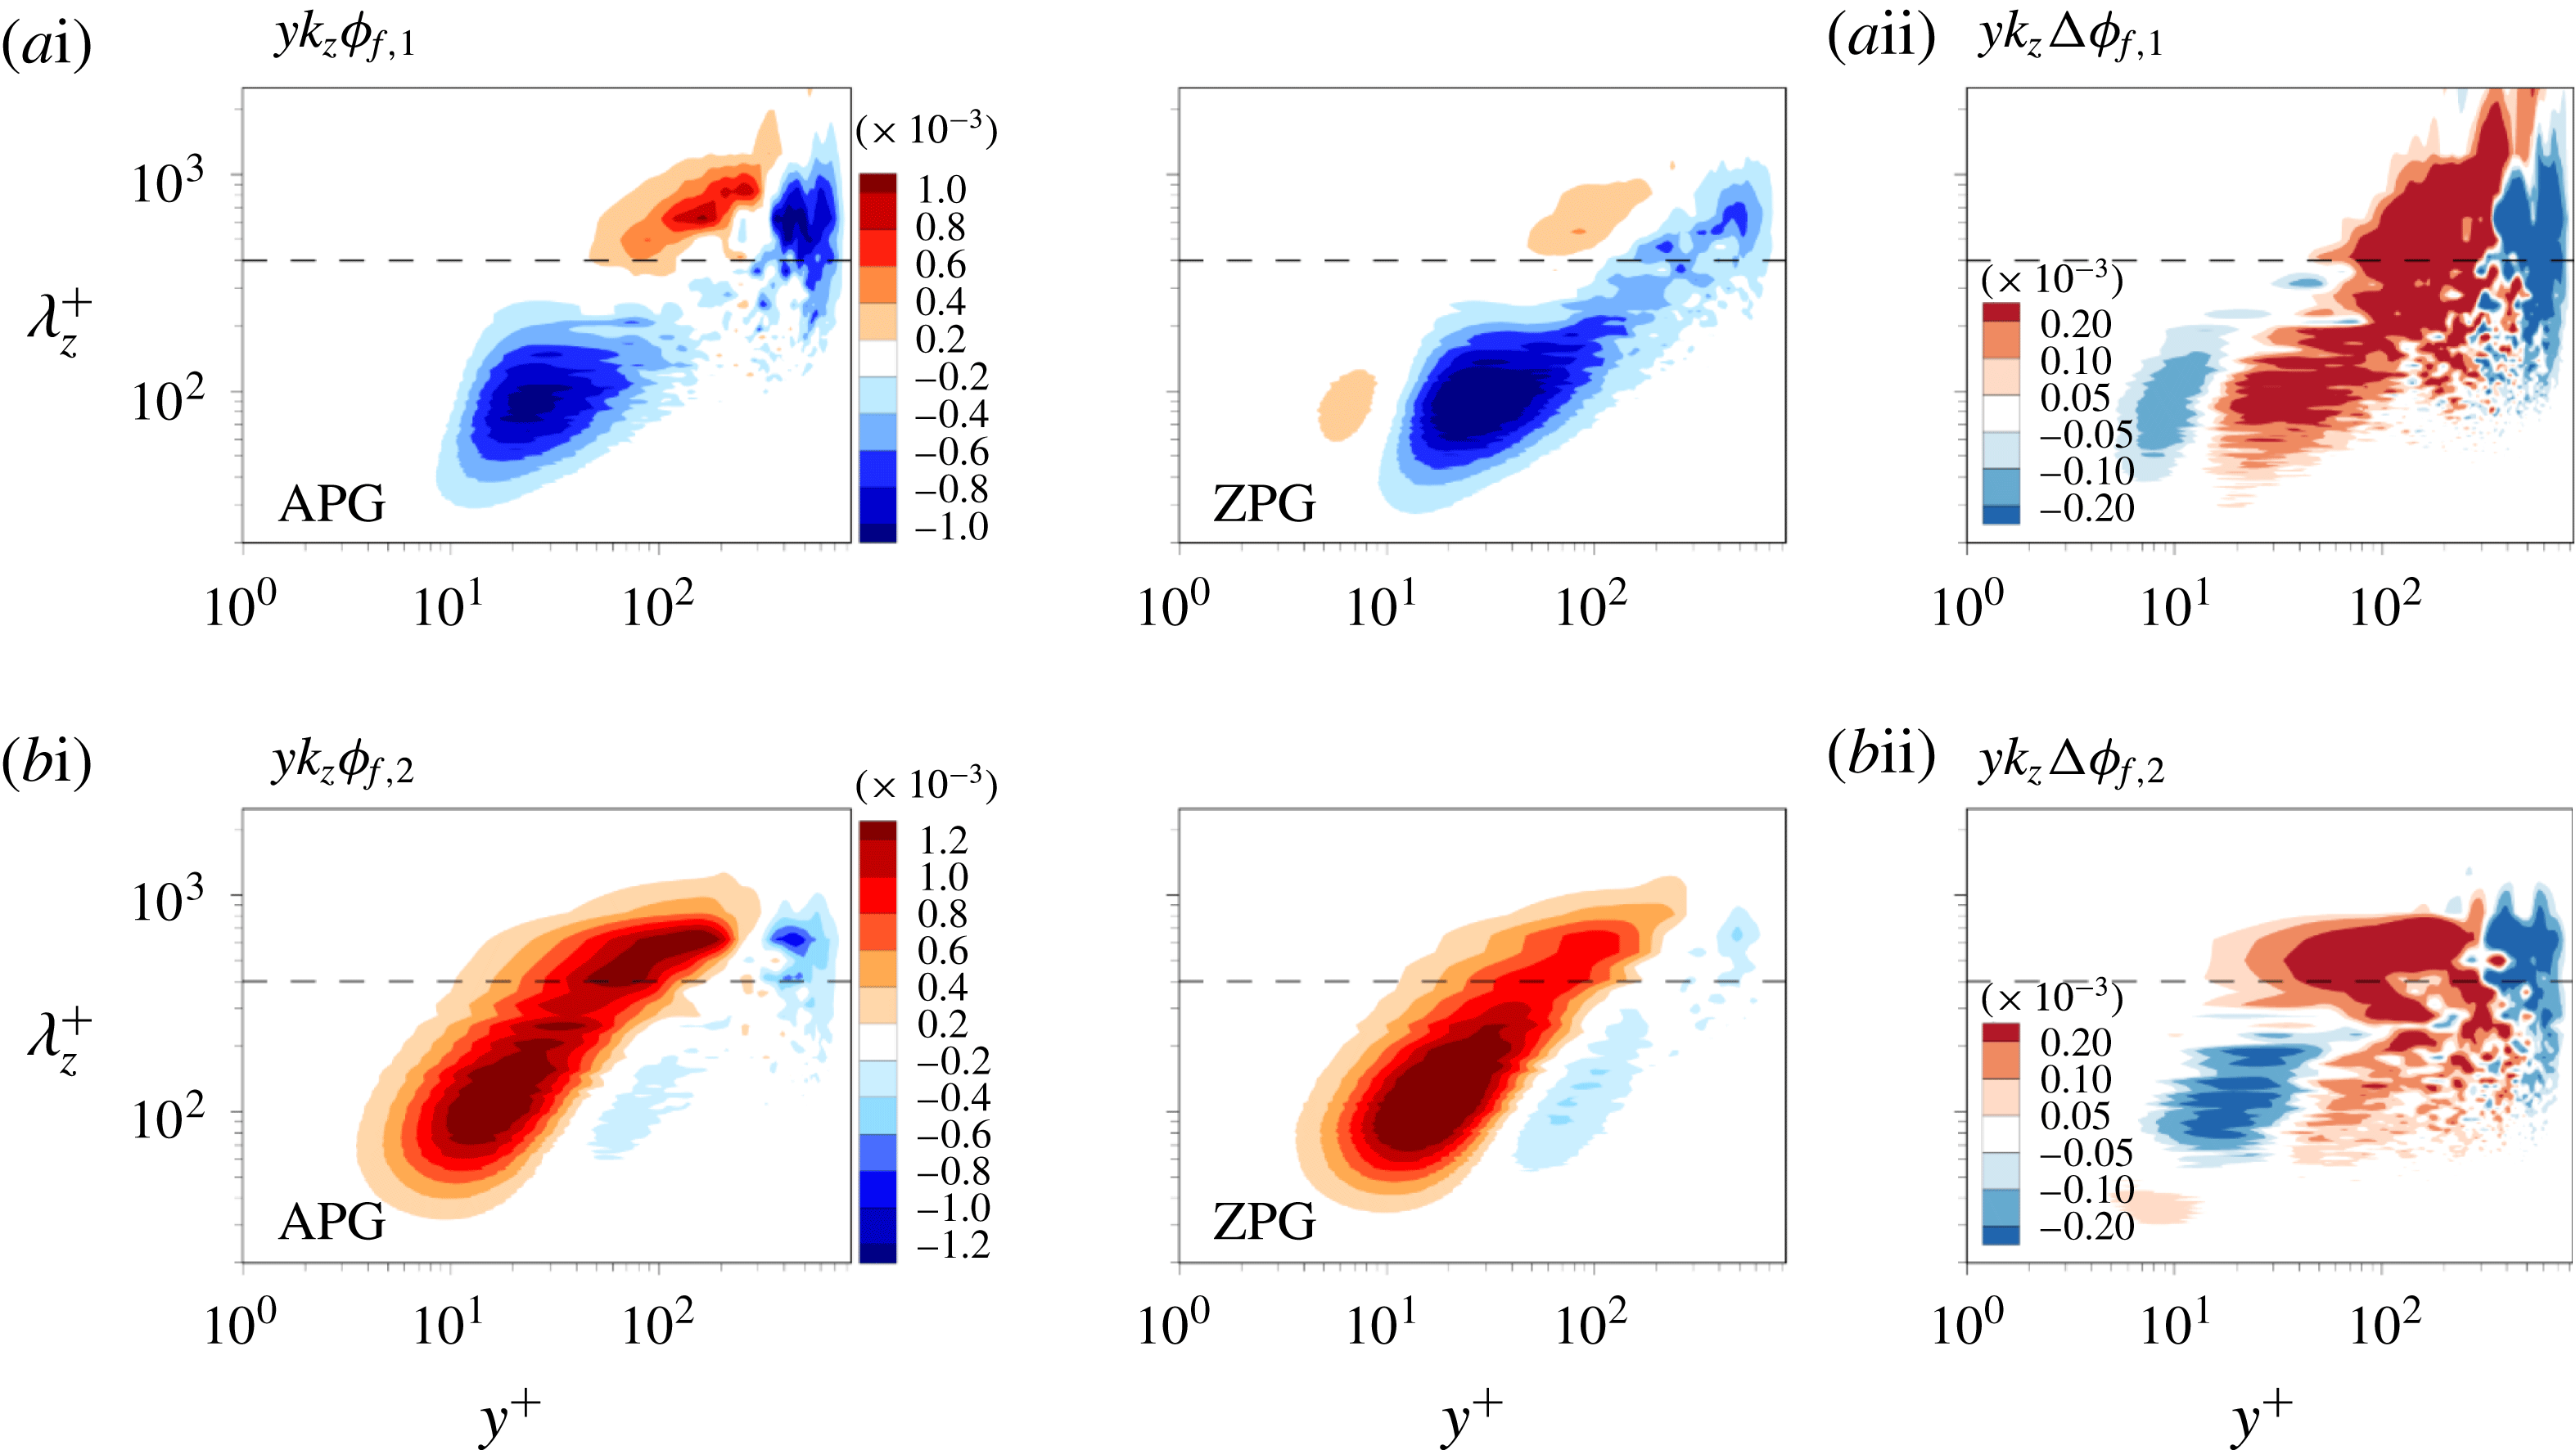
Figure 9(ai,bi) shows the pre-multiplied spanwise co-spectra
 $yk_{z}\unicode[STIX]{x1D719}_{f,1}$
and
 $yk_{z}\unicode[STIX]{x1D719}_{f,2}$
in the
 $\unicode[STIX]{x1D706}_{z}$
–
 $y$
plane on a logarithmic scale along the spanwise wavelength and the wall-normal location. Hence, these spectra show the local contribution of a given spanwise length scale to the skin friction. As shown in figure 7, the small scales are dominant in
 $k_{z}\unicode[STIX]{x1D719}_{v\unicode[STIX]{x1D714}_{z}}$
and
 $k_{z}\unicode[STIX]{x1D719}_{-w\unicode[STIX]{x1D714}_{y}}$
below
 $y^{+}=100$
. However, the high value of the small scales is not connected to their dominant contribution to the skin friction. In figure 9(ai), the positive contribution of
 $\langle v\unicode[STIX]{x1D714}_{z}\rangle$
to the skin friction near the wall (
 $y^{+}\approx 6$
) is significantly reduced compared to
 $k_{z}\unicode[STIX]{x1D719}_{v\unicode[STIX]{x1D714}_{z}}$
, while the contribution of the outer large scales to the skin friction increases. The negative values of
 $yk_{z}\unicode[STIX]{x1D719}_{f,1}$
carried by the small scales with
 $\unicode[STIX]{x1D706}_{z}^{+}\approx 90$
near
 $y^{+}=25$
and the large scales with
 $\unicode[STIX]{x1D706}_{z}^{+}\approx 600$
near
 $y^{+}=400$
induce the negative contribution to
 $C_{f,1}$
. For
 $yk_{z}\unicode[STIX]{x1D719}_{f,2}$
, the small scales with
 $\unicode[STIX]{x1D706}_{z}^{+}\approx 100$
near
 $y^{+}=15$
and the large scales with
 $\unicode[STIX]{x1D706}_{z}^{+}\approx 600$
near
 $y^{+}=100$
make dominant contribution to the increase in
 $C_{f,2}$
.
The negative value of
 $yk_{z}\unicode[STIX]{x1D719}_{f,1}$
at
 $\unicode[STIX]{x1D706}_{z}^{+}=90$
and
 $y^{+}=25$
and the positive value of
 $yk_{z}\unicode[STIX]{x1D719}_{f,2}$
at
 $\unicode[STIX]{x1D706}_{z}^{+}=100$
and
 $y^{+}=15$
are 21.0 % and 17.6 % lower than those in the ZPG TBL. As shown in figure 9(ai), the largest positive and negative values of
 $yk_{z}\unicode[STIX]{x1D719}_{f,1}$
are observed at
 $\unicode[STIX]{x1D706}_{z}^{+}=640$
and
 $y^{+}=160$
and at
 $\unicode[STIX]{x1D706}_{z}^{+}=615$
and
 $y^{+}=420$
, respectively, and their values are 10.8 and 2.0 times larger than those for the ZPG TBL. For
 $yk_{z}\unicode[STIX]{x1D719}_{f,2}$
, an outer peak with a positive value arises at
 $\unicode[STIX]{x1D706}_{z}^{+}=620$
and
 $y^{+}=150$
in the APG TBL, whereas no outer peak is observed in the ZPG TBL. The presence of the outer peak in
 $yk_{z}\unicode[STIX]{x1D719}_{f,2}$
results from the increase in the large scales and in the extension of the large-scale influences of
 $k_{z}\unicode[STIX]{x1D719}_{-w\unicode[STIX]{x1D714}_{y}}$
as shown in figure 7. The superposition effects of the large scales on the skin friction are stronger in the APG TBL, especially on the skin friction induced by
 $\langle -w\unicode[STIX]{x1D714}_{y}\rangle$
. Figure 9(aii,bii) shows the difference in
 $yk_{z}\unicode[STIX]{x1D719}_{f,1}$
and
 $yk_{z}\unicode[STIX]{x1D719}_{f,2}$
. A positive region at
 $\unicode[STIX]{x1D706}_{z}^{+}\approx 600$
in the outer region indicates that the large scales contribute to the increase in
 $C_{f,1}$
and
 $C_{f,2}$
. In particular, the positive region in figure 9(bii) is extended up to
 $y^{+}=20$
, representing that the superposition effects of the large scales on the skin friction are dominant in
 $C_{f,2}$
.
Pre-multiplied spanwise co-spectra of the weighted velocity–vorticity correlations for (ai)
 $C_{f,1}$
and (bi)
 $C_{f,2}$
. (aii)
 $yk_{z}\unicode[STIX]{x0394}\unicode[STIX]{x1D719}_{f,1}=yk_{z}\unicode[STIX]{x1D719}_{f,1}|_{APG}-yk_{z}\unicode[STIX]{x1D719}_{f,1}|_{ZPG}$
and (bii)
 $yk_{z}\unicode[STIX]{x0394}\unicode[STIX]{x1D719}_{f,2}=yk_{z}\unicode[STIX]{x1D719}_{f,2}|_{APG}-yk_{z}\unicode[STIX]{x1D719}_{f,2}|_{ZPG}$
. The black dashed line indicates the cutoff wavelength,
 $\unicode[STIX]{x1D706}_{z,c}^{+}=400$
.

To further explore the large- and small-scale influences of
 $\langle v\unicode[STIX]{x1D714}_{z}\rangle$
and
 $\langle -w\unicode[STIX]{x1D714}_{y}\rangle$
on the skin friction,
 $C_{f,1}$
and
 $C_{f,2}$
were decomposed into large- and small-scale contributions by integration of the enclosed area of each pre-multiplied spanwise co-spectrum in figure 9(ai,bi),
 $$\begin{eqnarray}\displaystyle \left.\begin{array}{@{}c@{}}\displaystyle C_{f,1}^{L}=\int _{-\infty }^{0}\int _{0}^{k_{z,c}}2y\left(1-\frac{y}{\unicode[STIX]{x1D6FF}}\right)\frac{\unicode[STIX]{x1D719}_{v\unicode[STIX]{x1D714}_{z}}}{U_{\infty }^{2}/\unicode[STIX]{x1D6FF}}\,\text{d}k_{z}\,\text{d}\ln \frac{y}{\unicode[STIX]{x1D6FF}},\\ \displaystyle C_{f,1}^{S}=\int _{-\infty }^{0}\int _{k_{z,c}}^{\infty }2y\left(1-\frac{y}{\unicode[STIX]{x1D6FF}}\right)\frac{\unicode[STIX]{x1D719}_{v\unicode[STIX]{x1D714}_{z}}}{U_{\infty }^{2}/\unicode[STIX]{x1D6FF}}\,\text{d}k_{z}\,\text{d}\ln \frac{y}{\unicode[STIX]{x1D6FF}},\end{array}\!\!\right\} & & \displaystyle\end{eqnarray}$$
 $$\begin{eqnarray}\displaystyle \left.\begin{array}{@{}c@{}}\displaystyle C_{f,2}^{L}=\int _{-\infty }^{0}\int _{0}^{k_{z,c}}2y\left(1-\frac{y}{\unicode[STIX]{x1D6FF}}\right)\frac{\unicode[STIX]{x1D719}_{-w\unicode[STIX]{x1D714}_{y}}}{U_{\infty }^{2}/\unicode[STIX]{x1D6FF}}\,\text{d}k_{z}\,\text{d}\ln \frac{y}{\unicode[STIX]{x1D6FF}},\\ \displaystyle C_{f,2}^{S}=\int _{-\infty }^{0}\int _{k_{z,c}}^{\infty }2y\left(1-\frac{y}{\unicode[STIX]{x1D6FF}}\right)\frac{\unicode[STIX]{x1D719}_{-w\unicode[STIX]{x1D714}_{y}}}{U_{\infty }^{2}/\unicode[STIX]{x1D6FF}}\,\text{d}k_{z}\,\text{d}\ln \frac{y}{\unicode[STIX]{x1D6FF}},\end{array}\!\!\right\} & & \displaystyle\end{eqnarray}$$
where
 $k_{z,c}$
is a cutoff wavenumber
 $(k_{z,c}=2\unicode[STIX]{x03C0}/\unicode[STIX]{x1D706}_{z,c},\unicode[STIX]{x1D706}_{z,c}^{+}=400)$
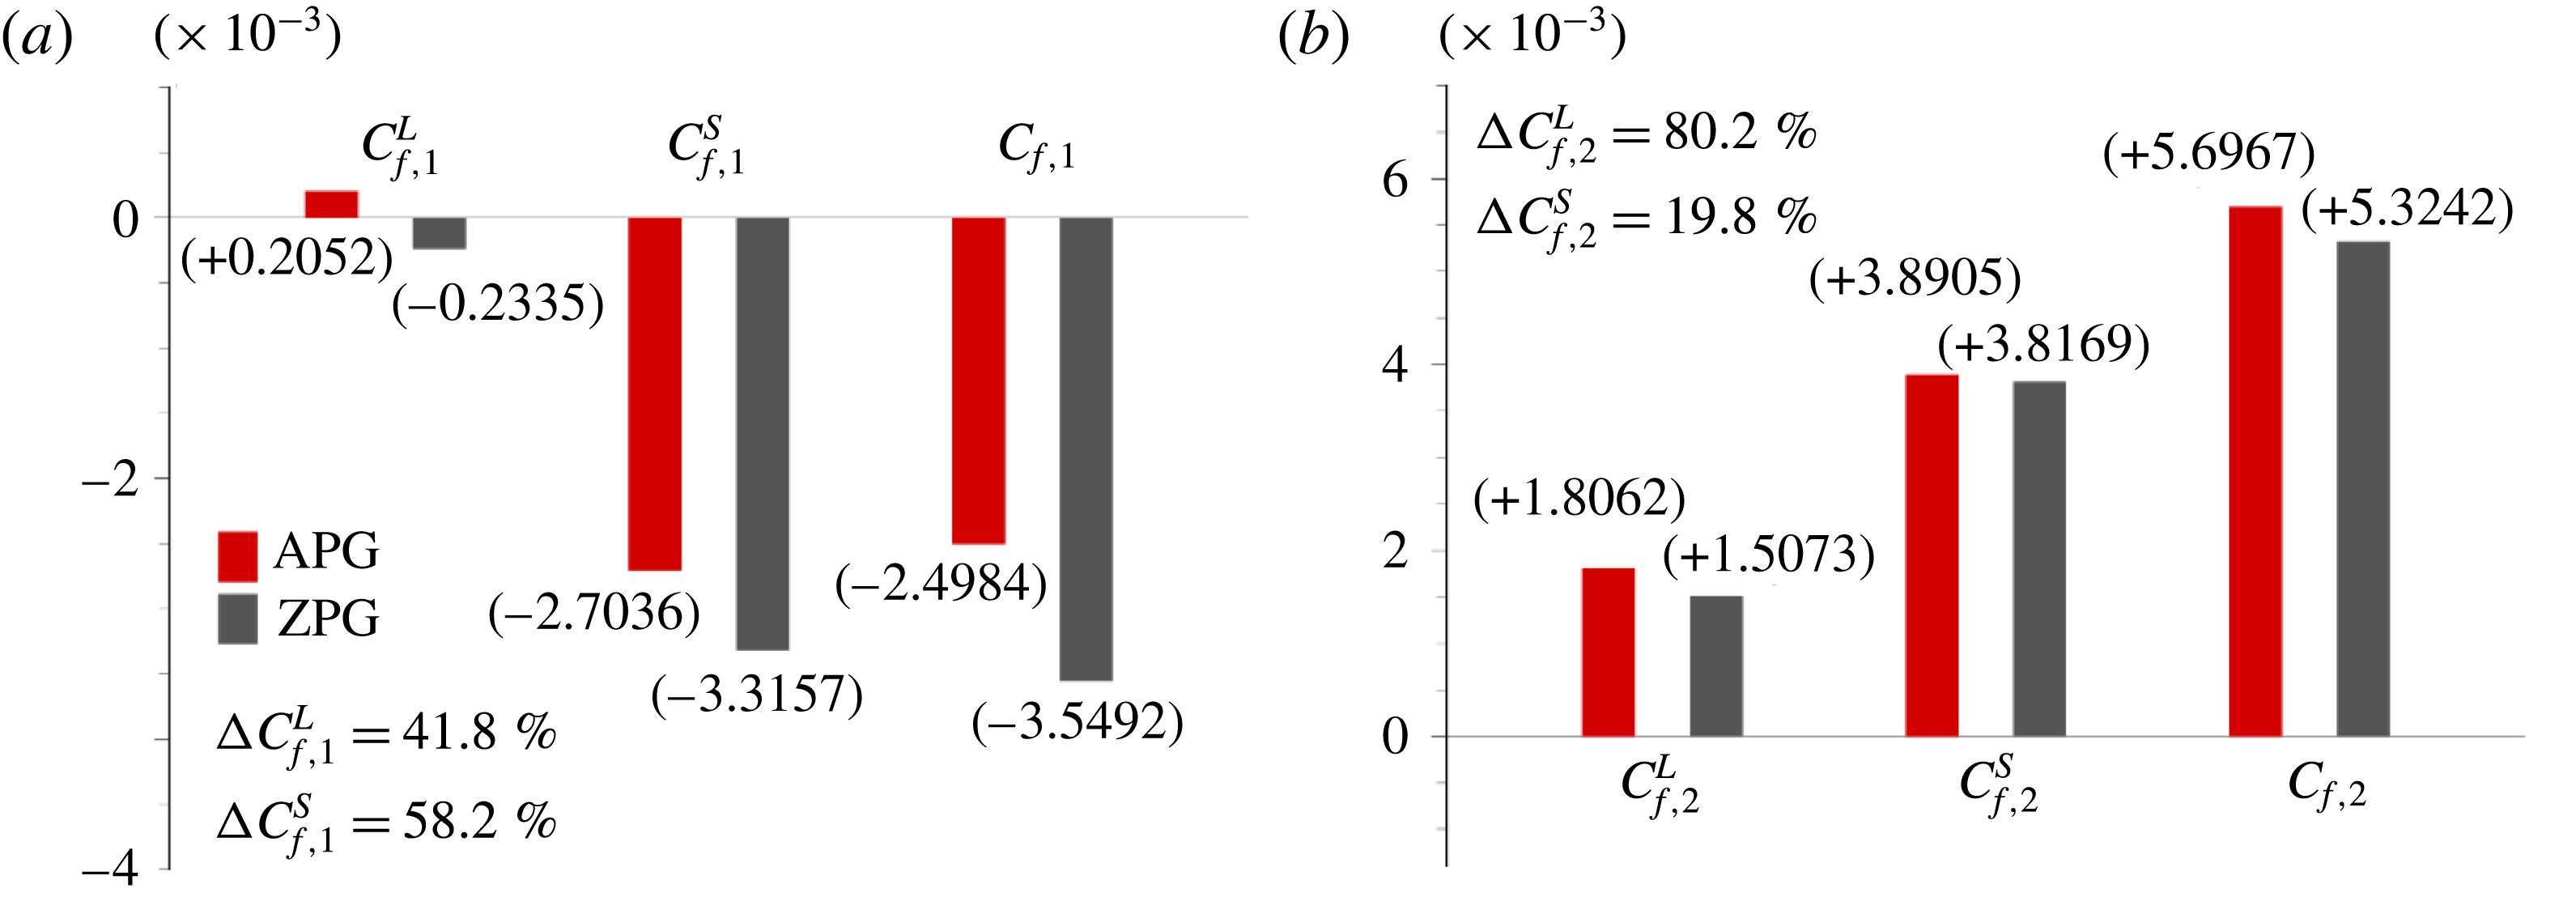
. Figure 10 illustrates bar graphs representing the decomposition of
 $C_{f,1}$
and
 $C_{f,2}$
into large and small scales. The skin friction coefficient induced by
 $\langle v\unicode[STIX]{x1D714}_{z}\rangle$
(
 $C_{f,1}$
) can be obtained as the sum of
 $C_{f,1}^{L}$
and
 $C_{f,1}^{S}$
, likewise for
 $C_{f,2}$
.
 $C_{f,1}$
mostly comes from the small scales, which are dominant in the buffer region and the logarithmic region, due to the cancellation of the positive and negative contributions of the large scales (figure 9
ai). In the APG TBL
 $,C_{f,1}^{L}$
has a positive value resulted from the enhanced large scales
 $(\unicode[STIX]{x1D706}_{z}^{+}\geqslant 400)$
, which have a positive value near
 $y^{+}=100$
(figure 9
ai).
 $C_{f,2}^{L}$
and
 $C_{f,2}^{S}$
are the main contributors to the positive values of
 $C_{f,2}$
in the inner and outer regions, respectively (figure 9
bi).
To measure how much each scale contributes to the difference in
 $C_{f,1}$
or
 $C_{f,2}$
between the APG TBL and ZPG TBL,
 $\unicode[STIX]{x0394}C_{f,i}^{L}$
and
 $\unicode[STIX]{x0394}C_{f,i}^{S}$
are calculated in percentage form and presented in figure 10,
 $$\begin{eqnarray}\left.\begin{array}{@{}c@{}}\displaystyle \unicode[STIX]{x0394}C_{f,i}^{L}[\%]=\frac{C_{f,i}^{L}|_{APG}-C_{f,i}^{L}|_{ZPG}}{C_{f,i}|_{APG}-C_{f,i}|_{ZPG}}\times 100,\\ \displaystyle \unicode[STIX]{x0394}C_{f,i}^{S}[\%]=\frac{C_{f,i}^{S}|_{APG}-C_{f,i}^{S}|_{ZPG}}{C_{f,i}|_{APG}-C_{f,i}|_{ZPG}}\times 100\;(i=1,2).\end{array}\!\!\right\}\end{eqnarray}$$
The contributions of the large and small scales to the difference in
 $C_{f,1}$
between the APG and ZPG TBLs (
 $\unicode[STIX]{x0394}C_{f,1}^{L}$
and
 $\unicode[STIX]{x0394}C_{f,1}^{S}$
) are 41.8 % and 58.2 %, respectively. On the other hand, the large scales contribute dominantly to the difference in
 $C_{f,2}\;(\unicode[STIX]{x0394}C_{f,2}^{L}=80.2\,\%)$
, which shows the dominance of the superimposed large scales on the skin friction via
 $C_{f,2}$
.
Decomposition of
 $C_{f,1}$
and
 $C_{f,2}$
into the large and small scales.

3.4 Conditional sampling of the large-scale motions
To examine the variation in the AM of the vortical motions with the strength of the LSMs, the procedures used in Ganapathisubramani et al. (Reference Ganapathisubramani, Hutchins, Monty, Chung and Marusic2012) and Hwang & Sung (Reference Hwang and Sung2017) were adopted to perform the conditional sampling of the amplitudes of
 $\langle v\unicode[STIX]{x1D714}_{z}\rangle$
and
 $\langle -w\unicode[STIX]{x1D714}_{y}\rangle$
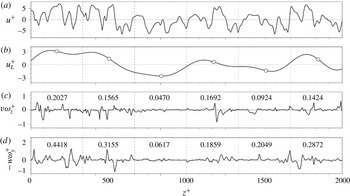
. Figure 11 shows an example of the signals at
 $y^{+}=15$
. First, the large-scale streamwise velocity fluctuations (
 $u_{L}$
) were separated from the streamwise velocity fluctuations (
 $u$
) by using a long-wavelength-pass filter with
 $\unicode[STIX]{x1D706}_{z,c}^{+}=400$
. Figure 11(a,b) shows the signals for
 $u$
and
 $u_{L}$
, respectively. Second, fluctuating signals were divided into individual segments of
 $400\unicode[STIX]{x1D6FF}^{+}$
, which corresponds to the cutoff wavelength. The vertical dashed lines mark the boundaries of each segment. The circle inserted in figure 11(b) indicates the value of
 $u_{L}^{+}$
at the centre of each segment, which is the representative of each segment. The bin size of
 $u_{L}^{+}$
in the conditional sampling of the LSMs was set to 0.2 (Ganapathisubramani et al.
Reference Ganapathisubramani, Hutchins, Monty, Chung and Marusic2012; Hwang & Sung Reference Hwang and Sung2017). Third, the mean values of all signals were averaged over each segment as functions of
 $u_{L}^{+}$
and
 $y$
. Instantaneous fluctuating signals of
 $v\unicode[STIX]{x1D714}_{z}$
and
 $-w\unicode[STIX]{x1D714}_{y}$
are shown in figure 11(c,d). Here, the inserted numbers are the r.m.s. values of the velocity–vorticity correlations for each segment. The r.m.s. values of
 $v\unicode[STIX]{x1D714}_{z}$
and
 $-w\unicode[STIX]{x1D714}_{y}$
are lower under the negative-
 $u_{L}$
events than under the positive-
 $u_{L}$
events, representing that the LSMs could modulate the amplitude of the velocity–vorticity correlations in the near-wall region.
Signals for (a) the streamwise velocity fluctuations, (b) the large-scale streamwise velocity fluctuations (
 $u_{L}$
) and the velocity–vorticity correlations of (c) the wall-normal velocity and the spanwise vorticity fluctuations
 $(v\unicode[STIX]{x1D714}_{z})$
, and of (d) the spanwise velocity and the wall-normal vorticity fluctuations
 $(-w\unicode[STIX]{x1D714}_{y})$
at
 $y^{+}=15$
. The vertical dashed lines show the segment boundaries. The circles in (b) indicate representative values of
 $u_{L}^{+}$
in each segment, and the numbers in (c,d) indicate the r.m.s. values averaged in each segment.

First of all, we examine the population of
 $u_{L}$
by determining the probability density function (PDF) of
 $u_{L}$
across the
 $y$
direction,
 $N(u_{L},y)/\int N(u_{L},y)\,\text{d}u_{L}$
, where
 $N(u_{L},y)$
is the number of samples at given
 $u_{L}$
and
 $y$
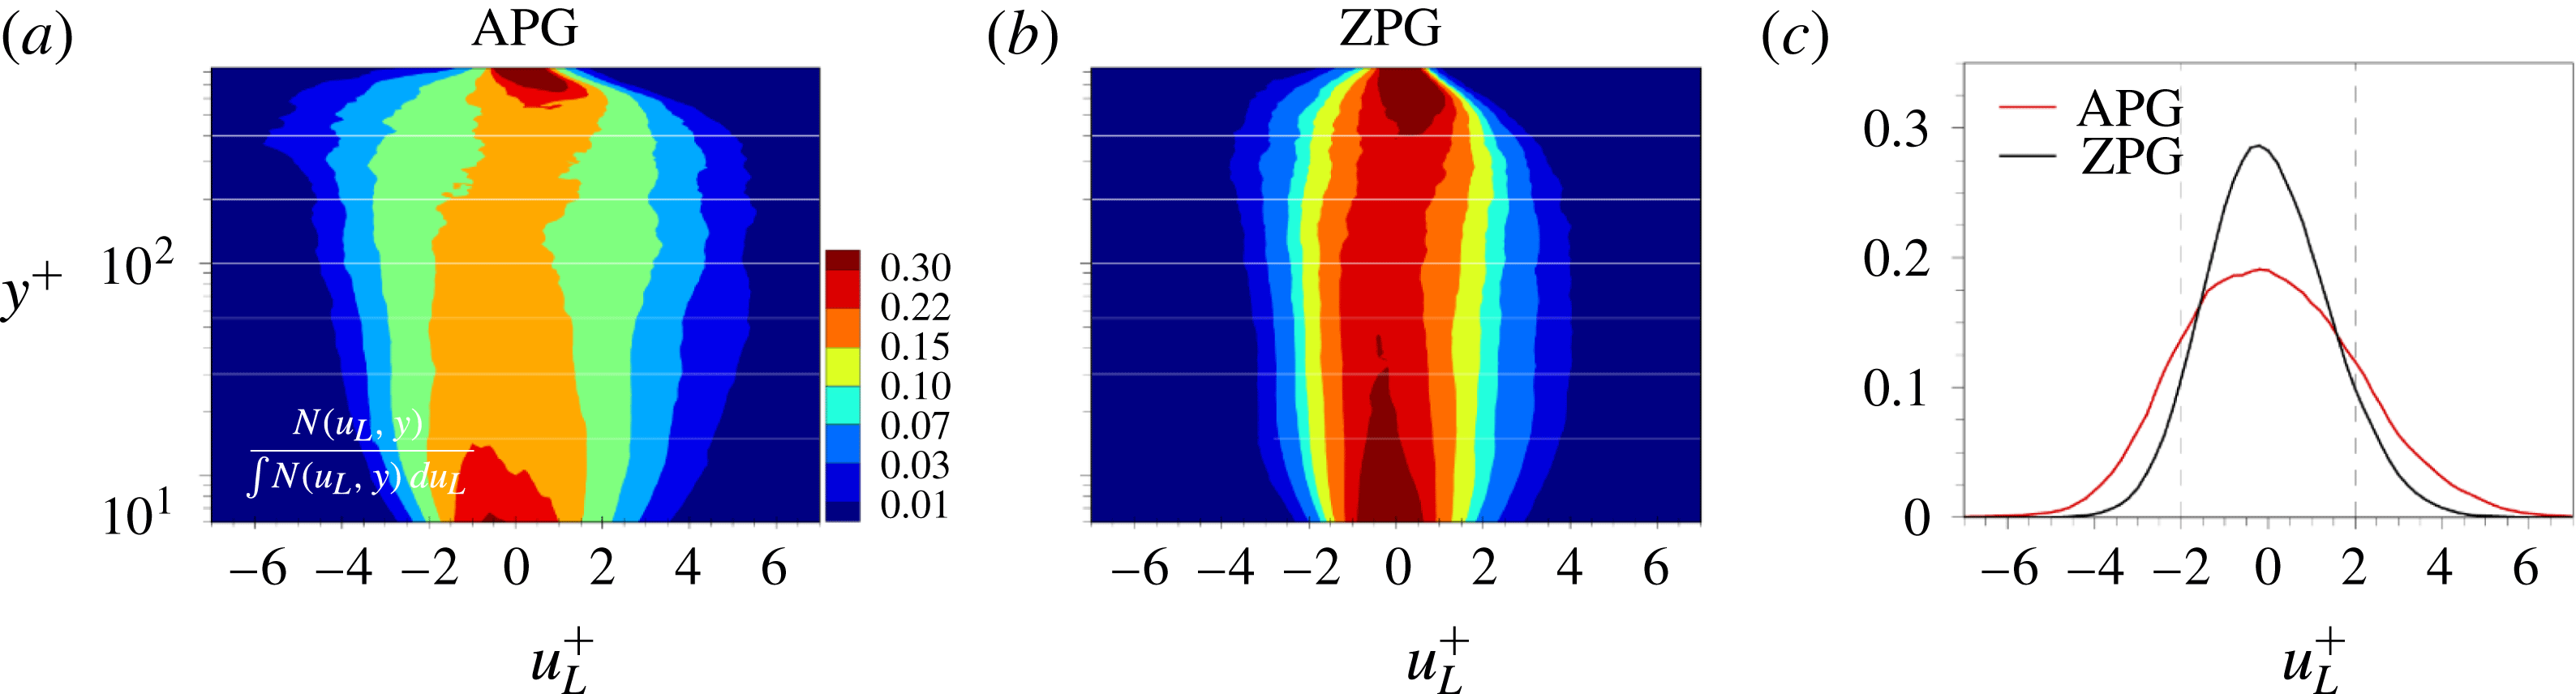
. Figure 12(a,b) displays the PDFs of
 $u_{L}$
in the APG and ZPG TBLs, respectively. Near the wall and the boundary layer edge, high probability values are evident in the vicinity of
 $u_{L}^{+}=0$
, which indicates that the distribution of
 $u_{L}$
is narrow. Small-scale fluctuations are dominant in the near-wall region and near the boundary layer edge. The PDFs of
 $u_{L}$
for both TBLs contain a peak in the vicinity of
 $u_{L}^{+}=0$
and decrease with increasing
 $|u_{L}^{+}|$
. For the APG TBL, the PDF of
 $u_{L}$
is widely distributed with a relatively higher magnitude of
 $|u_{L}^{+}|$
. As shown in figure 12(a,b), strong LSMs with
 $|u_{L}^{+}|=6$
are observed only in the APG TBL. These are consistent with the isosurfaces of
 $u$
in figure 2 and the pre-multiplied spanwise energy spectra of
 $u$
in figure 5. In addition, the population of
 $u_{L}$
near the wall is wider in the APG TBL, indicating that the footprints of the LSMs are dominant in the APG TBL.
Figure 12(c) shows the averaged PDF of
 $u_{L}$
at six wall-normal locations:
 $y^{+}=15$
, 30, 55, 100, 200 and 400. The PDFs of
 $u_{L}$
for both TBLs are almost symmetric with respect to
 $u_{L}^{+}=0$
. The vertical dashed lines in figure 12(c) mark
 $u_{L}^{+}=\pm 2$
, where the PDF of
 $u_{L}$
is half of the value at
 $u_{L}^{+}=0$
. In particular, the PDFs of
 $u_{L}$
cross at
 $u_{L}^{+}=\pm \,2$
, indicating that intense negative- and positive-
 $u_{L}$
events (
 $u_{L}^{+}\leqslant -2$
and
 $u_{L}^{+}\geqslant +2$
) frequently occur in the APG TBL whereas the population of relatively weak
 $u_{L}$
events
 $(-2<u_{L}^{+}<+2)$
is reduced. The higher values of the PDFs for
 $u_{L}^{+}\leqslant -2$
and
 $u_{L}^{+}\geqslant +2$
are the reminiscent of the increase in the outer large-scale energy in the pre-multiplied spanwise energy spectra of
 $u$
(figure 5).
The PDFs of
 $u_{L}$
with respect to
 $y^{+}$
and strength of
 $u_{L}$
in (a) the APG TBL and (b) the ZPG TBL. (c) Averaged profiles of the population of
 $u_{L}$
. Vertical dashed lines indicate
 $u_{L}^{+}=\pm 2$
.

3.5 The influence of the large scales on the skin friction
To assess the influences of the LSMs on
 $C_{f,1}$
and
 $C_{f,2}$
,
 $\langle v\unicode[STIX]{x1D714}_{z}\rangle$
and
 $\langle -w\unicode[STIX]{x1D714}_{y}\rangle$
were conditionally averaged as functions of
 $u_{L}$
and
 $y$
,
 $$\begin{eqnarray}\langle v\unicode[STIX]{x1D714}_{z}|_{u_{L}}\rangle =\left\langle \sum v\unicode[STIX]{x1D714}_{z}|_{u_{L}}\right\rangle \bigg/N_{u_{L}}(u_{L},y),\quad \langle -w\unicode[STIX]{x1D714}_{y}|_{u_{L}}\rangle =\left\langle \sum -w\unicode[STIX]{x1D714}_{y}|_{u_{L}}\right\rangle \bigg/N_{u_{L}}(u_{L},y).\end{eqnarray}$$
To enhance the convergence of the conditional average, we discarded the data for any bin of
 $u_{L}^{+}$
if the number of samples in that bin did not exceed a minimum standard. This was set as 750 samples per bin for the APG TBL and as 600 samples per bin for the ZPG TBL. The difference between the minimum standards of the APG and ZPG TBLs arises from the difference between their number of grid points in
 $x^{\prime }$
. The contributions of the modulated vortical motions to the skin frictions
 $\langle C_{f,1}|_{u_{L}}\rangle$
and
 $\langle C_{f,2}|_{u_{L}}\rangle$
were obtained through the integration of (3.2) and (3.7) on a semi-log scale,
 $$\begin{eqnarray}\left.\begin{array}{@{}c@{}}\displaystyle \langle C_{f,1}|_{u_{L}}\rangle =\int _{0}^{1}\underbrace{2y\left(1-\frac{y}{\unicode[STIX]{x1D6FF}}\right)\frac{\langle v\unicode[STIX]{x1D714}_{z}|_{u_{L}}\rangle }{U_{\infty }^{2}/\unicode[STIX]{x1D6FF}}}_{\unicode[STIX]{x1D701}_{f,1}(u_{L},y)}\,\text{d}\ln \frac{y}{\unicode[STIX]{x1D6FF}},\\ \displaystyle \langle C_{f,2}|_{u_{L}}\rangle =\int _{0}^{1}\underbrace{2y\left(1-\frac{y}{\unicode[STIX]{x1D6FF}}\right)\frac{\langle -w\unicode[STIX]{x1D714}_{y}|_{u_{L}}\rangle }{U_{\infty }^{2}/\unicode[STIX]{x1D6FF}}}_{\unicode[STIX]{x1D701}_{f,2}(u_{L},y)}\,\text{d}\ln \frac{y}{\unicode[STIX]{x1D6FF}}.\end{array}\!\!\right\}\end{eqnarray}$$
Hence, the summation of
 $\langle C_{f,i}|_{u_{L}}\rangle$
over
 $u_{L}$
is equal to
 $C_{f,i}$
in figure 8,
 $\sum _{u_{L}}\langle C_{f,i}|_{u_{L}}\rangle =C_{f,i}$
(
 $i=1$
, 2).
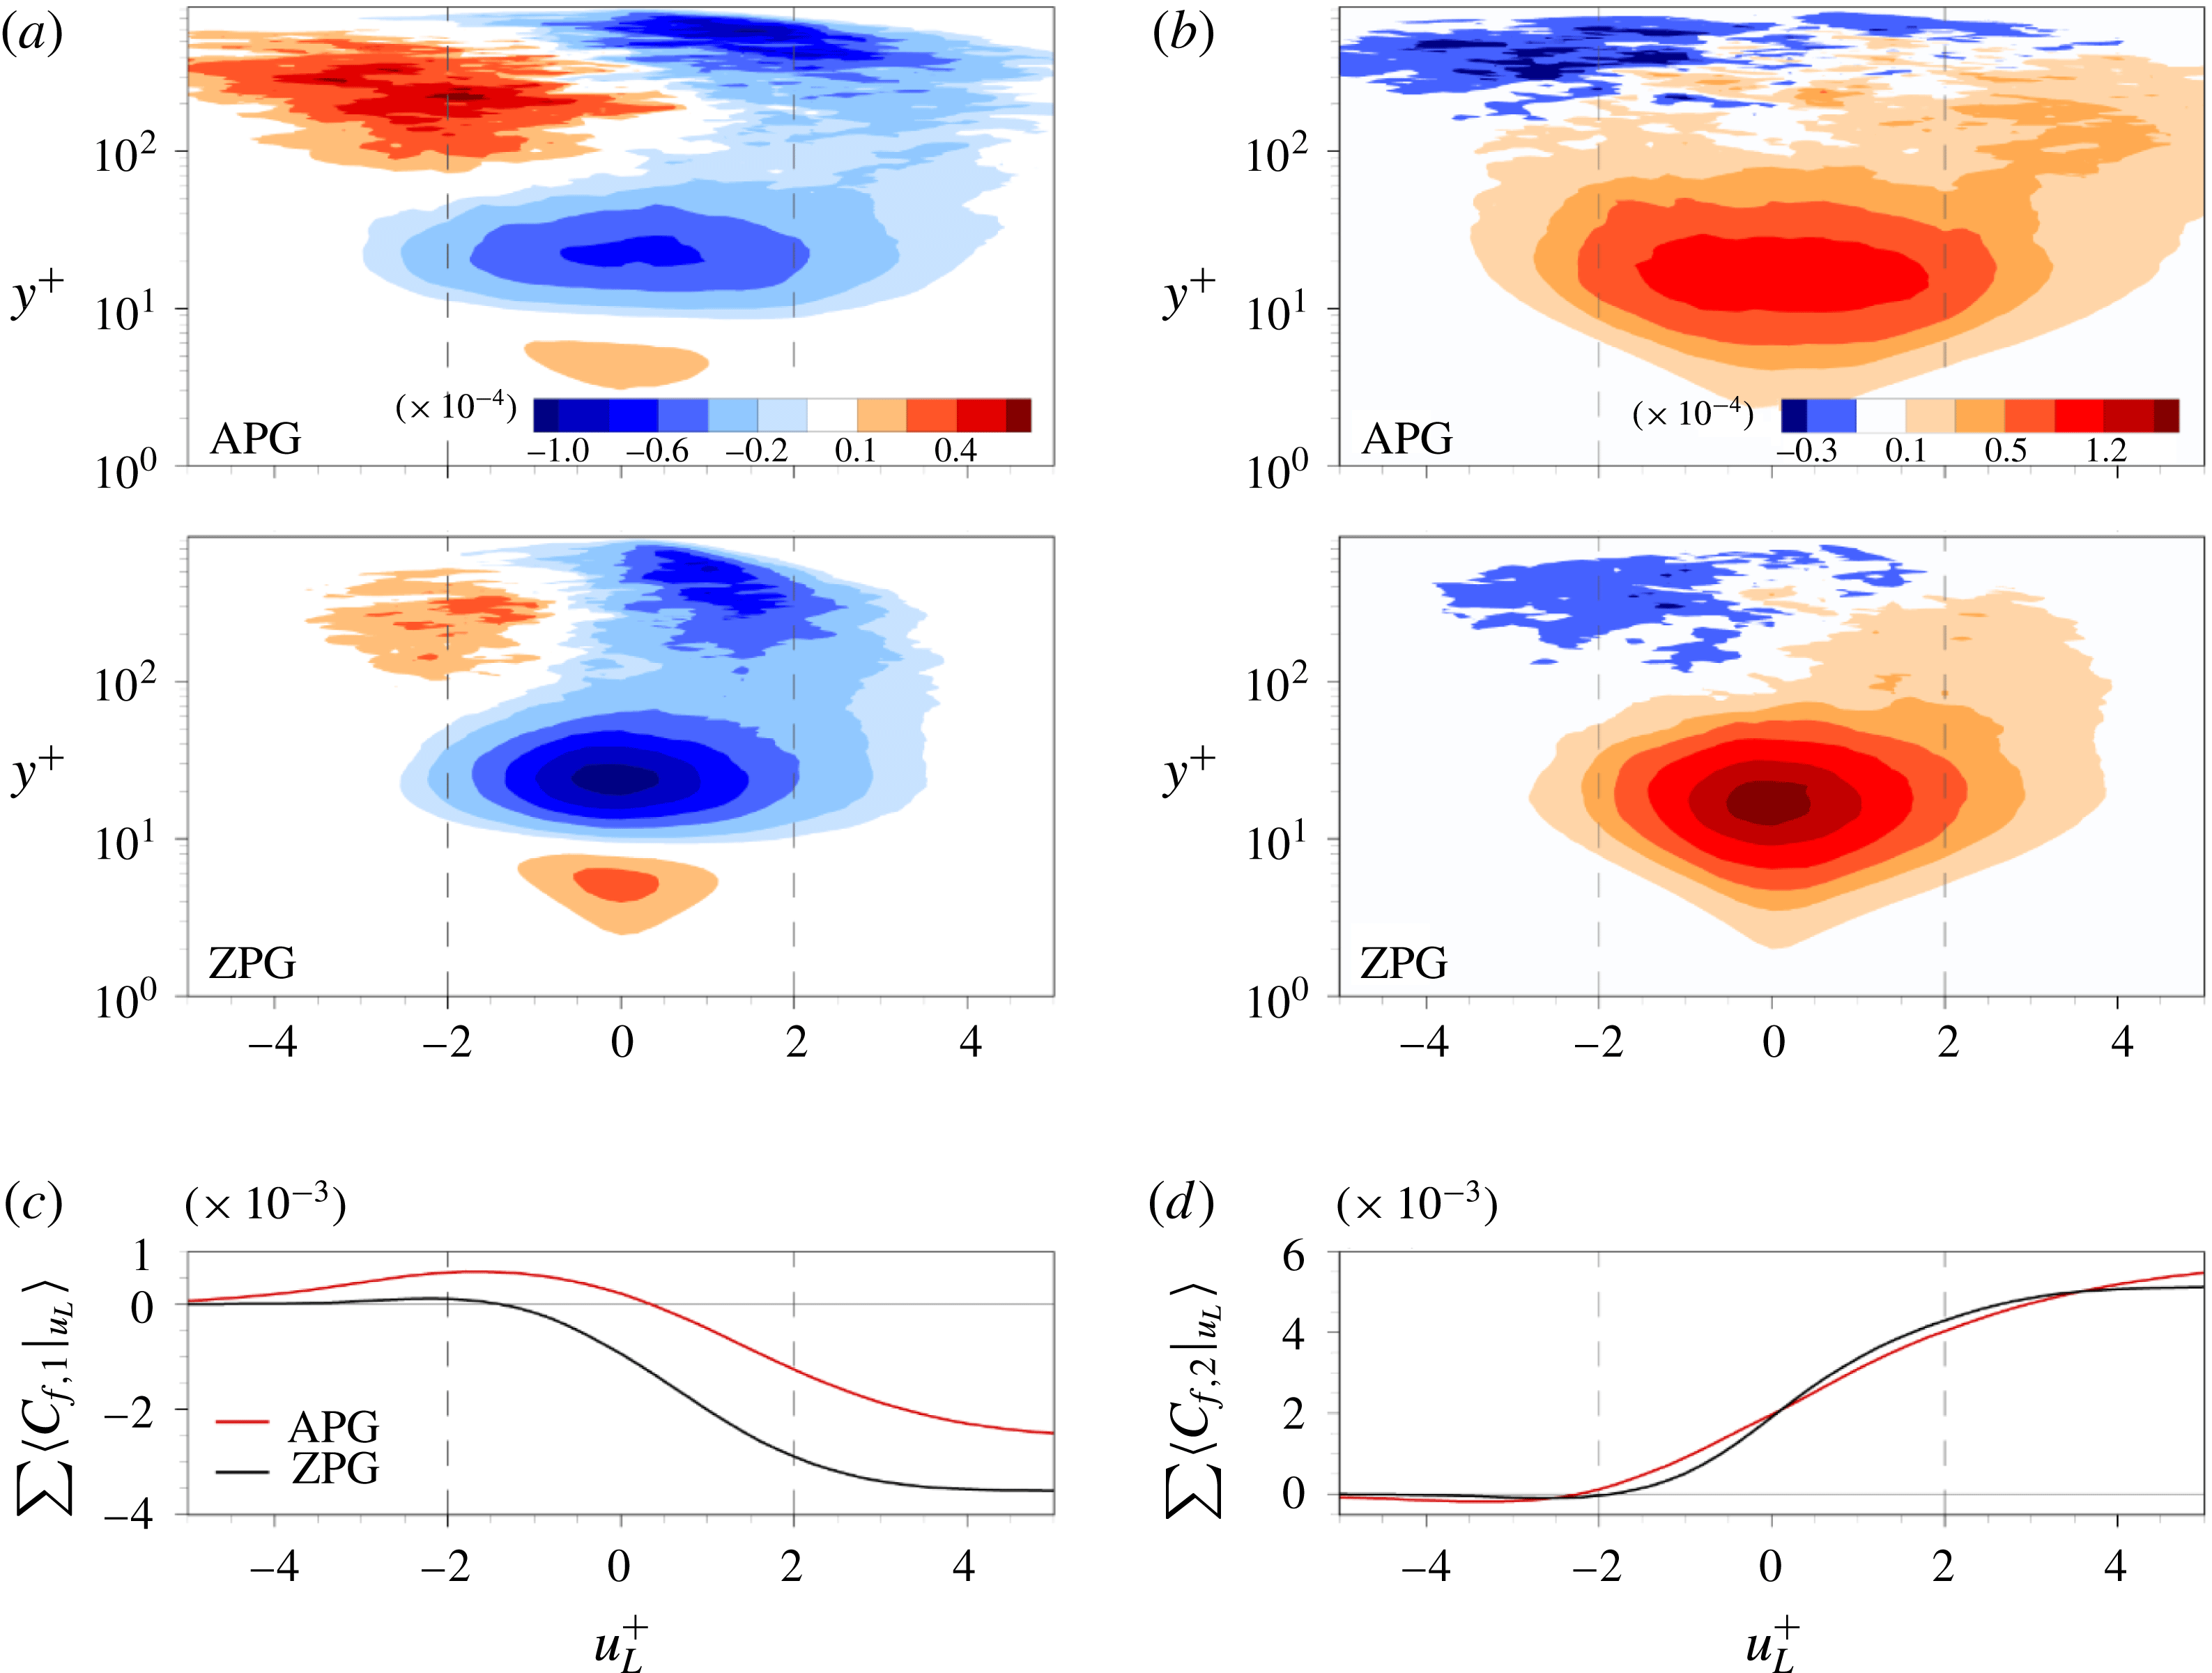
Two-dimensional contour maps of (a)
 $\unicode[STIX]{x1D701}_{f,1}$
and (b)
 $\unicode[STIX]{x1D701}_{f,2}$
on the semi-log scale for the wall-normal direction. Profiles of (c)
 $\sum \langle C_{f,1}|_{u_{L}}\rangle$
and (d)
 $\sum \langle C_{f,2}|_{u_{L}}\rangle$
. Vertical dashed lines indicate
 $u_{L}^{+}=\pm 2$
.

Figure 13(a,b) displays the two-dimensional contour plots for
 $\unicode[STIX]{x1D701}_{f,1}$
and
 $\unicode[STIX]{x1D701}_{f,2}$
, which directly represent the contributions of the advective transport and the vortex stretching to the skin friction with the strength of
 $u_{L}$
, respectively. In these plots of
 $\unicode[STIX]{x1D701}_{f,1}$
, there are three distinct regions with respect to the wall-normal location. First, positive values of
 $\unicode[STIX]{x1D701}_{f,1}$
are observed in the vicinity of
 $u_{L}^{+}=0$
near the wall (
 $y^{+}<10$
), which contribute to the increase in
 $C_{f,1}$
. The first quadrant motions of
 $\langle v\unicode[STIX]{x1D714}_{z}\rangle$
(
 $v>0$
and
 $\unicode[STIX]{x1D714}_{z}>0$
), induced by lifting sublayer streaks, are dominant in this region. Second, negative values of
 $\unicode[STIX]{x1D701}_{f,1}$
contribute to the decrease in
 $C_{f,1}$
between
 $y^{+}=10$
and 80. The second quadrant motions of
 $\langle v\unicode[STIX]{x1D714}_{z}\rangle$
(
 $v>0$
and
 $\unicode[STIX]{x1D714}_{z}<0$
), induced by the lifting of the hairpin vortex heads, are dominant. Third, above
 $y^{+}=80$
for
 $u_{L}^{+}\leqslant -2$
, positive and negative values of
 $\unicode[STIX]{x1D701}_{f,1}$
are dominant under the negative- and positive-
 $u_{L}$
events, respectively. Figure 13(b,d), positive values of
 $\unicode[STIX]{x1D701}_{f,2}$
are dominant for all
 $u_{L}$
below
 $y^{+}=100$
, which is due to the simultaneous collapse of the two adjacent hairpin vortex legs resulted from the vortex stretching. Above that, negative and positive values of
 $\unicode[STIX]{x1D701}_{f,2}$
are observed for
 $u_{L}^{+}\leqslant -2$
and
 $u_{L}^{+}\geqslant +2$
, respectively. As shown in the pre-multiplied spanwise co-spectra
 $k_{z}\unicode[STIX]{x1D719}_{v\unicode[STIX]{x1D714}_{z}}$
and
 $k_{z}\unicode[STIX]{x1D719}_{-w\unicode[STIX]{x1D714}_{y}}$
in figure 7, the small/large scales of
 $\unicode[STIX]{x1D701}_{f,1}$
and
 $\unicode[STIX]{x1D701}_{f,2}$
are expected to be remarkable near the wall (below
 $y^{+}=10$
)/away from the wall (above
 $y^{+}=80$
).
 $\unicode[STIX]{x1D701}_{f,1}$
and
 $\unicode[STIX]{x1D701}_{f,2}$
are biased toward positive
 $u_{L}$
, which means that the positive-
 $u_{L}$
events enhance the vortical motions and make dominant contribution to the skin friction.
The positive and negative values of
 $\unicode[STIX]{x1D701}_{f,1}$
below
 $y^{+}$
 $=$
80 are lower in the APG TBL than in the ZPG TBL, especially near
 $u_{L}^{+}=0$
. The near-wall streaks and advective motions of the hairpin vortices for weak
 $u_{L}$
events
 $(-2<u_{L}^{+}<+2)$
are attenuated in the APG TBL. This is consistent with the finding of Lee & Sung (Reference Lee and Sung2009), showing a diminution of the sublayer streaks by flow visualization of
 $u$
at
 $y^{+}=5.5$
. However, the influences of
 $u_{L}^{+}\leqslant -2$
and
 $u_{L}^{+}\geqslant +2$
on
 $\unicode[STIX]{x1D701}_{f,1}$
are substantially extended above
 $y^{+}=80$
. The intense negative- and positive-
 $u_{L}$
events amplify the outer vortical motions of
 $\langle v\unicode[STIX]{x1D714}_{z}\rangle$
, which results in the increase and decrease in
 $C_{f,1}$
, respectively. Below
 $y^{+}=100$
, positive values of
 $\unicode[STIX]{x1D701}_{f,2}$
are reduced for weak
 $u_{L}$
events, especially in the vicinity of
 $y^{+}=20$
. Above
 $y^{+}=20$
,
 $\unicode[STIX]{x1D701}_{f,2}$
is significantly enhanced for
 $u_{L}^{+}\geqslant +2$
. The enhanced intense positive-
 $u_{L}$
events in the outer region induce the strong vortical motions of
 $\langle -w\unicode[STIX]{x1D714}_{y}\rangle$
close to the wall and thus result in the increase in
 $C_{f,2}$
.
Figure 13(c,d) shows cumulative distributions,
 $\sum \langle C_{f,i}|_{u_{L}}\rangle =\sum _{u_{L}^{+}=-\infty }^{u_{L}^{+}}\langle C_{f,i}|_{u_{L}}\rangle (i=1,2),$
of the profiles of
 $\langle C_{f,1}|_{u_{L}}\rangle$
and
 $\langle C_{f,2}|_{u_{L}}\rangle$
. The velocity–vorticity correlation
 $\langle v\unicode[STIX]{x1D714}_{z}\rangle$
under the negative-
 $u_{L}$
events enhances the skin friction, whereas under the positive-
 $u_{L}$
events it predominantly reduces the skin friction (figure 13
c). In the APG TBL, the zero crossing of
 $\sum \langle C_{f,1}|_{u_{L}}\rangle$
moves from
 $u_{L}^{+}=-1.4$
(ZPG TBL) to
 $u_{L}^{+}=0.3$
due to the positive contribution under the intense negative-
 $u_{L}$
events. The value of the cumulative distribution
 $\sum \langle C_{f,1}|_{u_{L}}\rangle$
at
 $u_{L}^{+}=-2$
and
 $u_{L}^{+}=+2$
of the APG TBL is 8.3 and 2.7 times larger than that of the ZPG TBL. The influences of
 $u_{L}^{+}\leqslant -2$
and
 $u_{L}^{+}\geqslant +2$
on
 $C_{f,1}$
increase in the APG TBL, especially for the negative-
 $u_{L}$
events. Contrary to
 $C_{f,1}$
, the contribution of the intense negative-
 $u_{L}$
events to
 $C_{f,2}$
is attenuated. The zero crossing of
 $\sum \langle C_{f,2}|_{u_{L}}\rangle$
slightly moves from
 $u_{L}^{+}=-2.3$
(ZPG TBL) to
 $u_{L}^{+}=-1.9$
. The value of
 $\sum \langle C_{f,2}|_{u_{L}}\rangle$
below
 $u_{L}^{+}=-2$
is almost zero, representing that the influences of the intense negative-
 $u_{L}$
events on
 $C_{f,2}$
are insignificant. For
 $u_{L}^{+}=+2$
, the value of
 $\sum \langle C_{f,2}|_{u_{L}}\rangle$
of the APG TBL is 1.75 times larger than that of the ZPG TBL. Thus, the enhanced LSMs in the outer region strongly modulate the vortical motions, leading to a significant contribution to the dependence of the skin friction on the LSMs. The influences of the negative-
 $u_{L}$
events on
 $C_{f,1}$
and of the positive-
 $u_{L}$
events on
 $C_{f,2}$
are much stronger in the APG TBL.
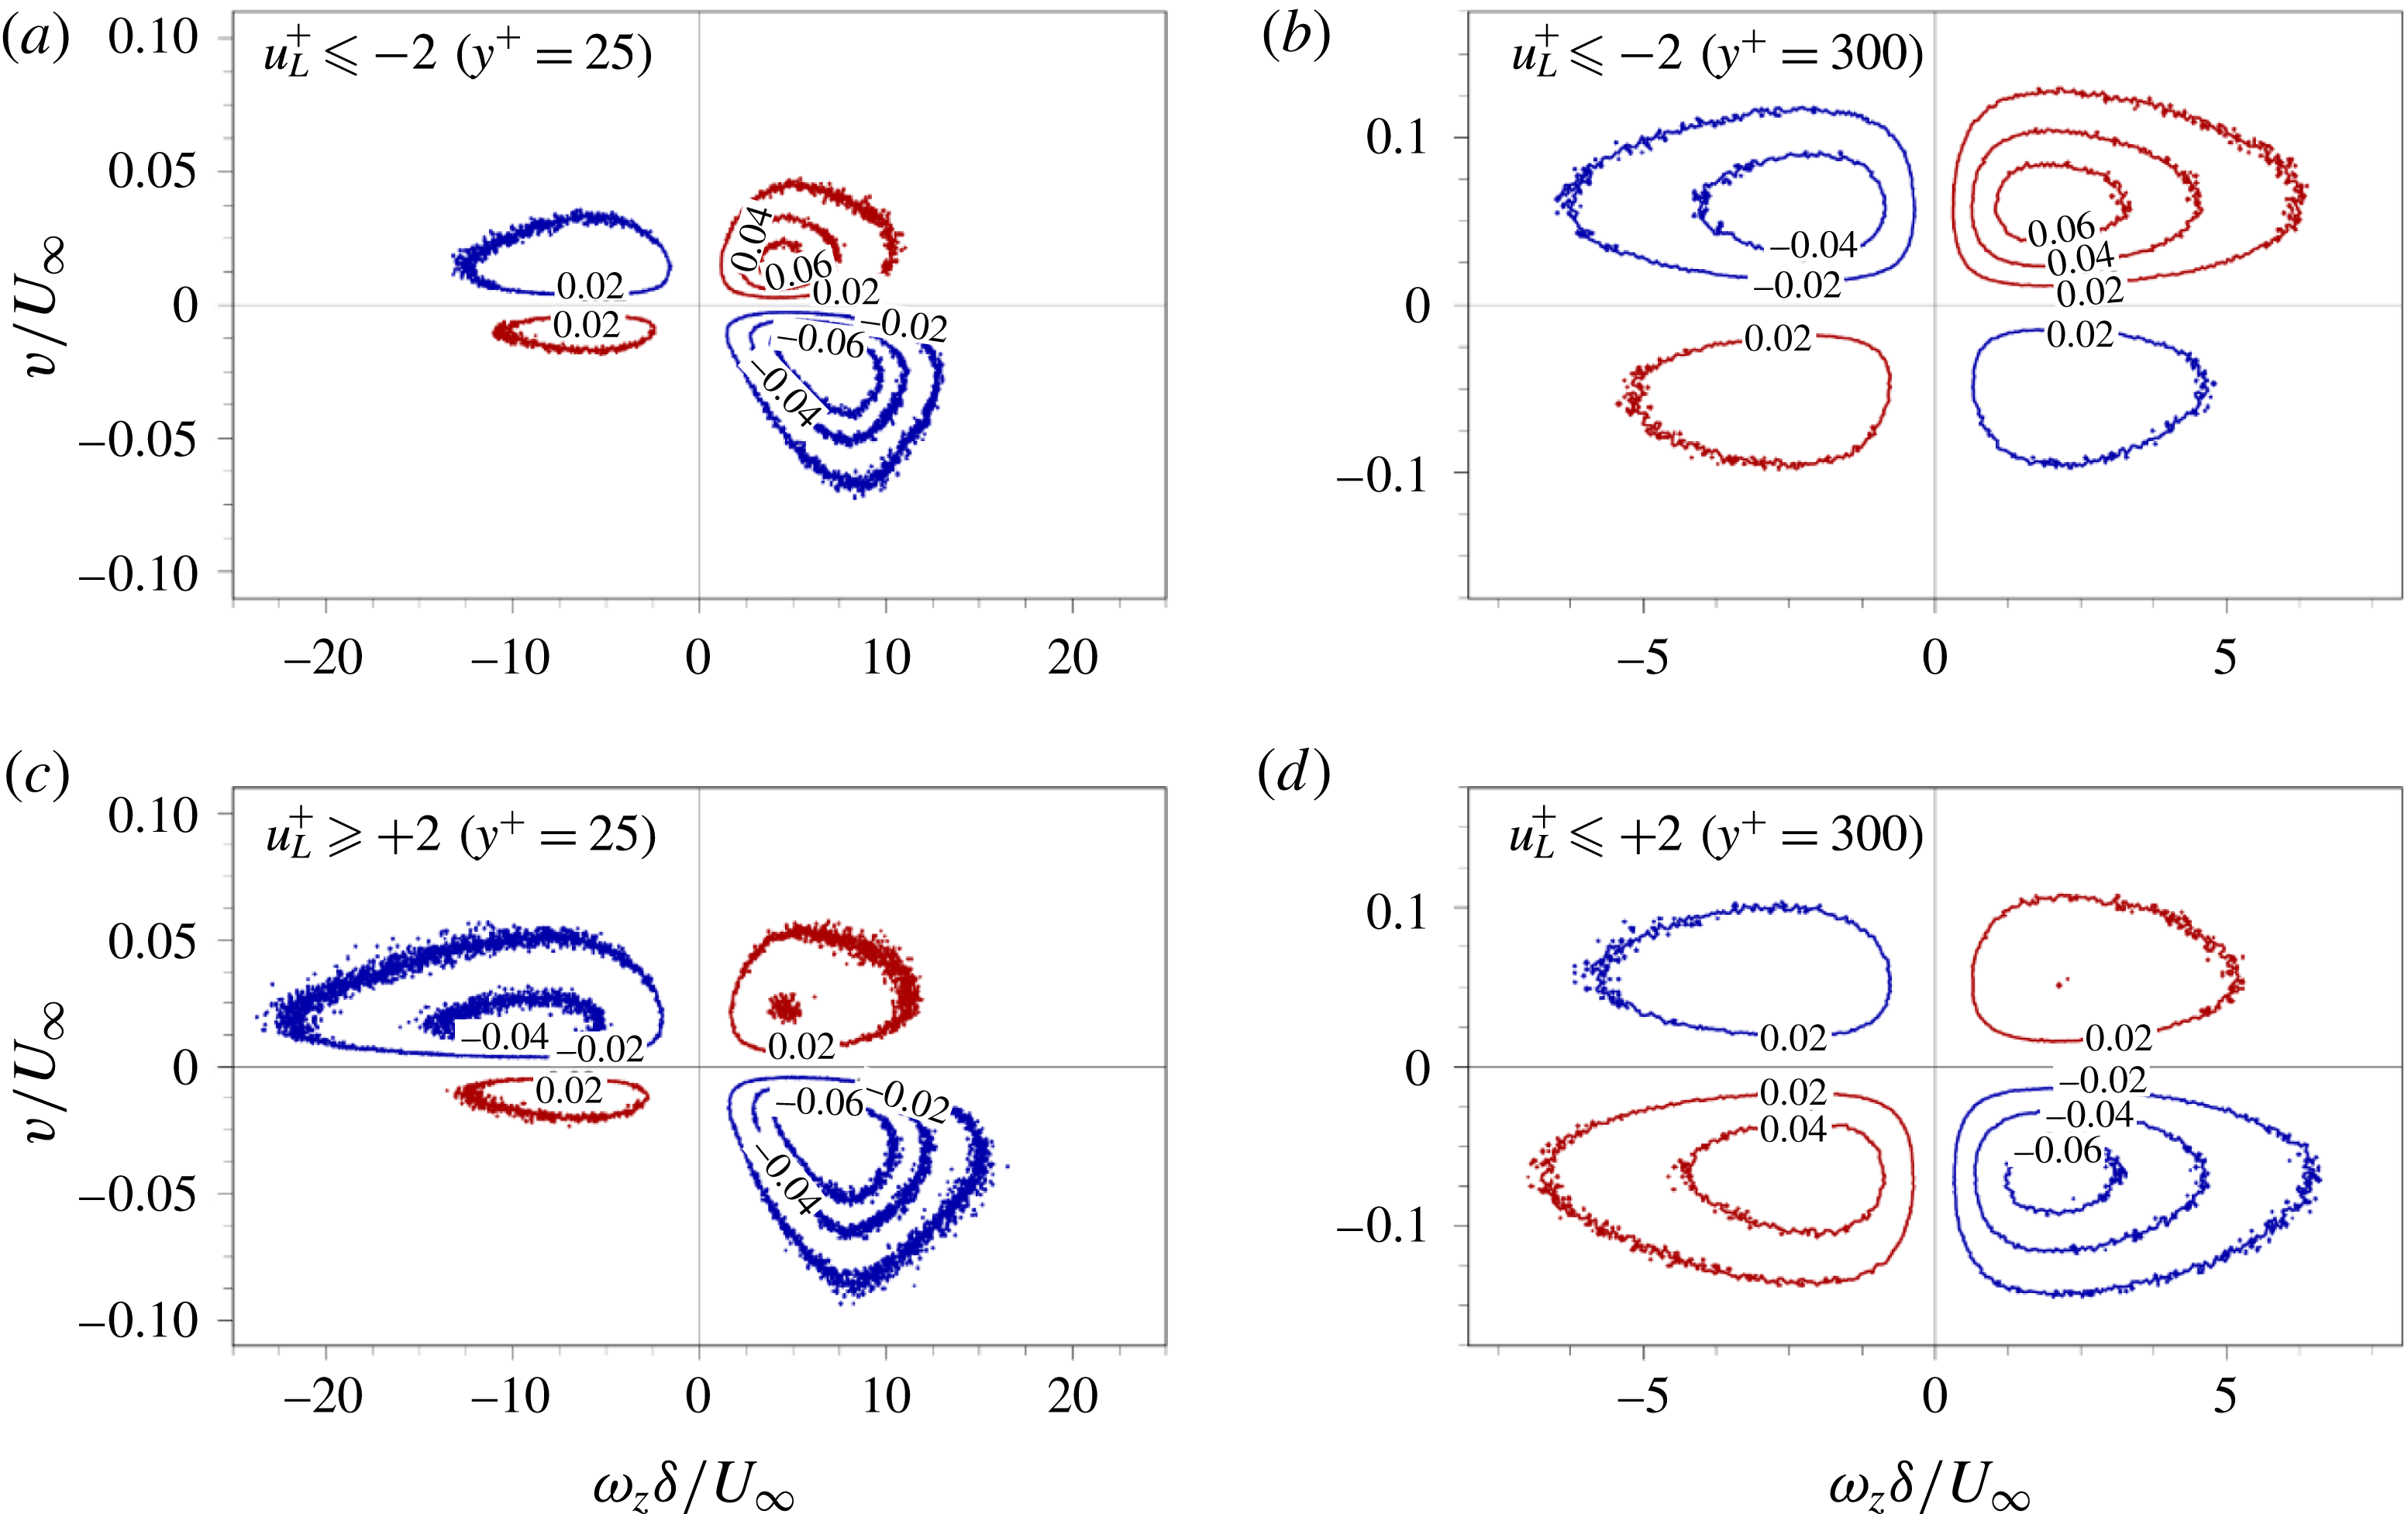
To further analyse the dominant motions contributed to
 $C_{f,1}$
under the intense negative- and positive-
 $u_{L}$
events, the weighted joint probability density functions (JPDFs) of
 $v$
and
 $\unicode[STIX]{x1D714}_{z}$
under
 $u_{L}^{+}\leqslant -2$
and
 $u_{L}^{+}\geqslant +2$
are shown in figure 14. Here, two wall-normal positions are chosen at
 $y^{+}=25$
and 300, where the former is the peak of negative
 $\unicode[STIX]{x1D701}_{f,1}$
in the vicinity of
 $u_{L}^{+}=0$
and the latter is the high value of
 $\unicode[STIX]{x1D701}_{f,1}$
under the intense-
 $u_{L}$
events. Hence, we can determine the quadrant contributions to
 $\langle v\unicode[STIX]{x1D714}_{z}\rangle$
under the intense-
 $u_{L}$
events. Note that the weighted JPDFs of
 $w$
and
 $\unicode[STIX]{x1D714}_{y}$
are not displayed here, since the pair of two quadrant motions (
 $w>0$
and
 $\unicode[STIX]{x1D714}_{y}<0$
;
 $w<0$
and
 $\unicode[STIX]{x1D714}_{y}>0$
) is an equally dominant contributor to the positive values of
 $\langle -w\unicode[STIX]{x1D714}_{y}\rangle$
.
As shown in figure 14, the quadrant motions are different between the negative- and positive-
 $u_{L}$
events at the same wall-normal location. At
 $y^{+}=25$
, the first dominant motion is placed on the fourth quadrant of
 $\langle v\unicode[STIX]{x1D714}_{z}\rangle$
with contributions of approximately 31 %, and the second dominant motion is the first and second quadrants (28 %) for
 $u_{L}^{+}\leqslant -2$
and
 $u_{L}^{+}\geqslant +2$
, respectively (figure 14
a,c). The wider negative region in figure 13(a) arises from the vertical advection (
 $v>0$
) of the near-wall streaks with the negative and positive
 $\unicode[STIX]{x1D714}_{z}$
, which is enhanced under the intense-
 $u_{L}$
events. At
 $y^{+}=300$
, the quadrant motions for
 $u_{L}^{+}\leqslant -2$
and
 $u_{L}^{+}\geqslant +2$
are symmetric with respect to the transverse axis (figure 14
b,d). For
 $u_{L}^{+}\leqslant -2$
, the first and second quadrants are dominant, indicating the upward motions of the vortical structures (figure 14
b). On the contrary, the downward motions of the vortices are dominant under
 $u_{L}^{+}\geqslant +2$
in figure 14(d). These vortical motions are related to the outer ejection and sweep motions carried by the intense negative- and positive-
 $u_{L}$
events, respectively. In particular, the increase in the magnitude of the positive and negative
 $\unicode[STIX]{x1D701}_{f,1}$
in the outer region (figure 13
a) arises from the enhanced upwash and downwash motions of the positive
 $\unicode[STIX]{x1D714}_{z}$
(the first quadrant in figure 14
b and fourth quadrant in figure 14
d), respectively.
Weighted JPDFs of
 $v$
and
 $\unicode[STIX]{x1D714}_{z}$
under (a,b) the intense negative-
 $u_{L}\;(u_{L}^{+}\leqslant -2)$
and (c,d) positive-
 $u_{L}$
events
 $(u_{L}^{+}\geqslant +2)$
at (a,c)
 $y^{+}=25$
and (b,d)
 $y^{+}=300$
. The red and blue lines indicate positive and negative values of
 $v\unicode[STIX]{x1D714}_{z}$
, respectively.

4 Conclusions
We have examined the contribution of the LSMs to the skin friction by focusing on the large-scale influence on the vortical motions in an APG TBL. We performed DNS of a moderate APG TBL (
 $\unicode[STIX]{x1D6FD}=1.45$
) up to
 $Re_{\unicode[STIX]{x1D703}}=6000$
. For comparison, a ZPG TBL was performed at
 $Re_{\unicode[STIX]{x1D70F}}=837$
. In the APG TBL,
 $k_{z}\unicode[STIX]{x1D719}_{uu}$
and
 $k_{z}\unicode[STIX]{x1D719}_{ww}$
showed that the large-scale
 $(\unicode[STIX]{x1D706}_{z}^{+}\geqslant 400)$
energy was significantly enhanced in the outer region. The enhanced LSMs were connected to strong vortical motions. The intense r.m.s. values of the vorticity fluctuations (
 $\unicode[STIX]{x1D714}_{x,rms}$
,
 $\unicode[STIX]{x1D714}_{y,rms}$
and
 $\unicode[STIX]{x1D714}_{z,rms}$
) resulted in the strengthened small-scale energy, which was attributed to the AM effects of the LSMs, and also the superposition of the large scales
 $(\unicode[STIX]{x1D706}_{z}^{+}\geqslant 400)$
for the wall-parallel components. In the pre-multiplied spanwise co-spectra of
 $\langle v\unicode[STIX]{x1D714}_{z}\rangle$
and
 $\langle -w\unicode[STIX]{x1D714}_{y}\rangle$
, we observed the increase in the positive contribution of the large scales. In particular, the large scales in
 $k_{z}\unicode[STIX]{x1D719}_{-w\unicode[STIX]{x1D714}_{y}}$
increased in the buffer and logarithmic regions, implying the enhanced AM effects of the LSMs on the small scales. To quantify the superposition and AM effects of enhanced LSMs on the skin friction, we employed two approaches: (i) the pre-multiplied spanwise co-spectra of
 $\langle v\unicode[STIX]{x1D714}_{z}\rangle$
and
 $\langle -w\unicode[STIX]{x1D714}_{y}\rangle$
and (ii) conditionally averaged
 $\langle v\unicode[STIX]{x1D714}_{z}\rangle$
and
 $\langle -w\unicode[STIX]{x1D714}_{y}\rangle$
with respect to
 $u_{L}$
. We found that
 $C_{f,1}$
(
 $C_{f}$
induced by
 $\langle v\unicode[STIX]{x1D714}_{z}\rangle$
related to the advective transport) and
 $C_{f,2}$
(
 $C_{f}$
induced by
 $\langle -w\unicode[STIX]{x1D714}_{y}\rangle$
related to the vortex stretching) constituted the majority of the total
 $C_{f}$
.
The pre-multiplied spanwise co-spectra of weighted
 $\langle v\unicode[STIX]{x1D714}_{z}\rangle$
and
 $\langle -w\unicode[STIX]{x1D714}_{y}\rangle$
(
 $yk_{z}\unicode[STIX]{x1D719}_{f,1}$
and
 $yk_{z}\unicode[STIX]{x1D719}_{f,2}$
) showed the contribution of a given spanwise wavelength to the skin friction. The large scales contributed approximately 40 % to the difference in
 $C_{f,1}(\unicode[STIX]{x0394}C_{f,1}^{L}=41.8\,\%)$
despite their increase in the outer region, since the positive and negative contributions of the large scales were cancelled out. The superposition effects of the large scales on the skin friction were dominant in
 $C_{f,2}$
. As a result, the enhanced large scales
 $(\unicode[STIX]{x0394}C_{f,2}^{L}=80.2\,\%)$
influenced
 $C_{f,2}$
significantly. The strengthened large scales of
 $yk_{z}\unicode[STIX]{x1D719}_{f,2}$
in the outer region indicated the enhanced AM effects of the LSMs, because
 $\langle -w\unicode[STIX]{x1D714}_{y}\rangle$
was associated with the change of size of eddies by the LSMs. Hence, the AM effects of the LSMs on the skin friction were examined by conditionally averaging
 $\langle v\unicode[STIX]{x1D714}_{z}\rangle$
and
 $\langle -w\unicode[STIX]{x1D714}_{y}\rangle$
with respect to the strength of
 $u_{L}$
. The intense negative- and positive-
 $u_{L}$
events (
 $u_{L}^{+}\leqslant -2$
and
 $u_{L}^{+}\geqslant +2$
) modulated the magnitudes of
 $\langle v\unicode[STIX]{x1D714}_{z}\rangle$
and
 $\langle -w\unicode[STIX]{x1D714}_{y}\rangle$
throughout the boundary layer. In the near-wall region, the wider negative region of
 $\unicode[STIX]{x1D701}_{f,1}$
under the intense
 $u_{L}$
events arose from the vertical advection of negative and positive
 $\unicode[STIX]{x1D714}_{z}$
. The magnitude of
 $\unicode[STIX]{x1D701}_{f,1}$
increased significantly in the outer region due to the enhanced upward and downward motions of positive
 $\unicode[STIX]{x1D714}_{z}$
under the negative- and positive-
 $u_{L}$
events, respectively. In addition, the intense positive-
 $u_{L}$
events induced the strong vortical motions of
 $\langle -w\unicode[STIX]{x1D714}_{y}\rangle$
. The enhanced LSMs under the presence of the APG (
 $\unicode[STIX]{x1D6FD}=1.45$
) considerably contributed to the skin friction through the superposition and AM effects on the vortical motions. Hence, the present method may provide a basis for measuring the contributions of the LSMs to the skin friction and for manipulating the enhanced LSMs in APG TBLs.
Acknowledgements
This study was supported by the National Research Foundation of Korea (no. 2018-001483), and partially supported by the Supercomputing Centre (KISTI).