Introduction
Landraces are valuable sources to broaden the genetic base of crop plants. The development of new varieties from landrace populations is a viable strategy to improve yield and yield stability as well as resistance to biotic and abiotic stresses. Landraces harbour genes and as well gene complexes for quality traits and adapt to a wide range of low-input and organic farming systems (Jaradat, Reference Jaradat1991; Strelchenko et al., Reference Strelchenko, Street, Mitrofanova, Hill, Henry and Mackay2008). Various types of data have been used for the analysis of genetic diversity and population structure in wheat germplasm. Among these, DNA markers especially simple sequence repeats (SSRs) have been extensively exploited for the analysis of genetic diversity and population structure, gene mapping, linkage disequilibrium (LD) analysis and marker assisted selection (Song et al., Reference Song, Shi, Singh, Fickus, Cosra, Lewis, Gill, Ward and Cregan2005; Wang et al., Reference Wang, Barkley and Jenkins2009; Hao et al., Reference Hao, Wang, Ge, Dong and Zhang2011).
LD is a non-random association of alleles at two (more) loci, describing the condition with non-equal frequency of the haplotypes in a population at random combination of alleles at different loci. The extent of LD in natural and domesticated populations is mainly related to effective recombination rate, mating system and population size (Flint-Garcia et al., Reference Flint-Garcia, Thornsberry and Buckler2003; Gupta et al., Reference Gupta, Rustgi and Kulwal2005).
In crop plants, the potential of exploiting LD to detect marker-trait associations was investigated for maize (Yu and Buckler, Reference Yu and Buckler2006; Belo et al., Reference Belo, Zheng, Luck, Shen, Meyer, Li, Tingey and Rafalski2008), wheat (Ravel et al., Reference Ravel, Praud, Murigneux, Linossier, Dardevet, Balfourier, Dufour, Brunel and Charmet2006; Rhone et al., Reference Rhone, Raquin and Goldringer2007; Tommasini et al., Reference Tommasini, Schnurbusch, Fossati, Mascher and Keller2007), barley (Kraakman et al., Reference Kraakman, Niks, Van der Berg, Stam and Van Eeuwijk2004, Reference Kraakman, Martinez, Mussiraliev, Van Eeuwijk and Niks2006; Rostoks et al., Reference Rostoks, Ramsay, MacKenzie, Cardle, Bhat, Roose, Svensson, Stein, Varshney, Marshall, Graner, Close and Waugh2006), sorghum (Hamblin et al., Reference Hamblin, Mitchell, White, Gallego, Kukatla, Wing, Paterson and Kresovich2004), ryegrass (Skot et al., Reference Skot, Humphreys, Armstead, Heywood, Skot, Sanderson, Thomas, Sanderson, Chorlton and Hamilton2005; Xing et al., Reference Xing, Frei, Schejbel, Asp and Lubberstedt2007), soybean (Hyten et al., Reference Hyten, Choi, Song, Shoemaker, Nelson, Costa, Specht and Cregan2009) and rice (Garris et al., Reference Garris, McCouch and Kresovich2003). The published results suggest that association mapping is a valuable additional tool in the search for the detection of novel genes or quantitative trait locus for important agronomic characteristics.
Multiallelic markers such as SSRs are also often used for association studies. These SSR markers have already been used for a study of population structure and LD-based association studies in wheat (Kruger et al., Reference Kruger, Able, Chalmers and Langridge2004; Chen et al., Reference Chen, Min, Yasir and Hu2012). Estimates of LD decay in wheat at the whole genome level and with large genetic representations of wheat genotypes are of great value. Chao et al. (Reference Chao, Zhang, Dubcovsky and Sorrells2007) used 242 genomic SSRs to estimate LD in a collection of 43 elite US wheat cultivars and reported that genome-wide LD estimates were generally less than 1 centiMorgans (cM) for genetically linked locus pairs, and that most of the LD was between loci less than 10 cM apart. A collection of 189 bread wheat landraces genotyped at 370 loci were used to examine LD across the genome, and it was found that LD mapping of wheat could be performed with SSRs to a resolution of less than 5 cM (Somers et al., Reference Somers, Banks, Depauw, Fox, Clarke, Pozniak and McCartney2007).
The objectives of the present study were to estimate: (a) the levels and the structure of the SSR genetic diversity present in a collection of 395 Iranian wheat landraces; (b) the levels and patterns of LD between pairs of SSR loci; (c) the population structure of multilocus LD in the populations.
Materials and methods
Plant materials
A total of 395 wheat landraces from different geographical regions of Iran including 154 spring, 193 winter, two facultative wheat and 46 unknown growth type were kindly provided by International Center for the Improvement of Maize and Wheat (CIMMYT).
DNA preparation and SSR analysis
DNA from fresh leaves of 10 plants of each genotype was extracted using cetyl trimethyl ammonium bromide method (Saghai-Maroof et al., Reference Saghai-Maroof, Soliman, Jorgensen and Allard1984). Polymerase chain reactions (PCR) for SSR analyses were performed in a total volume of 10 µl containing 2 µl of template DNA, 0.1 µl dNTP (10 mM), 0.5 µl of each primer, 0.3 µl MgCl2 (50 mM), 5.2 µl 1 × PCRBuffer and 0.11 µl Taq DNA polymerase. Thermocycling consisted of an initial denaturation at 94°C for 5 min, followed by 35 cycles of 94°C for 45 s, 48–63°C annealing temperature (depending upon the primer sets) for 45 s and 72°C extension for 1 min, with a final extension of 7 min at 72°C. PCR products were analysed by 4% polyacrylamide gel electrophoresis and visualized by Ethidium bromide staining. The chromosome locations of SSR primers were mainly taken from the National Bio Resource Project, Japan (http://www.shigen.nig.ac.jp/wheat/komugi/maps/marker/map.jsp), and the wheat genome map produced by Somers et al. (Reference Somers, Isaac and Edwards2004).
Allele diversity and population structure
Gene diversity and heterozygosity were calculated at 53 SSR marker loci in 395 genotypes using Power-Marker software (Liu and Muse, Reference Liu and Muse2005). Gene diversity (H) and polymorphic information content (PIC) for each locus were calculated from allele frequencies using
 ${\rm PIC} = 1 - \sum {p_i^2 -} \sum {2p_i^2 p_j^2} $
and
 $H = 1 - \sum {p_i^2} $
formulas, where p
i
and p
j
are the frequency of the ith and jth alleles, respectively.
Population structure analysis
Population structure was analysed with the STRUCTURE software v.2.3.4 (Pritchard et al.,
Reference Pritchard, Stephens and Donnelly2000) using a Bayesian clustering approach to identify subpopulations, each possessing a characteristic set of allele polymorphisms, based on genotyping data from 53 SSRs. Independent simulations having 100,000 Markov Chain Monte Carlo (MCMC) replications and 100,000 burn-ins were performed with the number of subpopulations (k) ranging from 1 to 12. To examine genetic relationships, unweighted pair-group method with arithmetic average (UPGMA) cluster based on Maximum Composite Likelihood distance was performed with MEGA software. In order to assess the further existence of a genetic structure within the identified clusters, estimation of posterior distribution of pairwise Wright's F
ST (Wright, Reference Wright1951), a standardized measure of the genetic variance among populations, among 100,000 iterations were also plotted. Pairwise F
ST was calculated as
 ${F_{{\rm ST}}} = {{\rm var}} ({p_k})/ \bar p(1 - \bar p)$
, where p
k
is the frequency of an allele in population k, and
 $\bar p$
is the overall frequency of that allele across all subpopulations (Excoffier, Reference Excoffier, Balding, Bishop and Cannings2001). The net nucleotide distance was calculated between all pairs of subpopulations to determine relationships between populations. This distance between populations A and B, D
AB, is calculated as
 ${D_{{\rm AB}}} = 1/L\sum {_{l = 1}^L \{ 1 - \sum {_{j = 1}^{Jl} \ \hat p_{{\rm A},j}^{(l)} \hat p_{{\rm B},j}^{(l)} } \} -}$
 $({H_{\rm A}} + {H_{\rm B}}/2)$
is the (posterior mean) estimated allele frequency of allele j at locus l in population x, L is the number of loci, J
l
the number of alleles at locus l and where
 ${H_X} = 1/L\sum {_{l = 1}^L \{ 1 -\sum {_{j = 1}^{Jl}\ \hat p_{X,j}^{(l)2}} \}} $
. In words, the net nucleotide distance is the average probability that a pair of alleles, one each from populations A and B are different, less the average within-population heterozygosities. The distance has the appropriate property that similar populations have distances near 0, and in particular, D
AA = 0.
LD
The genome-wide LD between all pairs of SSR alleles based on squared allele-frequency correlations (r 2) was analysed based with1000 permutations using software package TASSEL ver. 1.9.6 (Bradbury et al., Reference Bradbury, Zhang, Kroon, Casstevens, Ramdoss and Buckler2007). Loci were considered to be in significant LD if P ≤ 0.001. LD decay scatter plots of syntenic r 2 versus genetic distance (cM) between markers were generated. LD decay was calculated according to the method described in Breseghello and Sorrells (Reference Breseghello and Sorrells2006).
Results
SSR polymorphism
A total of 53 SSR loci were detected by 52 markers, including 4 Xwmc, 11 Xbarc and 37 Xgwm, which were located on 17 wheat chromosomes (Table S1). In total, 312 alleles were amplified at the 53 polymorphic SSR loci. Among the analysed SSR primer pairs, only primer Xbarc70 amplified two loci at the studied genotypes. The number of allelic variants detected per locus ranged from 2 (Xbarc186) up to 18 (Xwmc175), with a mean of 5.89. Major allele frequency ranged from 0.17 to 0.91, with an average of 0.48.
Polymorphic information content values ranged from 0.15 (Xgwm319) to 0.86 (Xgwm413) with an average 0.6. Gene diversity values of the 53 SSR loci ranged from 0.16 to 0.88 for Xgwm319 and Xgwm413 loci, respectively, with an average of 0.64. Considering the high degree of polymorphism, a set of SSR markers consisting of nine loci with gene diversity values of 0.80 or higher were selected. These loci were Xwmc327, Xgwm6, Xgwm35, Xgwm135, Xgwm400, Xgwm413, Xgwm480, Xgwm544 and Xgwm570, whose combinations provided distinct genotypes for all the studied landraces.
Population structure
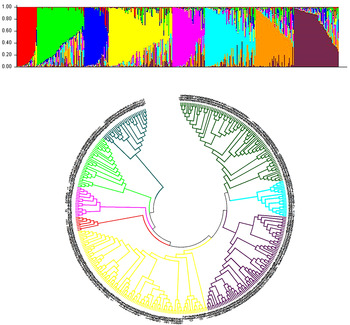
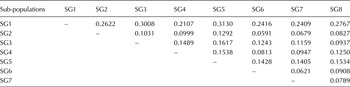
Population structure of the 395 landraces was estimated using STRUCTURE software based on 53 SSR markers. The number of subpopulations (K) was identified based on ΔK values. The highest delta K value is to be taken as optimum K (Figure S1). The number of clusters, K, was inferred to be eight (SG1 until SG2). The groups included 7.4, 12.7, 9.5, 16.8, 11.4, 14.6, 13 and 14.5% of the landraces, respectively. Landraces were spring, winter and facultative growth type and all the subgroups included spring and winter types. Two facultative landraces were in SG4 and SG5. SG4 was the largest group consisting of 41 winter and 30 spring landraces and SG1 with three winter, 18 spring and five unknown growth type landraces was the smallest group. SG1 and SG8 had the highest number of spring landraces. The population structure ascertained by model-based cluster analysis was in congruent with geographic ecotypes of the landraces. SG1 consisted of landraces of northern latitude 3616 and 3613 from Qazvin, Mashhad and Sabzevar. The landraces in second group were originated from Shiraz, Kerman, Neishabour, Mashhad and Urmia. The origin of most landraces in SG3 was northeastern Iranian cities including Birjand, Torbatejam, Damghan and Mashhad. In SG4, landraces from Gazvin and Sanandaj and in SG5 and SG7, landraces from Shahreza and Esfahan with 3201N and 3733N latitude were grouped. The most of the landraces in SG6 were originated from hot area of Iran including Tabas and Zahedan and SG8 consisted of more landraces from cold regions such as Hamedan and Zanjan. UPGMA cluster analysis also clearly divided the 395 landraces into eight groups. The dendrogram and bar plot were shown in Fig. 1. To quantify distances between the subpopulations and to further evaluate population structure, net nucleotide distances between pairs of sub-populations were computed (Table 1). The distances between pairs of sub-populations ranged from 0.0591 (between SG2 and SG6) to 0.3130 (between SG1 and SG5).
Bar plot of the genetic composition of individuals based on 53 SSR markers generated by STRUCTURE 2.3.4 using the admixture model. Groups for each panel are represented by colours as indicated at the bottom (A). The dendrogram was resulted from genetic distance in MEGA software (B).

Allele-frequencies divergence among populations (net nucleotide distance), computed using point estimates on structure

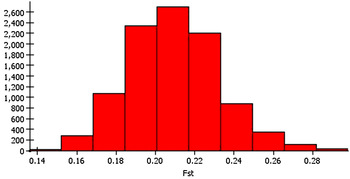
To assess further levels of genetic structure within the eight identified clusters, the estimate of posterior distribution of pairwise Wright's F ST (Wright, Reference Wright1951), a measure of the genetic variance among populations was also calculated using 100,000 permutations (Fig. 2). F ST values between all groups were significant (P ≤ 0.001) and ranged from 0.14 to 0.28, supporting the existence of genetic structure.
The distribution of the pairwise F ST values between eight subpopulations over 100,000 iterations.

Pairwise LD and LD decay in Iranian wheat landraces
Across all 53 loci, 1378 locus pairs were detected in the Iranian wheat landraces collection. LD plot is shown in Figure S2. At significant threshold values (r 2 ≥ 0.01 and P ≤ 0.001), 12–13% of the SSR marker pairs showed significant pairwise LD in a total 166 pairwise and six pairs were detected with r 2 ≥ 0.05 and P ≤ 0.001. At the highly significant threshold of r 2 ≥ 0.1, only one SSR linked marker pair (Xbarc186 and Xbarc117) with r 2 = 0.226 remained in LD (Table 2).
The pairwise genome-wide linkage disequilibrium between pairs of simple sequence repeat markers

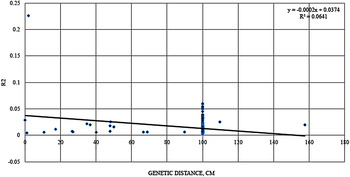
To visualize or depict the extent of LD, a plot of LD decay, which shows how LD declines with genetic (centiMorgans, cM) was derived. Genome wide LD at r 2 = 0.2 reduced to ~1–2 cM and we observed a significant (r 2 = 0.2) LD between one pair of SSR loci within 1.93 cM distance. However, LD clearly decays within the genetic distance of 40–60 cM with r 2 ~ 0.05. Significant LD between unlinked markers suggests the existence of LD generating factors other than linkage in the landraces (Fig. 3).
Scatter plot of significant r 2 values and genetic distance (cM) (P ≤ 0.001) of locus pairs on whole genomes in landraces. The logarithmic trend line represents the average LD decay.

Discussion
Genetic diversity and population structure in Iranian wheat landraces
The level of polymorphism detected was relatively high, with an average of 5.88 alleles per locus and many alleles for some loci. A similar number of alleles was found for 60 hexaploid wheat cultivars from Eastern Europe, genotyped at 42 SSR loci (Stachel et al., Reference Stachel, Lelley, Grausgruber and Vollmann2000). Analysis of genetic diversity in 250 Chinese bread wheat accessions, including 93 modern varieties and 157 landraces revealed amplification of an average 13.1 alleles per locus with a mean genetic diversity of 0.65 and higher genetic diversity (0.64) in landraces compared with modern varieties (0.628) (Hao et al., Reference Hao, Wang, Ge, Dong and Zhang2011). Other estimates of mean allele number per locus from previous studies using SSR markers on more diverse germplasm were: 18.1 alleles at 26 loci on 998 accessions of hexaploid wheat from Gatersleben germplasm collection (Huang et al., Reference Huang, Borner, Roder and Ganal2002); 5.6 alleles at 70 loci on 58 durum cultivars of diverse geographical origins, including old cultivars (Maccaferri et al., Reference Maccaferri, Sanguineti, Donini and Tuberosa2003) and 5.05 alleles at 269 loci on 90 Chinese winter wheat (Chen et al., Reference Chen, Min, Yasir and Hu2012). Our estimates of SSR allele diversity in wheat were comparable with estimates reported for other grasses, when the sampling breadth is considered. Differences in results reported by various studies could be because of differences in number of genotypes studied, their genetic background and number of markers used and techniques applied to detect polymorphism. For example, high number of alleles per locus (18.1) in Huang et al. (Reference Huang, Borner, Roder and Ganal2002) study could be explained by the larger number of genotypes analysed in their study. In addition, Hai et al. (Reference Hai, Wagner and Friedt2007) assumed that the higher genetic diversity observed in some germplasms may be because of the presence of relatively more rare alleles, resulting from less stringent selection applied in those germplasms. They suggested that breeding practice affected the total number of alleles and rare alleles.
Population structure is one of several important factors that strongly influence LD. In the study of flowering time locus in maize a suite of polymorphisms in the maize dwarf8 gene was significantly associated with variation in flowering time (Thornsberry et al., Reference Thornsberry, Goodman, Doebley, Kresovich, Nielsen and Buckler2001). The incidence of false positives created by population structure was reduced by up to 8% as a result of the Pritchard method. Using these statistical methods in an association test allowed researchers to improve their resolution from the level of a 20-cM region to that of an individual gene. The methodological advances that estimate the effects of population structure-induced linkage disequilibria should allow the use of association testing in a much wider context, enabling the use of this very powerful technique (Flint-Garcia et al., Reference Flint-Garcia, Thornsberry and Buckler2003). Population structure analyses have indicated that wheat landraces can be categorized by geographical origin divided to eight subpopulations. In total, 395 landraces were assigned by STRUCTURE to SG1 until SG8 and this result was similar to UPGMA result. Chen et al. (Reference Chen, Min, Yasir and Hu2012) using 269 SSR markers in 90 elite Chinese winter wheat reported that 90 Chinese wheat accessions could be divided into three subgroups based on STRUCTURE, UPGMA cluster and principal coordinate analyses. They also noted that the population structure derived from STRUCTURE clustering was positively correlated to some extent with geographic eco-type.
LD
The pattern of LD decay determines the marker density required for and the level of resolution that may be obtained in an association study (Flint-Garcia et al., Reference Flint-Garcia, Thornsberry and Buckler2003). A higher level of LD might be expected in hexaploid wheat compared with maize and sorghum because of the rapid rate of inbreeding in wheat with a high degree of self-pollination (Flint-Garcia et al., Reference Flint-Garcia, Thornsberry and Buckler2003). Numerous studies in wheat have reported LD decay distances. Mean genome-wide LD decay was estimated to be 10 cM (r 2 ≥ 0.1) in 205 US elite wheat breeding lines (Zhang et al., Reference Zhang, Bai, Zhu, Yu and Carver2010). Hao et al. (Reference Hao, Wang, Ge, Dong and Zhang2011) reported a wider average LD decay in Chinese modern varieties compared with landraces across the whole genome for locus pairs with r 2 ≥ 0.05 (P ≤ 0.001). In their study, mean LD decay distance for 157 landraces at the whole genome level was 5 cM compared with 5–10 cM for the 93 modern varieties investigated. For 189 bread wheat and 93 durum wheat accessions, the LD between adjacent locus pairs (r 2 ≥ 0.2) extended ~2–3 cM on average, and it was suggested that LD mapping of wheat could be performed with SSRs to a resolution of 5 cM (Somers et al., Reference Somers, Banks, Depauw, Fox, Clarke, Pozniak and McCartney2007). From an analysis of 242 genomic SSRs among 43 elite US wheat cultivars, it was reported that genome-wide LD estimates generally were less than 1 cM for genetically linked locus pairs with r 2 ≥ 0.2 (P ≤ 0.01), and that most LD was less than 10 cM apart between loci (Chao et al., Reference Chao, Zhang, Dubcovsky and Sorrells2007). Chen et al. (Reference Chen, Min, Yasir and Hu2012) in 90 elite Chinese winter wheat reported 17.4 cM (r 2 ≥ 0.2) as the maximum LD decay distance and whole genome LD decay distance was ~2.2 cM (r 2 ≥ 0.2, P ≥ 0.001). Nielsen et al. (Reference Nielsen, Backes, Stougaard, Andersen and Jahoor2014) using DArT technology in 94 European hexaploid bread wheat reported mean r 2 value of 0.080 for all marker-pairs and 0.271 for significant marker pairs and LD decay for the total population was 23 cM. These differences are due both to variations in material type and quantity as well as differences in r 2 values (i.e. r 2 ≥ 0.05, 0.1, or 0.2) used for the estimations. Our results showed genome wide LD at r 2 = 0.2 reduced to ~1–2 cM and we observed a significant (r 2 = 0.2) LD between one pair of SSR loci within 1.93 cM distance. However, LD decays within the genetic distance of 40–60 cM with r 2 ~ 0.05 (Fig. 3).
In summary, this study illustrates that genetic diversity in Iranian wheat landraces, was mediocre and lower than that of many other wheat germplasm collections. However we can use this collection to identify resistance and other important genes source. Using landraces from other countries and wild genotypes will be useful to increase genetic diversity. The large number of SSR markers can improve results suggesting that, use large number of markers in future studies. The population structure revealed using STRUCTURE analysis of SSR markers distributed throughout the wheat genome was more accurate than using geographic eco-type information and was available for investigating population genetic structure. LD analysis revealed that there are significant associations between unlinked and some of linked markers and LD decay distance is different from other wheat collections. For obtaining extra information, association mapping is necessary.
Supplementary material
To view supplementary material for this article, please visit http://dx.doi.org/10.1017/S1479262115000684
Acknowledgements
This research was supported by grants from the Center of Excellence in Cereal Molecular Breeding, University of Tabriz, Tabriz, Iran. The seed of Iranian wheat landraces was generously provided by the International Maize and Wheat Improvement Center (CIMMYT).