Introduction
Eastwards, increasing climatic continentality and dust availability lead to extensive, continuous loess covers, often several tens of metres thick (Pécsi, Reference Pécsi1990; Różycki, Reference Różycki1991; Muhs and Bettis, Reference Muhs, Bettis, Chan and Archer2003; Haase et al., Reference Haase, Fink, Haase, Ruske, Pécsi, Richter, Altermann and Jäger2007; Antoine et al., Reference Antoine, Rousseau, Degeai, Moine, Lagroix, Kreutzer, Fuchs, Hatté, Gauthier, Svoboda and Lisá2013, Reference Antoine, Goval, Jamet, Coutard, Moine, Hérisson and Auguste2014; Muhs, Reference Muhs, Shroder, Lancaster, Sherman and Baas2013; Lehmkuhl et al., Reference Lehmkuhl, Zens, Krauß, Schulte and Kels2016, Reference Lehmkuhl, Bösken, Hošek, Sprafke, Marković, Obreht and Hambach2018, Reference Łanczont, Mroczek, Komar, Nawrocki, Standzikowski, Krokhmal, Prylypko, Bujak and Szymanek2023; Li et al., Reference Li, Shi, Aydin, Beroya-Eitner and Gao2020). Lehmkuhl et al. (Reference Lehmkuhl, Nett, Pötter, Schulte, Sprafke, Jary and Antoine2021) distinguished six major loess domains in Europe, defined by dust‐source availability, geomorphology, atmospheric circulation, and periglacial intensity. The Middle Dnieper region lies within the eastern periglacial loess domain, adjacent to the glaciated domain of the maximum Saalian ice extent. This transitional position fosters interaction between regional atmospheric circulation and local geomorphological and sedimentary processes, producing loess–palaeosol sequences (LPSs) that combine regionally transported and locally derived sediment. These conditions provide an important setting for assessing how local relief and hydrology modulate broader climatic signals. In this context, the preservation of L2 loess—representing the penultimate glacial cycle (Marine Isotope Stage [MIS] 6)—and stratigraphically underlying younger L1 deposits in several sections across central and eastern Europe (e.g., Antoine et al., Reference Antoine, Rousseau, Moine, Kunesch, Hatté, Lang, Tissoux and Zöller2009; Jary and Ciszek, Reference Jary and Ciszek2013; Bradák-Hayashi et al., Reference Bradák-Hayashi, Biró, Horváth, Végh and Csillag2016; Skurzyński et al., Reference Skurzyński, Jary, Kenis, Kubik, Moska, Raczyk and Seul2020) enables direct comparison of depositional processes, postdepositional alteration, and stratigraphic completeness between glacial cycles, which is a central focus of this study.
Reconstructions of loess cover extent and dynamics are usually based on the youngest unit, correlated with the last glacial and designated as L1 within universal loess stratigraphic schemes (Kukla and An, Reference Kukla and An1989; Marković et al., Reference Marković, Bokhorst, Vandenberghe, McCoy, Oches, Hambach and Gaudenyi2007). This unit forms a continuous mantle, typically a few metres thick, masking older deposits (Lehmkuhl et al., Reference Lehmkuhl, Bösken, Hošek, Sprafke, Marković, Obreht and Hambach2018; Żogała et al., Reference Żogała, Mroczek, Łanczont and Stan-Kłeczek2023). In local sedimentary traps such as valleys, slope depressions, and orographic barriers, its thickness may reach several tens of metres (Antoine et al., Reference Antoine, Rousseau, Moine, Kunesch, Hatté, Lang, Tissoux and Zöller2009; Krauss et al., Reference Krauss, Klasen, Schulte and Lehmkuhl2021; Łanczont et al., Reference Łanczont, Mroczek, Komar, Fedorowicz, Woronko, Nawrocki, Frankowski and Standzikowski2022a, Reference Łanczont, Mroczek, Komar, Fedorowicz, Woronko, Nawrocki, Frankowski and Standzikowski2022b). Older loess covers are harder to study due to burial beneath L1 and cumulative postdepositional alteration from pedogenesis, diagenesis, and reworking. Many sequences contain substantial stratigraphic gaps, with older phases preserved mainly as colluvial deposits or reworked material within younger units. Such material can retain micromorphological and mineralogical features of secondary transformation and recycling (Pye, Reference Pye1995; Van Loon, Reference Van Loon2006; Mroczek, Reference Mroczek2013; Licht et al., Reference Licht, Pullen, Kapp, Abell and Giesler2016; Matoshko, Reference Matoshko2021; Skurzyński et al., Reference Skurzyński, Jary, Fenn, Lehmkuhl, Raczyk, Stevens and Wieczorek2024; Kenis et al., Reference Kenis, Skurzyński, Arabasz and Jary2025). Intact exposures of L2 loess are rare, limited to isolated sections in central and eastern Europe, including the study site described in detail here, which provides a valuable case for direct comparison of depositional and postdepositional characteristics between glacial cycles.
Research on LPSs spans local (<50 km), regional (50–300 km), and supraregional (>300 km) scales, each requiring distinct correlation approaches. Effective correlation involves not only litho- and pedostratigraphic comparison, but also consistent analytical methods and a multi-index, multiproxy strategy (Antoine et al., Reference Antoine, Rousseau, Degeai, Moine, Lagroix, Kreutzer, Fuchs, Hatté, Gauthier, Svoboda and Lisá2013, Reference Antoine, Lagroix, Jordanova, Jordanova, Lomax, Fuchs and Debret2019; Łanczont et al., Reference Łanczont, Bogucki, Yatsyshyn, Terpiłowski, Mroczek, Orłowska and Hołub2019; Lehmkuhl et al., Reference Lehmkuhl, Nett, Pötter, Schulte, Sprafke, Jary and Antoine2021). Directly correlating local datasets with distant reference sites, while neglecting the regional context, often leads to oversimplification and errors—hence the need for a hierarchical correlation model. Cross-scale analysis enables identification of both recurring environmental mechanisms and local variants shaped by relief, micro-sedimentary processes, or pedogenesis. A shared comparative framework, based on stratigraphic markers and standardised protocols, is essential (Marković et al., Reference Marković, Stevens, Kukla, Hambach, Fitzsimmons, Gibbard and Buggle2015; Obreht et al., Reference Obreht, Zeeden, Hambach, Veres, Marković and Lehmkuhl2019; Lehmkuhl et al., Reference Lehmkuhl, Nett, Pötter, Schulte, Sprafke, Jary and Antoine2021; Matoshko, Reference Matoshko2021). Sequences located in transitional zones between eastern periglacial and glaciated loess domains particularly illustrate the need for such an integrated, scale-sensitive approach to distinguish local geomorphological effects from regional and supraregional climatic signals.
Stratigraphic interpretation of LPS requires both comparison with reference units and an understanding of sediment genesis and subsequent transformation. Although loess forms primarily through aeolian deposition, its structure and properties are significantly modified by pedogenic and diagenetic processes. The concept of “loessification” (Berg, Reference Berg1916; Pécsi, Reference Pécsi1990; Smalley and Marković, Reference Smalley and Marković2014; Smalley and Obreht, Reference Smalley and Obreht2018) distinguishes a primary stage—cementation and stabilisation of dust—from a secondary stage driven by long-term environmental interactions. These stages combine depositional and transformed features, producing units that combine sedimentary and pedogenic traits. Such complexity is particularly evident in peri- and extraglacial regions, where local factors (e.g., dust sources, moisture regimes, iron redistribution) interact with regional atmospheric and climatic signals (Łanczont et al., Reference Łanczont, Madeyska, Bogucki, Sytnyk, Kusiak, Frankowski, Komar, Nawrocki and Żogała2014a; Obreht et al., Reference Obreht, Zeeden, Hambach, Veres, Marković and Lehmkuhl2019; Matoshko, Reference Matoshko2021; Panin et al., Reference Panin, Kalinin, Filippova, Sychev and Bukhonov2023; Kalinin et al., Reference Kalinin, Kudrevatykh, Panin, Mitenko, Malyshev and Alekseev2025). The Middle Dnieper sequence (Ukraine) exemplifies this interaction, with well-preserved markers—such as glacial till from the penultimate glaciation—enabling reconstruction of processes at the glacial–periglacial interface (Matoshko, Reference Matoshko2004; Bradák-Hayashi et al., Reference Bradák-Hayashi, Biró, Horváth, Végh and Csillag2016). This setting offers a means to assess how pedogenic and diagenetic overprinting modifies primary depositional signals. Addressing this requires an integrative, multiproxy approach, as outlined by Sprafke and Obreht (Reference Sprafke and Obreht2016) in their revised loess stratigraphy framework, and demonstrated for Ukrainian loess–palaeosol sequences by Hlavatskyi et al. (Reference Hlavatskyi, Gerasimenko, Bakhmutov, Bonchkovskyi, Poliachenko, Shpyra, Mychak, Kravchuk and Cherkes2021).
The aim of this study is to reconstruct Late and Middle Pleistocene environmental conditions in the Middle Dnieper region, with particular emphasis on the interaction of local and regional processes as recorded in the LPS. The analysis focuses on a single profile situated in the Dnieper Valley, investigated using a multiproxy approach. Special attention is given to its potential for stratigraphic correlation along a single latitudinal transect (50°N), integrating both local variability and broader regional patterns. This framework enables identification of the mechanisms governing sedimentation and pedogenesis. It also allows assessment of their temporal and spatial variability across glacial cycles.
Geological and geomorphological context of the middle dnieper valley
The Dnieper Valley has long been a key palaeogeographic corridor in East-Central Europe (Fig. 1A), influencing sediment transport, climate, and hydrology (Matoshko, Reference Matoshko2004; Panin et al., Reference Panin, Borisova, Konstantinov, Belyaev, Eremenko, Zakharov and Sidorchuk2020). Alternating glacial and interglacial phases, together with shifts in the erosional base level, shaped a complex terrace system and dynamic fluvial network. Two LPSs have been documented at Velyka Andrusivka: VA-I (Komar et al., Reference Komar, Krokhmal, Melnik and Prylypko2005) and VA-II (Komar et al., Reference Komar, Łanczont, Fedorowicz, Gozhik, Mroczek and Bogucki2018), the latter investigated here as one of the most complete records in the region (Fig. 1B).
Location of the Velyka Andrusivka site shown against: (A) the main European loess domains after Lehmkuhl et al. (Reference Lehmkuhl, Nett, Pötter, Schulte, Sprafke, Jary and Antoine2021); (B) the distribution of loess after Haase et al. (Reference Haase, Fink, Haase, Ruske, Pécsi, Richter, Altermann and Jäger2007), the extents of glaciations after Ehlers et al. (Reference Ehlers, Gibbard and Hughes2011), and the boundary of continuous permafrost during the last glacial maximum after Lehmkuhl et al. (Reference Lehmkuhl, Nett, Pötter, Schulte, Sprafke, Jary and Antoine2021). Selected loess sites discussed in the text are indicated along the 50°N latitudinal transect from SE Poland to central Ukraine.

The VA-II section (49°05′10.84″N, 33°04′9.54″E), hereafter the Velyka Andrusivka loess–palaeosol sequence (VALPS), is located on the right bank of the Middle Dnieper Valley at the margin of the Dnieper Upland (Supplementary Material 1). It forms part of an extensive succession of Pleistocene aeolian deposits overlying till and fluvioglacial sediments, indicating past ice-sheet influence (Matoshko, Reference Matoshko2004; Gerasimenko, Reference Gerasimenko2006; Gozhik et al., Reference Gozhik, Komar, Łanczont, Fedorowicz, Bogucki, Mroczek, Prylypko and Kusiak2014; Panin et al., Reference Panin, Borisova, Konstantinov, Belyaev, Eremenko, Zakharov and Sidorchuk2020). The area lies within the maximum extent of the Dnieper Glaciation, variably assigned to MIS 8 (Gozhik et al., Reference Gozhik, Komar, Łanczont, Fedorowicz, Bogucki, Mroczek, Prylypko and Kusiak2014; Komar et al., Reference Komar, Łanczont, Fedorowicz, Gozhik, Mroczek and Bogucki2018; Mroczek et al., Reference Mroczek, Krokhmal’, Komar and Łanczont2025) or MIS 6 (Popova et al., Reference Popova, Kovalchuk, Barkaszi and Rekovets2025a, Reference Popova, Veklych, Kovalchuk, Mishta, Stachowicz-Rybka, Gorobets and Yanenko2025b). Comparable glacial deposits, including till and glaciofluvial or lacustrine facies, are found throughout the valley (cf. Komar et al., Reference Komar, Krokhmal, Melnik and Prylypko2005, Reference Krokhmal’ and Komar2018), with sandur and till also occurring on the opposite Dnieper Lowland (Gozhik et al., Reference Gozhik, Gerasimenko, Matviishina, Palienko, Korniets, Komar and Mel’nichuk2001a, Reference Gozhik, Komar, Łanczont, Fedorowicz, Bogucki, Mroczek, Prylypko and Kusiak2014; Stecyuk, Reference Stecyuk2010). Erratics near Hradyzk, sourced from the Moscow Syneclise, further attest to long-distance ice transport (Ohar, Reference Ohar2020).
The valley near the VA site is asymmetrical, with a high, steep right bank and a lower, gentler left bank, reflecting tectonic control and lithological contrasts (Gozhik et al., Reference Gozhik, Gerasimenko, Matviishina, Palienko, Korniets, Komar and Mel’nichuk2001a, Reference Gozhik, Matviishina, Gerasimenko, Rekovets and Shelkopyas2001b; Matoshko, Reference Matoshko2004; Popova et al., Reference Popova, Veklych, Kovalchuk, Mishta, Stachowicz-Rybka, Gorobets and Yanenko2025b). Intensive landscape modification during the Pleistocene produced numerous gullies and facilitated loess deposition. Today, the steep cliff is reshaped by bank erosion and slope instability, intensified by fluctuating Kremenchuk Reservoir levels, which expose sedimentary successions of variable structure and stratigraphy (Obodovskyi et al., Reference Obodovskyi, Habel, Szatten, Rozlach, Babiński and Maerker2020; Szmańda et al., Reference Szmańda, Gierszewski, Habel, Luc, Witkowski, Bortnyk and Obodovskyi2021).
Methods
Fieldwork and sample collection
During field investigations at VA (2019–2021), the 20.5-m-thick loess–palaeosol sequence was documented and cleaned following FAO (2006) guidelines (Supplementary Material 2). The upper 8.5 m were examined directly on a vertical cliff face using rope-supported access techniques, while deeper units were accessed via a stepped excavation trench. Sampling strategies varied by analytical method. For spectrophotometry, 338 samples were collected at 5 cm intervals using the continuous column sampling method. For anisotropy of magnetic susceptibility (AMS), 83 undisturbed samples were taken with a cylindrical steel sampler (25 mm × 22 mm) at 10 cm intervals, reduced to 5 cm where shifts in depositional regime were expected, avoiding roots, burrows, and concretions. For geochemistry, loose sediment samples were taken from genetically significant horizons representing the main litho- and pedostratigraphic units. Luminescence dating involved 10 duplicate samples extracted in sealed tubes inserted horizontally into the loess face, with additional in situ sediment collected for dose-rate and moisture determination. An additional sedimentary sequence described by Komar et al. (Reference Komar, Krokhmal, Melnik and Prylypko2005) was used for palynology; results are interpreted within the established Pleistocene stratigraphic framework (Kukla and An, Reference Kukla and An1989; Marković et al., Reference Marković, Bokhorst, Vandenberghe, McCoy, Oches, Hambach and Gaudenyi2007) and correlated with regional Ukrainian stratigraphy (Veklitch, Reference Veklitch1993; Gozhik et al., Reference Gozhik, Lindner and Marks2012).
Granulometric analysis and sediment characterization
A total of 338 sediment samples were air-dried, sieved to <2 mm, homogenised, and weighed (∼5 g) before analysis. Pretreatment removed organic matter and carbonates by sequential addition of 10 ml of 20% H₂O₂ and 10 ml of 10% HCl, followed by dispersion with 10 ml of 0.05 N sodium hexametaphosphate (Na(PO₃)₆) (cf. Schulte et al., Reference Schulte, Lehmkuhl, Steininger, Loibl, Lockot, Protze, Fischer and Stauch2016). Grain-size distribution was measured using a Malvern Mastersizer 2000 laser diffractometer with a Hydro G wet dispersion unit (0.02–2000 µm range). Optical parameters included a refractive index of 1.33 for water and 1.544 for solids, with an absorption coefficient of 0.1. The Lorenz-Mie theory was applied. Before measurement, samples were homogenised for 5 min at 80% sonication power; obscuration was maintained at 12–16%, with pump and agitator set at 2000 rpm. Each sample was measured three times, and results were averaged.
Following the measurements (Supplementary Material 3), the sediment was classified into three main fractions: clay (<5.5 µm), silt (5.5–63 µm), and sand (>63 µm). Granulometric indices were calculated following Folk and Ward (Reference Folk and Ward1957), yielding mean grain size, sorting, skewness, and kurtosis. The grain-size index (GSI; 20–50 μm/<20 μm) and U-ratio (16–44 μm/5.5–16 μm) were also computed (Rousseau et al., Reference Rousseau, Antoine, Hatté, Lang, Zöller, Fontugne and Ben Othman2002; Antoine et al., Reference Antoine, Rousseau, Moine, Kunesch, Hatté, Lang, Tissoux and Zöller2009; Újvári et al., Reference Újvári, Kok, Varga and Kovács2016). The GSI serves as a proxy for dust transport intensity, with higher values indicating stronger aeolian activity and coarser dust deposition. The U-ratio reflects climate variability, with higher values associated with increased coarse dust input during colder, windier phases and lower values indicating finer sedimentation during warmer intervals. Granulometric data were additionally visualised as a heat map, with percentage distribution arranged into 100 logarithmically scaled classes and 36 colour intervals set at 0.174%.
Spectrophotometric and RGB-based colour analysis
Colour measurements were performed using a 3ColorSFX50 spectrophotometer, set to a 10° observation angle and calibrated with D65 standard light to ensure consistency across samples (Supplementary Material 4). The analysis focused on three primary parameters: lightness (L*), green-red (a*), and blue-yellow (b*). Lower L* values indicate a greater presence of dark particles, which are often associated with organic-rich layers (such as the A horizon). The a* parameter reflects iron oxide content and weathering intensity (cf. Sprafke et al., Reference Sprafke, Schulte, Meyer-Heintze, Händel, Einwögerer, Simon, Peticzka, Schäfer, Lehmkuhl and Terhorst2020), while the b* value provides insights into the relationship between yellow and blue components, offering an additional perspective on postdepositional colour shifts.
To assess the balance between red and yellow hues in the sediments, the b*/a* ratio was calculated, providing a useful indicator of mineral composition and weathering trends. Additionally, the Redness Index (RI) was employed to estimate haematite content, following the formula established by Barrón and Torrent (Reference Barron and Torrent1986). This index is particularly valuable in evaluating iron oxide concentrations, which influence the red tones present in the sediments. Variations in RI values across the stratigraphic profile reflect dynamic depositional and diagenetic processes affecting the loess at different depths.
To enhance the accuracy of colour representation, RGB tuning was conducted following the method described by Sprafke et al. (Reference Sprafke, Schulte, Meyer-Heintze, Händel, Einwögerer, Simon, Peticzka, Schäfer, Lehmkuhl and Terhorst2020), with maximum tuning (RGBmax) applied for optimised visualisation. RGBmax served as the background reference for other proxy plots and visual cross-checks. This method was specifically used to enhance contrast between stratigraphic units, making colour differences more distinct between loess and soil layers. As a result, RGB tuning allowed for the identification of subtle colour variations that correspond to mineralogical and pedogenic differences across the sequence. The Colour QC software (v. 2.79.0.0) was utilised to streamline the analytical process and ensure the reproducibility of results.
Geochemical techniques and procedures
For geochemical analysis, 35 samples representing the main pedo-lithological units of the VALPS (Supplementary Materials 5 and 6) were analysed at Bureau Veritas (formerly ACME Labs; LF200 package) using inductively coupled plasma-emission spectrometry and inductively coupled plasma-mass spectrometry. Before analysis, samples underwent lithium borate fusion in a high-temperature furnace, followed by dissolution of the cooled alloy in ACS-grade nitric acid. To minimise the influence of grain-size differentiation (Nesbitt and Young, Reference Nesbitt and Young1982; Shao et al., Reference Shao, Yang and Li2012; Guan et al., Reference Guan, Zhu, Zhu, Wu and Li2016) and coarse local material (Skurzyński et al., Reference Skurzyński, Jary, Raczyk, Moska, Korabiewski, Ryzner and Krawczyk2019), all material was dry-sieved to <63 µm. Analytical precision, evaluated from eight replicate measurements of the certified STD SO-19 standard (internal Bureau Veritas reference material, unpublished), yielded relative standard deviation (RSD) values below ±10% for all elements, and substantially lower in most cases. Method detection limits, analytical precision (RSD), detailed elemental concentrations, and comparative datasets are presented in Supplementary Material 7. As most elements were nonnormally distributed (Shapiro-Wilk test), medians were used for statistical representation. Given the limited number of samples per unit, intra-unit statistical comparisons were not feasible; instead, geochemical variability was assessed using geochemical diagrams. Elemental concentrations were normalised to Upper Continental Crust (UCC; Rudnick and Gao, Reference Rudnick, Gao, Holland and Turekian2003) and the Polish Median Loess dataset (PML; Skurzyński et al., Reference Skurzyński, Jary, Fenn, Lehmkuhl, Raczyk, Stevens and Wieczorek2024). Weathering intensity was evaluated using the A-CN-K ternary diagram (Nesbitt and Young, Reference Nesbitt and Young1984; Supplementary Material 8), with CaO* (Ca in silicates) calculated following McLennan (Reference McLennan1993).
Measurement of magnetic susceptibility and its anisotropy
Magnetic susceptibility and its anisotropy (Supplementary Material 9) were measured in volume-specific units (10⁻⁵ SI) using an MFK1-FB Kappabridge (Agico Ltd., Brno), consistent with standard loess studies and allowing direct comparison with other published profiles. Bulk density variation among samples was <3%, so additional mass normalisation was not applied. AMS parameters were computed in ANISOFT following Jelínek (Reference Jelínek1981). Measurement precision was assessed using linear perturbation analysis with 95% confidence uncertainty ellipses (Jelínek, 1978), with semi-axes (ε) assigned to Kmax, Kint, and Kmin. Statistically significant lineation was defined by ε12 < 22.5° and F12 > 4, and foliation by ε23 < 30° and F23 > 10 (Lagroix and Banerjee, Reference Lagroix and Banerjee2004). Samples with Kmin inclination <60° were excluded from palaeowind reconstructions due to likely postsedimentary disturbance. For flow-aligned fabrics, the azimuth of Kmin imbrication was considered antiparallel to wind direction (Bradák et al., Reference Bradák, Újvári, Seto, Hyodo and Végh2018), consistent with Kmax alignment ∼180° offset from Kmin under weak-moderate wind transport (Tarling and Hrouda, Reference Tarling and Hrouda1993); variability of Kmax orientations under stronger winds precluded their use as direct palaeowind indicators. The contribution of ferromagnetic minerals to bulk susceptibility was assessed by comparison with anhysteretic remanent magnetisation (ARM) and isothermal remanent magnetisation (IRM). ARM was induced using an LDA5 AF demagnetiser (Agico, Brno) in a 100 mT alternating field with a 0.1 mT DC field, while IRM was generated by applying a 2 T field using an MMP1 pulse magnetiser (Magnetic Measurements, UK).
Palynology and quantitative palaeoclimate modelling
Palynological data for the VALPS profile, excluding the L1LL1 subunit, were originally obtained and published by Komar et al. (Reference Komar, Krokhmal, Melnik and Prylypko2005) (Supplementary Material 10). In the present study, these results are reevaluated and integrated into a new palaeoenvironmental framework. Pollen spectra were assigned to biome types (Tarasov et al., Reference Tarasov, Webb, Andreev, Afanas’eva, Berezina, Bezusko and Blyakharchuk1998)—tundra, cold mixed forest, cold coniferous forest, cold deciduous forest, temperate deciduous forest, and steppe (Supplementary Material 11). Quantitative reconstructions of coldest month mean (CMM), warmest month mean (WMM), mean annual temperature (MAT), and mean annual precipitation (MAP) were performed using the coexistence approach (Mosbrugger and Utescher, Reference Mosbrugger and Utescher1997), with thermal ranges corresponding to the identified taxa. Interpretation accounted for the aeolian depositional context and postdepositional diagenesis, particularly in alkaline settings, where near-complete destruction of pollen from Populus, Fraxinus, Larix, Juniperus, certain Cupressaceae, and Poaceae was observed (Grichuk, Reference Grichuk1978, Reference Grichuk1989; Birks and Birks, Reference Birks and Birks1980; Faegri and Iversen, Reference Faegri and Iversen1989).
Palaeozoological analyses of faunal assemblages
Local palaeoenvironmental conditions were inferred from small mammal (micromammalia) and terrestrial and freshwater molluscan (malacofaunal) assemblages recovered from fluvioglacial sediments directly overlying glacial till in the profile that was also analysed palynologically (Supplementary Material 12). Samples were processed by wet sieving and flotation; small mammal remains were identified mainly from first lower molars (m1) following Quaternary phylogenetic frameworks for Eastern Europe (Krokhmal’ et al., Reference Krokhmal’, Rekovets and Kovalchuk2021), while molluscs were classified using standard keys and reference collections. Preliminary results were published by Komar et al. (Reference Komar, Krokhmal, Melnik and Prylypko2005). Palaeoenvironmental interpretation draws on the modern ecological preferences of the identified taxa, supported by regional comparative data from Ukraine (Krokhmal’ and Komar, Reference Krokhmal’ and Komar2018; Popova et al., Reference Popova, Veklych, Kovalchuk, Mishta, Stachowicz-Rybka, Gorobets and Yanenko2025b).
Luminescence dating methodology
Optically stimulated luminescence (OSL) dating was applied to establish the chronological framework of the VALPS. All luminescence measurements were performed by Karol Standzikowski at the Luminescence Laboratory, Institute of Earth and Environmental Sciences, Maria Curie-Skłodowska University (Lublin, Poland). The complete dataset—including raw measurement files (.sec, .binx), gamma-spectrometry results, dose-rate spreadsheets, supplementary methodological notes, and representative preheat-plateau and shine-down curves—is archived in the Zenodo repository (Mroczek and Standzikowski, Reference Mroczek and Standzikowski2025), with all methodological notes, quality-control figures, and full raw luminescence and gamma-spectrometry data additionally provided in Supplementary Data S1–S3.
Quartz grains of the 45–63 µm fraction were used as the dosimeter. Sample preparation followed standard procedures, including drying, gentle disaggregation, sieving, removal of carbonates (10% HCl) and organic matter (30% H₂O₂), and heavy-liquid separation where required. No HF etching was applied for safety reasons; therefore, minor feldspar presence cannot be excluded. Nevertheless, fast component–dominated decay curves, low recuperation, and stable single-aliquot regenerative-dose (SAR) behaviour indicate that the measured signal was predominantly quartz-derived.
Measurements were carried out on a Risø TL/OSL DA-20 reader equipped with blue LEDs (470 ± 20 nm) and an EMI 9235QA PMT with a U340 filter. The SAR protocol (Murray and Wintle, Reference Murray and Wintle2000) was employed. Each cycle consisted of a regenerative β dose, preheat at 260°C for 10 s, OSL stimulation at 125°C for 100 s, a test dose equal to 10% of the natural dose (minimum 5 Gy), cut-heat at 220°C, and test-dose OSL. Five regenerative doses were applied, followed by a repeat dose to assess recycling. A 3 mm mask was used for all aliquots.
The OSL signal was integrated over 0–1 s with a 1–1.5 s background. Shine-down curves confirm rapid decay and low, stable background. Equivalent doses (De) were obtained by fitting a single saturating exponential function to Lx/Tx values. Dose-recovery tests using laboratory doses comparable to natural De values (typically 40–120 Gy) yielded ratios of 0.90–1.10. Recycling ratios fell within ±10%, recuperation was <5%, and aliquots failing these criteria were rejected. Instrument stability was verified through repeated aliquot measurements, with variability <10%. Representative shine-down curves, preheat-plateau tests, and growth curves are provided in the Supplementary Figures. Numbers of analysed versus accepted aliquots and overdispersion values are included in the Supplementary Dataset.
A preheat-plateau test demonstrated stable De and recycling behaviour across 240–320°C; 260°C was selected as the operational preheat. No fading tests were performed, because only quartz was measured and samples were stored in opaque containers; fast-component dominance and negligible recuperation indicate no anomalous fading. Residual dose was not evaluated, as the samples fall outside age ranges where residuals become significant.
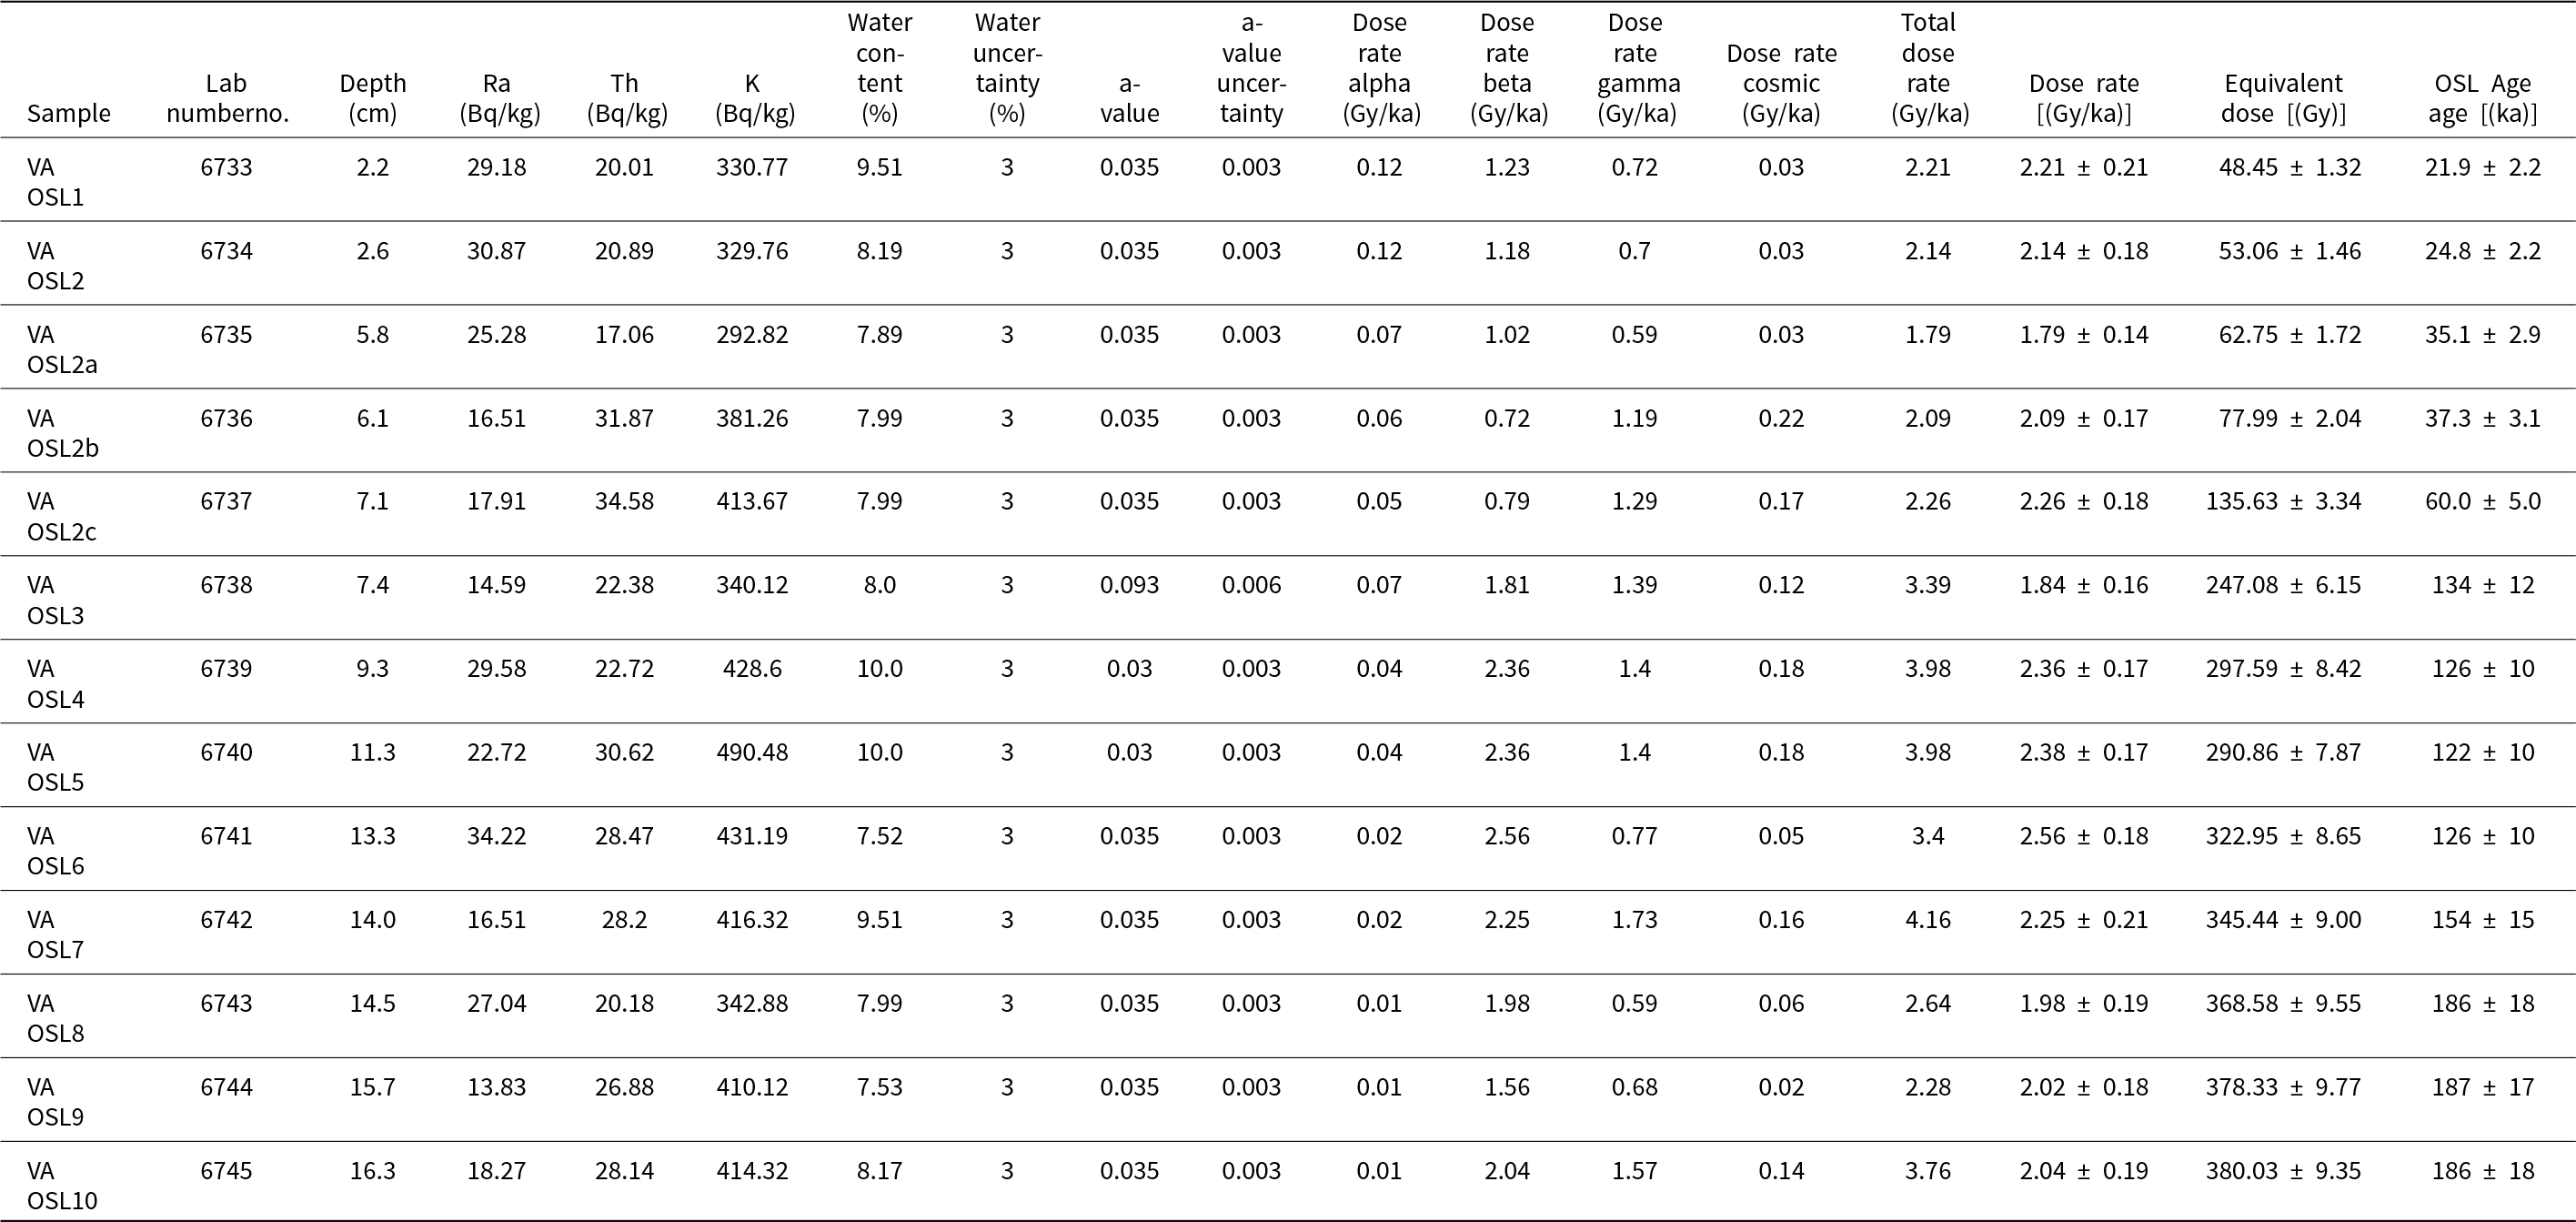
Environmental dose rates were derived from radionuclide activities (Ra-226, Th-232, K-40) measured using a MAZAR-01 gamma-spectrometer (counting time: 40 h). Dose-rate components were calculated following Adamiec and Aitken (Reference Adamiec and Aitken1998), with grain-size attenuation, long-term water content (values as listed in Table 1, with an absolute uncertainty of ±3 percentage points), and cosmic-ray contributions corrected according to Prescott and Hutton (Reference Prescott and Hutton1994), using conversion factors updated after Guérin et al. (Reference Guérin, Mercier and Adamiec2012) and Cresswell (Reference Cresswell, Carter and Sanderson2018). The quartz α-efficiency factor (a-value) was taken as 0.035 ± 0.003, except for sample VA-OSL3, where internal tests justified a higher value (0.0938). Total age uncertainties incorporate statistical errors of De and propagated uncertainties from all dose-rate components.
Optically stimulated luminescence (OSL) dating results for the Velyka Andrusivka loess–palaeosol sequence (VALPS), including annual dose rates, equivalent doses, and luminescence ages.a

a Ages were calculated using the Central Age Model (CAM). The parameter “a” denotes the alpha-efficiency factor used for calculating the alpha dose-rate contribution.
Equivalent dose values were modelled using the Central Age Model (CAM). Overdispersion ranges from 8% to 15%, which falls within typical values for European polygenetic loess. Although some natural signals approach higher dose ranges (up to ∼380 Gy), all accepted De values lie within the non-saturated portion of their growth curves, below the effective saturation threshold inferred from the fitted D₀ values and supplementary growth-curve characteristics. A concise summary of SAR parameters, quality-control criteria, and dose-rate calculations is provided in the Supplementary Methodological Notes.
Construction and visualization of the correlation matrix
Two representative loess units, L2 and L1LL1, were selected for correlation analysis as relatively unaltered horizons suitable for assessing primary depositional versus postdepositional controls (Supplementary Material 13). Grain-size and spectrophotometric indicators were examined in both units, with magnetic parameters additionally considered for L2 to evaluate sedimentological relationships and alteration signals.
Correlation matrices were generated using the Python computational environment (v. 3.11) with the libraries pandas (for tabular data manipulation), numpy (for numerical operations), matplotlib (for data visualisation), and statsmodels (for statistical processing). To assess the strength, direction, and consistency of associations between quantitative variables, both Pearson’s correlation coefficient (for linear relationships) and Spearman’s rank correlation coefficient (to account for potential nonlinearities or outliers) were applied. Comparisons between units were made by calculating the difference in correlation coefficients (Δr = r_L2 − r_L1LL1) for both methods. The resulting matrices were visualised as lower-triangular heat maps containing numeric values, while the upper triangle featured circles representing the magnitude and direction of correlation or correlation differences. Colour mapping for comparative matrices was scaled to the full theoretical range of correlation differences (−2.00 to +2.00).
Results
Stratigraphic and pedological framework supported by OSL dating
The geological profile (Fig. 2) comprises a succession of lithological and soil units with a total thickness of approximately 20.5 m. Depths cited in this section refer to the composite profile, which was assembled by correlating marker horizons, erosional surfaces, and distinctive lithological features between exposures and trench sections. Original top and bottom depths for each sampled interval (Supplementary Material 2), along with their corresponding composite depths, are listed in Table 1. OSL dating of the VALPS yielded ages ranging from approximately 22 ka to 187 ka. For clarity, these results are presented in five main clusters: (1) ∼20–40 ka in the upper part of the sequence; (2) ∼60 ka in a single unit within upper soil horizons; (3) ∼122–134 ka in the middle part of the sequence; (4) ∼154 ka within a lower palaeosol complex; and (5) ∼186–187 ka in the basal sediments and the soil directly above them. This clustering corresponds to stratigraphically coherent phases of sedimentation and soil formation, providing a logical framework for subsequent chronostratigraphic interpretation.
Litho- and pedostratigraphy of the Velyka Andrusivka loess–palaeosol sequence (VALPS), showing the main loess and palaeosol units, key stratigraphic markers, and optically stimulated luminescence (OSL) ages. Sediment texture is illustrated schematically at the base using standard symbols (c = clay; si = silt; s = sand; g = gravel; b = boulders). Interpretations of pedogenic processes and depositional environments derive from field observations supported by multiproxy evidence.

The lowermost part of the sequence, exposed at the water level of the reservoir, is a glacigenic complex (AG-I) composed of stratified glacial till overlain by a massive sandy-silty layer. Above this lies a series of clayey-sandy sediments containing scattered clasts, interpreted as limnoglacial deposits. At the top of the unit, two palaeosols (S2SS2 and S2SS1) are preserved, separated by an erosional surface and forming a two-phase palaeosol complex.
Overlying the basal complex is a sequence of silty-sandy deposits comprising L2LL2, a weakly developed palaeosol L2SS1, and L2LL1. This interval exhibits cryogenic deformation, stratification, and poor consolidation and contains carbonates. Above L2LL1, an eroded enrichment horizon of a mature palaeosol S1 occurs, directly overlain by a less-developed enrichment horizon L1SS1. This pedocomplex is capped by the loess layer L1LL1. The uppermost part of the profile is formed by the modern chernozem (S0), which contains a thick tripartite A horizon, a transitional AB horizon, and a carbonate-rich Ck horizon.
In addition to the main cliff exposure (VA-II), an archived section (VA-I) analysed by Komar et al. (Reference Komar, Krokhmal, Melnik and Prylypko2005) is used here to supplement the stratigraphic record. This sequence contains the units L1LL1, L1SS1, L1LL2, S1, L2, S2, and L3. The integration of VA-I with VA-II provided a more complete view of the local loess–palaeosol succession.
Colour-based differentiation of depositional and pedogenic units
In the VALPS, RGBmax tuning was achieved after two calibration steps, significantly enhancing the colour contrast between stratigraphic units (Fig. 3A). The lowest RGB values, which constrained the tuning range, were recorded in the upper subhorizon of the S0 chernozem, appearing nearly black. Spectrophotometric parameters differ systematically between loess and palaeosol units. Loess horizons (L2LL2, L2LL1, L1LL1) display high lightness (L*: ∼65–70), low a* (∼1.5–3), stable b* (∼17–18), and high b*/a* ratios (∼7–9). Palaeosols show lower L* (∼45–58), increased a* (∼3.5–5.5), reduced b*/a* (∼3–5), and higher RI (∼0.5–1.8). Transition zones such as L2SS1 and S1+L1SS1 exhibit abrupt parameter shifts. The strongest contrast is observed in the S0 unit, with a decrease in L* (∼65 to ∼45), a* (∼2 to ∼1), and b* (∼17 to ∼4), accompanied by a rise in RI (∼0.3 to ∼1.8). These numerical trends define spectrally distinct horizons that correspond with the litho-pedostratigraphic structure of the profile.
Spectrophotometric and granulometric data from the Velyka Andrusivka loess–palaeosol sequence (VALPS) sequence: (A) RGB tuning and main spectrophotometric parameters; (B) grain-size fractions and indices (GSI, grain-size index); (C) heat map of grain-size frequency subdivided into subfractions. Curves in A and B are plotted against the background of maximum RGB tuning.

Grain-size variability and sedimentary differentiation
At the base (upper glacial till; Fig. 3B), sediments are sand-rich and coarse (mean 52.71–160.90 µm), very poorly sorted (2.18–2.45), and mostly flat-topped (kurtosis 0.81–1.12), with skewness from −0.11 to 0.35. GSI is low and stable (≈1.13–1.26), as is the U-ratio (2.62–2.88), and spectra are bi- to trimodal with peaks in very fine-fine sand and very coarse silt (Fig. 3C).
The overlying limnoglacial sediments and bipartite S2 palaeosol complex are silty-sandy with similar statistics: mean 49.04–83.59 µm, poor sorting (2.11–2.49), skewness turning from slightly positive to negative upwards, and low kurtosis (≈0.93–1.23). Indices vary little (GSI ≈1.13–1.33; U-ratio 2.59–3.08), and spectra are predominantly bimodal (coarse silt with very fine-fine sand).
The S2SS1 palaeosol shows a marked sand increase (mean 61.29–181.30 µm), better sorting than below (1.51–2.30), consistently positive skewness (0.02–0.47) and meso- to leptokurtic shapes (0.94–1.51). Indices remain steady (GSI 1.14–1.53; U-ratio 2.67–3.82). Distributions are bimodal and fine-sand dominated.
The L2 unit (L2LL2-L2SS1-L2LL1) is silty-sandy with broadly stable means, inverse silt-sand shifts and near-constant sorting around unity, punctuated by better-sorted beds. Skewness is generally positive with local peaks; kurtosis is similarly elevated but falls in the same intervals. Both GSI and U-ratio are relatively high and stepwise. In the upper L2LL1 (8.20–7.50 m) the sediment coarsens, sorting deteriorates (∼1.44), skewness varies (−0.06 to 0.23), kurtosis drops (0.95–1.09), and both GSI (∼2.18) and U-ratio (∼4.31) fall, indicating reduced textural maturity. The unit remains unimodal overall but notably heterogeneous.
The bipartite S1+L1SS1 soil complex is finer than the underlying loess (mean 40.89–98.06 µm), with generally poor sorting (1.39–2.04) that slackens slightly midprofile. Skewness fluctuates between −0.06 and 0.20 and kurtosis spans 1.06–1.79 (on average higher than in L2). Indices vary moderately (GSI 1.53–2.60; U-ratio 3.24–5.21). The distribution is mostly unimodal, locally bimodal, and fine-fraction dominated.
Overlying L1LL1 loess is slightly coarser (40.27–87.93 µm), with consistently poor sorting (1.22–1.98). Skewness is generally positive (−0.16 to 0.33) and rises upwards; kurtosis is variable low down (1.12–1.79) but stabilises higher up. GSI ranges from 1.92 to 3.32 and the U-ratio from 4.26 to 8.03; spectra remain mainly unimodal.
The S0 chernozem differs clearly from the loess, with slight up-profile coarsening (50.36–64.88 µm), poor but steady sorting (1.06–1.39), near-symmetric skewness (−0.01 to 0.24) and limited kurtosis variability (1.33–1.75). GSI (2.62–4.11) and U-ratio (5.75–7.94) rise gently upwards, while distributions remain unimodal, consistent with overall grain-size stability despite pedogenesis.
Elemental composition and geochemical variability
At the VALPS, the soil units, particularly S0 and S1+L1SS1, exhibit distinct chemical characteristics compared with the loess units from which they formed (Fig. 4). The variability of major, trace, and rare earth elements (REEs) is presented here for the main stratigraphic divisions.
Vertical distribution of selected major, trace, and rare earth elements (REEs), and key geochemical indices in the Velyka Andrusivka loess–palaeosol sequence (VALPS) sequence. RGBmax tuning was used as background. Lithological and pedological explanations as in Figure 2.

The S2 palaeosol complex is characterized by elevated Al₂O₃ and Rb values and low Zr values compared with the overlying loess. However, it is less geochemically distinct compared with the loess units than the younger soil horizons.
The L2LL2 loess is enriched in Hf, U, W, Zr, Y, and REEs, particularly heavy REEs (HREEs; from Tb to Yb), compared with other loess units. In contrast, it contains relatively high levels of MgO and CaO; the lowest median Fe₂O₃ content; and low concentrations of Al₂O₃, Co, Cs, Ga, and V. The only unit with similar characteristics is the overlying L2LL1 loess, indicating a consistent geochemical trend between the two L2 loess subunits. It is important to note, however, that only three samples were collected from this unit, all showing significant geochemical variability. For example, the sample from a depth of 13.7 m exhibited elevated MnO and high concentrations of TiO₂, Co, Hf, Nb, Th, U, Zr, and REEs.
Although L2LL1 is genetically closely related to the L2LL2 loess, it stands out clearly with, among other things, the lowest median values for SiO₂, Al₂O₃, Sc, Co, Cs, Ga, Nb, Rb, Ta, and V, and the highest for loss-on-ignition (LOI), MgO, CaO, Na₂O, K₂O, and P₂O₅.
The S1+L1SS1 pedocomplex is characterized by a low median SiO₂ content, second only to L2LL1 loess, and the highest median values in the VALPS for Al₂O₃, Fe₂O₃, TiO₂, Sc, Co, Cs, Ga, and V. Notably, it exhibits a high median CaO content, second only to L2LL1 loess, and the highest Sr median in the entire sequence.
The L1LL1 loess differs from other loess units (especially from the L2LL1) by its lower contents of MgO, CaO, and LOI, with only the S0 soil showing lower values. It also has the lowest median K₂O content in the entire sequence, although K₂O levels in L1LL1 vary significantly between individual samples. The median total REE content, as well as the ΣLREE and ΣHREE values, are also low. In contrast, the median SiO₂ content in L1LL1 is the second highest in the sequence, exceeded only by the S0 soil. Furthermore, several elements, including Sc, Co, Cs, and Ga, show higher median values in L1LL1 compared with the underlying L2LL1 loess.
The S0 soil is the only clearly decalcified unit in the sequence, characterized by low median values of MgO, CaO, and Sr, indicating significant carbonate depletion. However, signs of secondary recalcification are present in the Ck horizon at a depth of 2.1–2.5 m. This soil also has the lowest median LOI among all analysed units. In contrast, the S0 soil shows the highest median values in the entire sequence for several elements, including SiO₂, Cr, Ba, Hf, Nb, Ta, Th, U, W (equal to L2LL2), Zr (slightly higher than L2LL2), Y (slightly higher than L2LL2), and nearly all REEs. Most HREEs have median values similar to those in L2LL2. The S0 soil is divided into four subhorizons, with elemental variations reflecting these subdivisions to varying degrees. SiO₂ content slightly decreases with depth, while Al₂O₃ and Fe₂O₃ generally increase throughout the A horizon. Mn content remains stable, except for one outlier at a depth of 1.45 m. Elements such as Na₂O, K₂O, TiO₂, Nb, U, and REEs help distinguish two subhorizons within the A horizon. While REEs as a group follow similar trends, individual REEs show some variation. Notably, relatively high P₂O₅ content was found in the two uppermost soil samples.
Magnetic susceptibility and AMS results
Magnetic susceptibility (K) in the VALPS ranges from 56 × 10⁻⁶ SI to 409 × 10⁻⁶ SI (mean: 156 × 10⁻⁶ SI). The highest values are recorded in L2LL1 and L2LL2 (e.g., 409 at 9.15 m; 311 at 13.7 m), while minima occur in L2SS1 (e.g., 96 at 10.7 m), S2SS1, and S2SS2 (Fig. 5).
Magnetic susceptibility (K) and anhysteretic remanent magnetisation (ARM) in the Velyka Andrusivka loess–palaeosol sequence (VALPS), plotted against an RGBmax background (upper panel). The lower panels show stereographic projections of principal susceptibility axes (K1, K2, K3), a correlation plot between K and ARM with a 95 % confidence interval, and AMS parameters (degree of anisotropy [Pj], and shape parameter [T]) plotted against susceptibility values, highlighting depositional and postdepositional processes.

ARM ranges from 7.6 × 10⁻3 A/m to 24.0 × 10⁻3 A/m, with peaks also in L2LL2 and L2LL1 (e.g., 24.0 at 14.2 m; 22.8 at 13.9 m; 19.8 at 9.15 m). ARM moderately correlates with K (r = 0.53), with the regression line ARM = 0.032 × K + 8.229 and a 95% confidence interval indicating moderate scatter.
AMS parameters show a mean degree of anisotropy (Pj) of 1.047 (range: 1.019–1.119), and an average shape parameter (T) of 0.174 (range: −1 to +1). The principal susceptibility axes (K₁, K₂, K₃) exhibit a dispersed stereographic distribution, without a dominant vertical alignment of K₃.
Stratigraphic segmentation reveals clear magnetic patterns: L2LL1 and L2LL2 exhibit elevated K and ARM values, particularly the latter, which also shows greater internal variability. In contrast, L2SS1, S2SS1, and S2SS2 record markedly lower values. AMS data from the palaeosols indicate weak anisotropy and foliation-dominated fabrics with scattered directional trends.
Pollen data and reconstructed vegetation patterns
Pollen assemblages show systematic changes across the VALPS (Supplementary Material 10). In this aeolian context, a regionally integrated signal is likely—especially for long-distance taxa such as Pinus—and a proportion of redeposited grains is present (up to approximately 30% in VA-1).
In the L3 loess (VA-1, VA-2), arboreal pollen is lowest in the record and herbaceous taxa dominate (about 67%), with high shares of Artemisia alongside Amaranthaceae, Brassicaceae and Cichorioideae. Microtherm indicators include Alnaster fruticosus, Betula nana, and Salix polaris. Spores (Selaginella selaginoides, Sphagnum, Riccia) are present, and rare green algae (Pediastrum kawraiskyi, Pediastrum simplex) occur. VA-2 shows a slight rise in arboreal pollen and a decline in microtherms, accompanied by more diverse herb and spore spectra.
The S2 palaeosol (VA-3) records increased broad-leaved taxa (Quercus, Ulmus, later Carpinus) and shrubs (Crataegus, Rhamnus, Viburnum), with diversification of herbaceous and aquatic components and higher spore percentages (Polypodiaceae, Bryales). Algae (Pediastrum spp., Botryococcus) appear sporadically.
In the L2 loess (VA-4), arboreal pollen decreases with Pinus predominant, while Amaranthaceae and Artemisia regain prominence. Cold-adapted taxa such as Linnaea borealis and Thalictrum reappear; Bryales spores and redeposited forms increase, consistent with erosion and unstable soils.
The S1 palaeosol complex (VA-5) shows higher tree pollen (AP = 25.2% to 47.4%), with Corylus increasing towards the top. Broad-leaved and coniferous elements co-occur, while diversity within herbaceous taxa remains stable but their relative abundances decline. Spore counts (Polypodiaceae, Bryales) rise again.
The L1LL2 loess (VA-6) has impoverished arboreal spectra dominated by Pinus, with minor Betula, Picea, Alnus, Quercus, and Carpinus. Herb pollen is diverse (Poaceae, Asteraceae–Artemisia–Amaranthaceae), with additional photophilous taxa (e.g., Helianthemum). Spore abundance is low, whereas redeposited forms increase. The vegetation suggests open steppe communities with isolated pine–birch stands in protected areas.
Small mammal and mollusc assemblages
A well-preserved faunal assemblage, comprising both small mammal remains and abundant terrestrial and freshwater mollusc shells, was identified within the fluvioglacial sediment layer (Supplementary Material 12). The micromammalian component included taxa typical of steppe periglacial environments, such as Ochotona pusilla, Ellobius talpinus, Mimomys sp., and Microtus cf. economus, suggesting a mosaic periglacial landscape dominated by steppe and moist open habitats—meadows, peat bogs, and shrublands—especially within topographic depressions and river valleys. These indicators point to a moderately cold climate with seasonally wet microclimatic conditions (Krokhmal’ and Komar, Reference Krokhmal’ and Komar2018; Krokhmal’ et al., Reference Krokhmal’, Rekovets and Kovalchuk2021; Popova et al., Reference Popova, Veklych, Kovalchuk, Mishta, Stachowicz-Rybka, Gorobets and Yanenko2025b). The terrestrial malacofauna, including Succinea oblonga, S. oblonga elongata, Succinea cf. putris, and Vallonia tenuilabris, further reflects open, moist biotopes subject to episodic flooding, such as wet meadows, moss-rich areas, and valley floors. The aquatic component—Valvata pulchella, Bithynia sp., Lymnaea (Stagnicola) palustris, Planorbis planorbis, and Anisus spirorbis—indicates the presence of small, stagnant water bodies and slow-flowing streams typical of marginal zones associated with the retreat of the Dnieper Ice Sheet (Komar et al., Reference Komar, Krokhmal, Melnik and Prylypko2005).
Interpretation and discussion: age constraints, stratigraphic coherence, and environmental processes
Chronostratigraphic framework and associated OSL dating uncertainties
Comparison with global MIS boundaries (Martinson et al., Reference Martinson, Pisias, Hays, Imbrie, Moore and Shackleton1987; Lisiecki and Raymo, Reference Lisiecki and Raymo2005) indicates that the uppermost loess unit L1LL1 was deposited during MIS 2, with ages between 21.9 ± 2.2 and 24.8 ± 2.0 ka (VA OSL1 and OSL2), consistent with the late last glacial maximum (Fig. 2; Table 1). The underlying stacked pedocomplex comprises a mature interglacial soil formed in MIS 5e (S1) overlain by an MIS 3 soil (L1SS1). Two samples yielded 35.1 ± 2.9 ka and 37.3 ± 3.1 ka (VA OSL2a, VA OSL2b), one gave 60.0 ± 5.0 ka (VA OSL2c), and another returned 134 ± 12 ka (VA OSL3); the isolated MIS 5 age is attributable to S1, with limited pedoturbation across the S1/L1SS1 contact a plausible explanation where detected within the upper horizon. A pronounced depositional hiatus spans most of MIS 5d–4, followed by renewed sedimentation during MIS 3.
The uppermost part of L2 accumulated close to Termination II (ca. 122–126 ka), that is, in the latest MIS 6, and deposition ceased around the onset of MIS 5e. Below, the mature palaeosol complex S2 (154 ± 13 ka; VA OSL7) and the basal glaciolacustrine sediments of AG-I (186–187 ka; VA OSL8-OSL10) fall within MIS 6, with AG-I lying close to the MIS 7/6 transition. In regional stratigraphic frameworks, these deposits are correlated with the Dnieper glaciation, which is generally assigned to MIS 8, highlighting a notable offset between OSL ages and stratigraphic expectations (for discussion, see Mroczek et al., Reference Mroczek, Krokhmal’, Komar and Łanczont2025).
Potential causes of chronological offsets include incomplete bleaching of quartz before burial, particularly in rapidly accumulated aeolian or waterlain sediments (Fuchs and Owen, Reference Fuchs and Owen2008; Rhodes, Reference Rhodes2011); postdepositional mixing through bioturbation or pedogenesis in palaeosols (Buylaert et al., Reference Buylaert, Murray, Thomsen and Jain2009; Thiel et al., Reference Thiel, Buylaert, Murray and Tsukamoto2011); residual doses in polymineral fractions; and uncertainties in dose-rate determination in heterogeneous sediments (Preusser et al., Reference Preusser, Degering, Fuchs, Hilgers, Kadereit, Klasen, Krbetschek, Richter and Spencer2008; Kreutzer et al., Reference Kreutzer, Schmidt, Fuchs, Dietze, Fischer and Fuchs2012). These factors are especially relevant for units older than MIS 5, where age–stratigraphy mismatches are well documented in LPSs (cf. Fedorowicz et al., Reference Fedorowicz, Łanczont, Bogucki, Kusiak, Mroczek, Adamiec, Bluszcz, Moska and Tracz2013; Łanczont et al., Reference Łanczont, Mroczek, Komar, Fedorowicz, Woronko, Nawrocki, Frankowski and Standzikowski2022a, Reference Łanczont, Mroczek, Komar, Fedorowicz, Woronko, Nawrocki, Frankowski and Standzikowski2022b), and help to explain the presence of several outlier ages in the dataset. These patterns will be further evaluated in the context of regional loess–palaeosol correlations.
Parameter correlations and implications for depositional and postdepositional processes
In L1LL1, the finest fractions (<2 µm, 2–5.5 µm) display strong positive correlations with RI, a*, and b*, indicating that pigment intensity and reddish hue are linked to clay and fine silt, reflecting the primary mineralogical composition with limited alteration (Fig. 6A). U-ratio and GSI correlate positively with medium-coarse silt (20–63 µm), confirming their sensitivity to aeolian transport energy. L* is negatively correlated with RI and a*, suggesting that darker, redder sediments are enriched in iron oxides and fine particles. The correlation matrix exhibits a coherent structure, consistent with homogeneous aeolian deposition and minimal secondary overprinting.
Correlation matrices showing relationships between sedimentological and proxy data in the Velyka Andrusivka loess–palaeosol sequence (VALPS) profile. (A) L1LL1 unit; (B) combined L2LL1 and L2LL2 loess units; (C) difference between the matrices (Δr). Colour and circle size indicate the strength and direction of Pearson’s correlation coefficient (r); numerical values are shown in the upper triangle of each matrix.

In L2, correlations are more complex and less coherent, reflecting pedogenic and diagenetic overprinting (Fig. 6B). Associations between fine fractions and spectrophotometric parameters are weaker than in L1LL1, indicating a more variable texture–pigmentation relationship. U-ratio and GSI remain linked to coarser fractions, but correlations with RI and a* are weaker or inverted, suggesting disruption by processes such as carbonate redistribution or iron migration. Magnetic parameters (K, ARM) show low correlations with grain-size and colour variables, indicating decoupling from primary sedimentological controls and modification under fluctuating redox conditions.
The difference matrix (Fig. 6C) shows mostly moderate Δr values (< ±0.5), implying broadly comparable parameter relationships with local deviations. The most pronounced differences involve colour parameters (RI, L*, a*) and grain-size indices (GSI, U-ratio), with L2 showing stronger links to fine fractions and reduced dependence on sorting. These patterns reflect enhanced pigment development and iron oxide redistribution driven by redox-related pedogenesis, confirming that L2 experienced more variable, postdepositional modification and has more complex internal dynamics than the relatively unaltered L1LL1 loess.
Deposition of loess in the context of local and regional environmental factors
The sedimentary record at VALPS captures a sequence of environmental changes in which shifts in grain size, mineral composition, and magnetic properties reflect the combined influence of large-scale atmospheric circulation and local topographic controls. Within the L2 unit, changes in the balance between fine and coarse silt, together with oscillations in transport-sensitive indices (GSI, U-ratio), indicate alternations between stronger winds, variable transport distances, and changing source accessibility patterns consistent with loess sequences in East-Central Europe and Asia (e.g., Renssen et al., Reference Renssen, Kasse, Vandenberghe and Lorenz2007; Stevens and Lu, Reference Stevens and Lu2009; Vandenberghe, Reference Vandenberghe2013; Újvári et al., Reference Újvári, Kok, Varga and Kovács2016; Skurzyński et al., Reference Skurzyński, Jary, Kenis, Kubik, Moska, Raczyk and Seul2020; Költringer et al., Reference Költringer, Stevens, Lindner, Baykal, Ghafarpour, Khormali, Taratunina and Kurbanov2022). These textural changes coincide with marked differences in magnetic susceptibility (K), which peaks in both L2LL2 and L2LL1 but drops sharply in the L2SS1 palaeosol—a pattern atypical for well-developed interglacial pedogenesis (Evans and Heller, Reference Evans and Heller2001; Terhorst et al., Reference Terhorst, Appel and Werner2001; Marković et al., Reference Marković, Hambach, Catto, Jovanović, Buggle, Machalett, Zöller, Glaser and Frechen2009; Baumgart et al., Reference Baumgart, Hambach, Meszner and Faust2013; Bradák-Hayashi et al., Reference Bradák-Hayashi, Biró, Horváth, Végh and Csillag2016; Maher, Reference Maher2016; Bradák et al., Reference Bradák, Seto, Stevens, Újvári, Fehér and Költringer2021; Zeeden and Hambach, Reference Zeeden and Hambach2022) and more consistent with reduced soil formation or locally reducing conditions.
Within L2, the lower subunit (L2LL2) displays the greatest internal variability: grain-size distributions are more heterogeneous, AMS Kmin orientations are dispersed, and transport indices fluctuate strongly, indicating unstable wind regimes and multiple source inputs. Geochemical analyses show selective enrichment in Zr, Hf, and REEs—elements typically hosted by resistant heavy minerals—pointing to efficient aeolian sorting or recycled material (Song et al., Reference Song, Guo, Marković, Hambach, Deng, Chang, Wu and Hao2017; Šimíček et al., Reference Šimíček, Bábek, Hron, Pavlů and Kapusta2021). Similar provenance signals are reported from Poland and Hungary, and more broadly across the East European Plain (EEP), where large-river sediment routing combines far-travelled inputs with substantial local contributions (Bradák-Hayashi et al., Reference Bradák-Hayashi, Biró, Horváth, Végh and Csillag2016; Skurzyński et al., Reference Skurzyński, Jary, Kenis, Kubik, Moska, Raczyk and Seul2020; Költringer et al., Reference Költringer, Stevens, Lindner, Baykal, Ghafarpour, Khormali, Taratunina and Kurbanov2022). However, the small number of samples (n = 3), including one with extreme enrichment, means that localised facies variation cannot be ruled out.
The upper subunit (L2LL1) is more uniform in texture and composition, suggesting steadier sedimentation from a more consistent source. AMS fabrics are stable and foliation-dominated, pointing to primary aeolian settling on a low-angle surface with minimal postdepositional disturbance. Although a carbonate-rich composition, including dolomite, likely lowered Chemical Index of Alteration (CIA) values and muted weathering signals (Nesbitt and Young, Reference Nesbitt and Young1982; Varga et al., Reference Varga, Újvári and Raucsik2011), the chemical homogeneity supports the interpretation of a more uniform dust supply. Comparable bipartite structures have been described at Nussloch, Dolní Věstonice, and Harletz (Antoine et al., Reference Antoine, Rousseau, Zöller, Lang, Munaut, Hatté and Fontugne2001, Reference Antoine, Rousseau, Moine, Kunesch, Hatté, Lang, Tissoux and Zöller2009, Reference Antoine, Moine, Rousseau, Lagroix, Kreutzer, Fuchs, Debret and Svoboda2016, Reference Antoine, Lagroix, Jordanova, Jordanova, Lomax, Fuchs and Debret2019; Pötter et al., Reference Pötter, Seeger, Richter, Brill, Knaak, Lehmkuhl and Schulte2023).
Colour metrics provide an additional perspective: reddish hues (higher a* and RI) are linked to fine fractions, whereas b*/a* shows an inverse trend, consistent with carbonate masking. Magnetic parameters (K, ARM) show only weak relationships with grain size and colour, implying a dominantly detrital magnetic mineralogy with partial modification by postdepositional redox effects. The palynological record—scarce pollen in L2—aligns with interpretations of vigorous aeolian activity, sparse vegetation cover, and minimal organic matter accumulation, in line with other Ukrainian periglacial loess profiles (Gerasimenko, Reference Gerasimenko2006; Popova et al., Reference Popova, Veklych, Kovalchuk, Mishta, Stachowicz-Rybka, Gorobets and Yanenko2025b).
Overall, the L2 succession records alternating episodes of variable and steady dust supply, driven primarily by regional wind systems but modulated by local relief, sediment availability, and near-surface hydrology. The contrast between the heterogeneous, heavy mineral–enriched L2LL2 and the more uniform L2LL1 reflects changing balances between short-range, locally recycled inputs and regionally sourced material under MIS 6 periglacial conditions—consistent with large river–dominated sediment routing and strong spatial (but often limited temporal) provenance variability documented across the EEP (Matoshko et al., Reference Matoshko, Gozhik and Danukalova2004; Panin et al., Reference Panin, Borisova, Konstantinov, Belyaev, Eremenko, Zakharov and Sidorchuk2020, Reference Panin, Kalinin, Filippova, Sychev and Bukhonov2023; Költringer et al., Reference Költringer, Stevens, Lindner, Baykal, Ghafarpour, Khormali, Taratunina and Kurbanov2022; Kalinin et al., Reference Kalinin, Kudrevatykh, Panin, Mitenko, Malyshev and Alekseev2025).
Provenance of loess deposits—integrating local and regional influences
At VALPS, L2LL1 has a coarser mean grain size, is richer in coarse silt and more heterogeneous in grain-size distribution, and shows weaker grain size–colour correlations than L1LL1 (Fig. 6A–C). Together with variable magnetic susceptibility (K) and dispersed AMS Kmin orientations, these features indicate a stronger influence of locally supplied and partly recycled dust, intermittently mixed with distal material (Bradák et al., Reference Bradák, Újvári, Seto, Hyodo and Végh2018; Nawrocki et al., Reference Nawrocki, Bogucki, Gozhik, Łanczont, Pańczyk, Standzikowski, Komar, Rosowieca and Tomeniuk2019). Geochemically, L2LL1—and especially L2LL2—is more variable and enriched in immobile, heavy mineral–hosted elements (Zr, Hf, REEs), with one sample showing anomalies suggestive of localised enrichment. Comparable mixed-provenance and selective-sorting signals are reported from Paks, Hungary (Bradák et al., Reference Bradák, Újvári, Seto, Hyodo and Végh2018) and from geochemical studies in Poland and Hungary (Bradák-Hayashi et al., Reference Bradák-Hayashi, Biró, Horváth, Végh and Csillag2016; Skurzyński et al., Reference Skurzyński, Jary, Kenis, Kubik, Moska, Raczyk and Seul2020; Kenis et al., Reference Kenis, Skurzyński, Arabasz and Jary2025), and are consistent with EEP evidence for the joint role of large-river sediment routing and multiple local inputs (Költringer et al., Reference Költringer, Stevens, Lindner, Baykal, Ghafarpour, Khormali, Taratunina and Kurbanov2022; Kalinin et al., Reference Kalinin, Kudrevatykh, Panin, Mitenko, Malyshev and Alekseev2025).
L1LL1 contains more fine silt and clay, with stronger grain size–colour correlations and stable magnetic properties, indicating uniform long-distance transport and limited postdepositional alteration. Its geochemistry is more uniform than that of L2, reflecting sustained input from well-mixed regional dust plumes during the Late Pleistocene. This L1–L2 contrast, with L1LL1 more consistent and L2 more heterogeneous, parallels patterns in East-Central Europe (Zeeden et al., Reference Zeeden, Hilgen, Röhl, Seelos and Lourens2015; Lehmkuhl et al., Reference Lehmkuhl, Bösken, Hošek, Sprafke, Marković, Obreht and Hambach2018). In Poland, mineralogical studies are limited to L1, where Kenis et al. (Reference Kenis, Skurzyński, Arabasz and Jary2025) documented a similarly uniform signal consistent with sustained input from well-mixed regional dust plumes. However, detrital zircon U-Pb and Hf isotope studies from the Danube region show that, despite such contrasts, the main dust sources remained regionally stable through the Late Pleistocene (Fenn et al., Reference Fenn, Millar, Durcan, Thomas, Banak, Marković, Veres and Stevens2022, Reference Fenn, Millar, Bird, Veres and Wagner2025), while datasets from the EEP indicate strong spatial, but in places limited temporal, source variability and a dominant large-river control (Költringer et al., Reference Költringer, Stevens, Lindner, Baykal, Ghafarpour, Khormali, Taratunina and Kurbanov2022), implying that observed differences at VALPS likely reflect changes in sediment pathways, mixing proportions, or local sediment availability rather than a fundamental source shift.
Pedogenic units—particularly S1+L1SS1 and S0—provide further context by separating original source signals from weathering overprints. UCC- and PML-normalised spider diagrams (Supplementary Material 8) reveal enrichment of immobile elements (Zr, Hf, Th) and depletion of mobile components (Ca, Sr), consistent with advanced interglacial weathering and postdepositional redistribution (Buggle et al., Reference Buggle, Glaser, Hambach, Gerasimenko and Marković2011; Skurzyński et al., Reference Skurzyński, Jary, Fenn, Lehmkuhl, Raczyk, Stevens and Wieczorek2024; Kenis et al., Reference Kenis, Skurzyński, Arabasz and Jary2025).
Taken together, these integrated proxies indicate that L2 (especially L2LL2) preserves a stronger imprint of locally sourced and recycled sediment, overprinted by selective aeolian sorting and episodic input from regional plumes, whereas L1LL1 reflects a more uniform, well-mixed regional signal. The relative enrichment in HREEs combined with Zr-Hf patterns may indicate contributions from Scandinavian sources and the EEP along the Saalian ice-margin corridor, consistent with EEP-scale detrital zircon evidence and regional models (Buggle et al., Reference Buggle, Glaser, Zoeller, Hambach, Marković, Glaser and Gerasimenko2008; Költringer et al., Reference Költringer, Stevens, Lindner, Baykal, Ghafarpour, Khormali, Taratunina and Kurbanov2022; Skurzyński et al., Reference Skurzyński, Jary, Fenn, Lehmkuhl, Raczyk, Stevens and Wieczorek2024; Kenis et al., Reference Kenis, Skurzyński, Arabasz and Jary2025), although mineralogical confirmation at VALPS is lacking.
Regional and local pedogenic processes and their record in the VALPS
Interglacial soils at VALPS—the S0 chernozem and the Pleistocene palaeosols (S1+L1SS1, S2)—share a coherent multiproxy signature distinguishing them from the enclosing loess. They are darker/redder (lower L*, higher a*, elevated RI, slightly reduced b*/a*), reflecting humification and iron oxide pigmentation under warm, moist conditions (Lukić et al., Reference Lukić, Basarin, Buggle, Marković, Tomović, Popov Raljić, Hrnjak, Timar-Gabor, Hambach and Gavrilov2014; Sprafke et al., Reference Sprafke, Terhorst, Peticzka and Thiel2013, Reference Sprafke, Schulte, Meyer-Heintze, Händel, Einwögerer, Simon, Peticzka, Schäfer, Lehmkuhl and Terhorst2020; Wu et al., Reference Wu, Qiu, Fu, Rao and Zhu2018), and display pronounced clay-fine silt enrichment consistent with aggregation and illuviation (Vandenberghe, Reference Vandenberghe2013; Zeeden et al., Reference Zeeden, Hilgen, Röhl, Seelos and Lourens2015; Újvári et al., Reference Újvári, Kok, Varga and Kovács2016; Lehmkuhl et al., Reference Lehmkuhl, Bösken, Hošek, Sprafke, Marković, Obreht and Hambach2018; Van Hateren et al., Reference Van Hateren, Kasse, van der Woude, Schokker, Prins and van Balen2022). Geochemically, S1+L1SS1 and S2 show high CIA and retention of immobile elements (Zr-Hf, Th, Sc, REEs), with elevated Th/U in S1+L1SS1 separating interglacial from interstadial soils (Buggle et al., Reference Buggle, Glaser, Hambach, Gerasimenko and Marković2011; Skurzyński et al., Reference Skurzyński, Jary, Kenis, Kubik, Moska, Raczyk and Seul2020; Kenis et al., Reference Kenis, Skurzyński, Arabasz and Jary2025). In contrast, S0 carries the lowest weathering indices among soils (CIA ≤ ∼60), yet remains silica rich and retains resistant phases, while its grain size closely matches the upper L1LL1 loess—evidence for strong lithological inheritance despite organic overprint (Buggle et al., Reference Buggle, Glaser, Hambach, Gerasimenko and Marković2011; Sprafke et al., Reference Sprafke, Schulte, Meyer-Heintze, Händel, Einwögerer, Simon, Peticzka, Schäfer, Lehmkuhl and Terhorst2020; Gerasimenko and Rousseau, Reference Gerasimenko and Rousseau2008; Gozhik et al., Reference Gozhik, Komar, Łanczont, Fedorowicz, Bogucki, Mroczek, Prylypko and Kusiak2014). Magnetically, interglacial soils exhibit reduced K and foliation–dominated AMS fabrics, indicating alteration of lithogenic magnetite and long-term surface stability (Evans and Heller, Reference Evans and Heller2001; Terhorst et al., Reference Terhorst, Appel and Werner2001; Bradák-Hayashi et al., Reference Bradák-Hayashi, Biró, Horváth, Végh and Csillag2016; Maher, Reference Maher2016; Bradák et al., Reference Bradák, Seto, Stevens, Újvári, Fehér and Költringer2021). Palynology is congruent: S1 combines mixed deciduous taxa with open-habitat elements, while S2 is bipartite—closed, humid forests below and forest–steppe above (Gerasimenko and Rousseau, Reference Gerasimenko and Rousseau2008; Komar et al., Reference Komar, Łanczont and Madeyska2009, Reference Krokhmal’ and Komar2018; Gozhik et al., Reference Gozhik, Komar, Łanczont, Fedorowicz, Bogucki, Mroczek, Prylypko and Kusiak2014; Popova et al., Reference Popova, Veklych, Kovalchuk, Mishta, Stachowicz-Rybka, Gorobets and Yanenko2025b). Regionally, Holocene chernozems are often decapitated or eroded and thus relatively thin, whereas at VALPS S0 is thick and well preserved—consistent with local hydrology and site stability—and the overall interglacial signal matches observations locally in the Dnieper valley and its tributaries and more broadly across western Ukraine (Gerasimenko and Rousseau, Reference Gerasimenko and Rousseau2008; Gozhik et al., Reference Gozhik, Komar, Łanczont, Fedorowicz, Bogucki, Mroczek, Prylypko and Kusiak2014; Fedorowicz et al., Reference Fedorowicz, Łanczont, Bogucki, Kusiak, Mroczek, Adamiec, Bluszcz, Moska and Tracz2013; Veres et al., Reference Veres, Tecsa, Gerasimenko, Zeeden, Hambach and Timar-Gabor2018; Nawrocki et al., Reference Nawrocki, Bogucki, Gozhik, Łanczont, Pańczyk, Standzikowski, Komar, Rosowieca and Tomeniuk2019; Bonchkovskyi, Reference Bonchkovskyi2025; Bonchkovskyi and Hlavatskyi, Reference Bonchkovskyi and Hlavatskyi2025).
Against this interglacial template, the L2SS1 interstadial soil is weakly developed: colour and grain-size metrics differ little from the adjacent loess, the GSI and U-ratio show no sustained decline, and volume magnetic susceptibility (K) is lower than in L2 loess without clear pedogenic enhancement. These features indicate limited pedogenesis under cooler and/or drier conditions, with local hydrology redistributing pigments and carbonates, and redox-sensitive signals—sporadic Fe-Mn accumulations and a decoupling of colour from magnetics—pointing to episodic waterlogging and shallow ground water (Terhorst et al., Reference Terhorst, Appel and Werner2001; Antoine et al., Reference Antoine, Rousseau, Moine, Kunesch, Hatté, Lang, Tissoux and Zöller2009, Reference Antoine, Lagroix, Jordanova, Jordanova, Lomax, Fuchs and Debret2019; Baumgart et al., Reference Baumgart, Hambach, Meszner and Faust2013; Szymański and Skiba, Reference Szymański and Skiba2013; Wang et al., Reference Wang, Song, Zhao and Li2016). Comparable weakly developed, hydromorphically overprinted interstadials with muted magnetic enhancement are reported from the Middle Dnieper and the Volhyn Upland, where waterlogging can suppress magnetic-susceptibility enhancement (reported here as K), with regionally consistent patterns also documented in Ukrainian LPSs (Nawrocki et al., Reference Nawrocki, Bogucki, Gozhik, Łanczont, Pańczyk, Standzikowski, Komar, Rosowieca and Tomeniuk2019; Bonchkovskyi and Hlavatskyi, Reference Bonchkovskyi and Hlavatskyi2025).
Loess units form the detrital baseline for recognising pedogenic overprints. They are spectrally lighter, pollen-poor, and—in the S2-L2 interval measured magnetically—show K peaks in L2 loess and drops in intervening palaeosols, indicating dominantly lithogenic ferrimagnets with limited pedogenic enhancement (Baumgart et al., Reference Baumgart, Hambach, Meszner and Faust2013; Bradák-Hayashi et al., Reference Bradák-Hayashi, Biró, Horváth, Végh and Csillag2016; Bradák et al., Reference Bradák, Seto, Stevens, Újvári, Fehér and Költringer2021; Nawrocki et al., Reference Nawrocki, Łanczont, Rosowiecka and Bogucki2016, Reference Nawrocki, Bogucki, Gozhik, Łanczont, Pańczyk, Standzikowski, Komar, Rosowieca and Tomeniuk2019; Bonchkovskyi and Hlavatskyi, Reference Bonchkovskyi and Hlavatskyi2025). Within L2, L2LL2 exhibits the greatest scatter in texture, K, and AMS Kmin, reflecting efficient sorting and episodic local recycling under MIS 6 periglacial regimes, whereas L2LL1 is more uniform and chemically homogeneous (Šimíček et al., Reference Šimíček, Bábek, Hron, Pavlů and Kapusta2021; Kenis et al., Reference Kenis, Skurzyński, Arabasz and Jary2025). Geochemically, L2LL2 bears a heavy mineral–enriched, carbonate-influenced signature of short-range sandur-fed inputs along the Middle Dnieper (local-valley scale), while the more homogeneous, silica-richer L2LL1 (and L1LL1) reflects well-mixed distal dust plumes typical of the EEP, with comparable detrital patterns in Central European loess (regional scale) (Gozhik et al., Reference Gozhik, Komar, Łanczont, Fedorowicz, Bogucki, Mroczek, Prylypko and Kusiak2014; Költringer et al., Reference Költringer, Stevens, Lindner, Baykal, Ghafarpour, Khormali, Taratunina and Kurbanov2022; Kalinin et al., Reference Kalinin, Kudrevatykh, Panin, Mitenko, Malyshev and Alekseev2025).
Diagenetic processes and their impact on the palaeoenvironmental record
Following the main phases of pedogenesis, the deposits at VALPS underwent diagenetic processes that overprinted the primary aeolian signal and modified chemical, mineralogical, and magnetic properties. The most pervasive processes—decalcification and carbonate redistribution, iron-oxide accumulation, and associated changes in magnetic susceptibility—reflect regionally forced climatic shifts modulated by local relief and hydrology (Buggle et al., Reference Buggle, Glaser, Hambach, Gerasimenko and Marković2011; Wang et al., Reference Wang, Song, Zhao and Li2016). Interglacial leaching followed by CaCO₃ and MgCO₃ reprecipitation in Ck horizons of S1 and S2 indicates intense percolation under fluctuating moisture regimes. Cross-proxy correlations in L2 are weak or inconsistent compared with the more coherent L1LL1 signal (Fig. 6B), and the difference matrix (Fig. 6C) points to disruption of primary sedimentary relationships by redox-driven Fe migration, clay alteration, and carbonate redistribution (Sprafke et al., Reference Sprafke, Schulte, Meyer-Heintze, Händel, Einwögerer, Simon, Peticzka, Schäfer, Lehmkuhl and Terhorst2020; Skurzyński et al., Reference Skurzyński, Jary, Fenn, Lehmkuhl, Raczyk, Stevens and Wieczorek2024). Spectrophotometric and geochemical markers track these transformations: rises in RI with lower L* and a* covary with higher Fe₂O₃, consistent with secondary haematite/goethite formation during repeated redox cycling under transitional moisture conditions; similar multiphase Fe mobility and redeposition are reported from Central European LPSs (Buggle et al., Reference Buggle, Glaser, Hambach, Gerasimenko and Marković2011; Lukić et al., Reference Lukić, Basarin, Buggle, Marković, Tomović, Popov Raljić, Hrnjak, Timar-Gabor, Hambach and Gavrilov2014; Wang et al., Reference Wang, Song, Zhao and Li2016; Sprafke et al., Reference Sprafke, Schulte, Meyer-Heintze, Händel, Einwögerer, Simon, Peticzka, Schäfer, Lehmkuhl and Terhorst2020; Kenis et al., Reference Kenis, Skurzyński, Arabasz and Jary2025).
Magnetic properties also record this secondary overprint. In the S2–L2 interval, reduced K in S2 indicates transformation of lithogenic magnetite into weakly magnetic Fe oxides under fluctuating redox conditions (Maher, Reference Maher2016; Bradák et al., Reference Bradák, Seto, Stevens, Újvári, Fehér and Költringer2021; Zeeden and Hambach, Reference Zeeden and Hambach2022), whereas higher and more stable K in L2LL1 suggests limited chemical alteration and restricted pedogenesis (Bradák-Hayashi et al., Reference Bradák-Hayashi, Biró, Horváth, Végh and Csillag2016; Nawrocki et al., Reference Nawrocki, Bogucki, Gozhik, Łanczont, Pańczyk, Standzikowski, Komar, Rosowieca and Tomeniuk2019). AMS fabrics provide a complementary textural control: S2 exhibits foliation-dominated, stable fabrics consistent with long-term soil formation (Terhorst et al., Reference Terhorst, Appel and Werner2001; Bradák-Hayashi et al., Reference Bradák-Hayashi, Biró, Horváth, Végh and Csillag2016; Bradák et al., Reference Bradák, Seto, Stevens, Újvári, Fehér and Költringer2021), while greater Kmin dispersion in L2LL1 and L2SS1 points to episodic hydrological disturbance and redox variability—that is, local modulation of diagenetic processes superimposed on regionally driven change (Bradák et al., Reference Bradák, Újvári, Seto, Hyodo and Végh2018; Nawrocki et al., Reference Nawrocki, Bogucki, Gozhik, Łanczont, Pańczyk, Standzikowski, Komar, Rosowieca and Tomeniuk2019; Zeeden and Hambach, Reference Zeeden and Hambach2022).
Landscape evolution and climatic variability in the loess–palaeosol record
From MIS 8 onward, the VALPS captures a periglacial landscape evolving from ice-margin stagnation (glacial till and limnoglacial units) into an aeolian-soil system. During ice retreat, small mammals and molluscs indicate a patchwork of steppe, shrubland, wetlands, and shallow ponds under moderately cold, seasonally wet conditions (Gerasimenko and Rousseau, Reference Gerasimenko and Rousseau2008; Krokhmal’ and Komar, Reference Krokhmal’ and Komar2018; Krokhmal’ et al., Reference Krokhmal’, Rekovets and Kovalchuk2021, Reference Krokhmal’, Rekovets and Kovalchuk2023; Popova et al., Reference Popova, Veklych, Kovalchuk, Mishta, Stachowicz-Rybka, Gorobets and Yanenko2025b). Palynology from L3 (MIS 8) shows cold steppe with tundra elements: MAT −3.3°C to 7.3°C, CMM to −22.2°C, MAP 268–492 mm; dwarf birch and mosses persisted while scattered spruce appeared locally. Succeeding MIS 7 (S2) marks a shift to interglacial stability: mixed conifer–broadleaf forests (Pinus–Betula–Alnus) concentrated in valley floors, with forest-steppe on higher ground; reconstructed MAT rises to 5.4–11°C and MAP to ∼502 mm, favouring slope stabilisation, colluviation damping, and sustained pedogenesis (Fig. 7).
Palaeoenvironmental reconstruction from Velyka Andrusivka loess–palaeosol sequence (VALPS) palynological data (after Komar et al., Reference Komar, Krokhmal, Melnik and Prylypko2005), showing pollen percentages, local pollen assemblage zones (LPAZ), biome affinity scores, dominant biome types, and reconstructed climatic parameters (CMM, coldest month mean; WMM, warmest month mean; MAT, mean annual temperature; MAP, mean annual precipitation).

Overlying L2 (MIS 6) records a windy, highly seasonal periglacial plain. Pollen-derived MAT spans ∼1–13.8°C with CMM minima near −15.6°C, implying vigorous winter winds, thin plant cover, and curtailed soil formation. Grain-size indices (high GSI, U-ratio oscillations) and coarser pulses in upper L2 point to frequent gustiness and short-distance transport superposed on long-range dust. Geochemically, enrichment in resistant heavy-mineral fractions and REE in L2LL2 fits aeolian sorting with near-surface reworking/oxidation; variable Kmin fabrics and magnetic susceptibility indicate alternating primary fallout and local recycling on a frost-affected surface. In process terms, the MIS 6 landscape toggled between deflationary flats, snow patch–fed sheetwash, and shallow gully channelling; thaw seasons likely promoted brief slopewash and minor redeposition into leeward traps (expressed differently in VA-I vs. VA-II by position within the local toposequence). Comparable periglacial dynamics and the placement of L2 between Kaydaky (MIS 7) and Pryluky/Horohiv (MIS 5) match Middle Dnieper reference profiles (e.g., Maksymivka LPS), where pedo-lithostratigraphic architecture and luminescence chronologies bracket the same glacial–interglacial transitions.
MIS 5e (S1) records forest expansion and landscape stabilisation: MAT 5.4–11°C, WMM to 21.6°C, MAP ∼502 mm. Enhanced pedogenesis (highest CIA; clay-linked trace-element accrual) and spectrophotometry (higher a*, RI; lower L*) indicate reduced dust influx and sustained moisture, while increased clay/fine silt reflects secondary clay formation; temperate deciduous forests (with Tilia, Carpinus) occupied moister positions, and meadow-steppe persisted on interfluves (Bruch et al., Reference Bruch, Kern, Stebich, Weitzel and Bolus2025). Subsequent MIS 4 (L1LL2) reopens the landscape to arid continental conditions (MAT 1–10.8°C; MAP ≤ 318 mm), with seasonal permafrost and sparse cover. MIS 2 (L1LL1) returns to persistently cold, dry plains: high GSI and U-ratio denote long-distance dust, spectrophotometry shows minimal pedogenic overprint, and low CIA (≤ 60) plus Zr-Hf peaks point to heavy mineral–rich inputs and efficient aeolian sorting (Skurzyński et al., Reference Skurzyński, Jary, Fenn, Lehmkuhl, Raczyk, Stevens and Wieczorek2024). The terminal loess is capped by the S0 chernozem (Late Glacial-Holocene): strong pigmentation (high RI) and decalcification (low Ca-Mg; secondary carbonate in Ck) align with steppe/forest-steppe vegetation, while grain-size inheritance from upper L1LL1 preserves the aeolian parentage.
Implications of the results for regional and global correlation
The multiproxy dataset from the VALPS profile allows its integration into the stratigraphic framework of East-Central Europe across local, regional, and supraregional scales (Fig. 8). At the local scale, the succession closely matches sequences from Nahirne and Maksymivka (Fig. 1B). The Nahirne section (Komar et al., Reference Komar, Łanczont, Fedorowicz, Gozhik, Mroczek and Bogucki2018) exhibits a comparable litho-pedostratigraphy with S1 and S2 palaeosols, supported by micromorphological evidence. Maksymivka, located in a neighbouring geomorphological zone of the Dnieper Lowland, records the Kaydaky palaeosol and other MIS 5 and MIS 3 horizons (Gozhik et al., Reference Gozhik, Komar, Łanczont, Fedorowicz, Bogucki, Mroczek, Prylypko and Kusiak2014). Similar soil assemblages and consistent geochemical signatures enable direct correlation of pedogenic units, while highlighting local differences in soil-forming intensity.
Correlation of key loess–palaeosol sequences (LPSs) along the 50°N latitudinal transect, shown in relation to major geomorphological units, glacial zones, palaeomagnetic events, and Palaeolithic cultural layers (Gozhik et al., Reference Gozhik, Matviishina, Gerasimenko, Rekovets and Shelkopyas2001b, Reference Gozhik, Komar, Łanczont, Fedorowicz, Bogucki, Mroczek, Prylypko and Kusiak2014; Łanczont and Bogucki, Reference Łanczont, Bogucki and Madeyska2002; Komar et al., Reference Komar, Krokhmal, Melnik and Prylypko2005, Reference Komar, Łanczont, Fedorowicz, Gozhik, Mroczek and Bogucki2018; Łanczont et al., Reference Łanczont, Madeyska, Komar and Bogucki2014b, Reference Łanczont, Madeyska, Sytnyk, Bogucki, Komar, Nawrocki, Hołub and Mroczek2015a, Reference Łanczont, Madeyska, Bogucki, Mroczek, Hołub, Łącka, Fedorowicz, Frankowski, Standzikowski, Łanczont and Madeyska2015b, Reference Łanczont, Bogucki, Yatsyshyn, Terpiłowski, Mroczek, Orłowska and Hołub2019, Reference Łanczont, Mroczek, Komar, Nawrocki, Standzikowski, Krokhmal, Prylypko, Bujak and Szymanek2023; Mroczek et al., Reference Mroczek, Łanczont, Bogucki, Hołub, Standzikowski, Tomeniuk, Yatsyshyn, Sobczyk, Ratajczak-Skrzatek, Kasprzak, Kotowski, Marciszak and Stefaniak2020). Profiles are scaled according to thickness and correlated with Marine Isotope Stages (MIS) (Cohen and Gibbard, Reference Cohen and Gibbard2012, Reference Cohen and Gibbard2019), as well as regional schemes for central and western Ukraine (Gozhyk, Reference Gozhyk2012; Bogucki and Łanczont, Reference Bogucki, Łanczont and Madeyska2002, Reference Bogucki and Łanczont2019). The location of the sections is shown in Figure 1B.

At the regional scale, VALPS shows strong affinities with the Vyazivok and Stayky sequences (Fig. 1B). Vyazivok contains some of Ukraine’s most-developed palaeosol complexes and underpins magnetostratigraphic frameworks (Gozhik et al., Reference Gozhik, Matviishina, Gerasimenko, Rekovets and Shelkopyas2001b; Rousseau et al., Reference Rousseau, Gerasimenko, Matviishina and Kukla2001; Hlavatskyi and Bakhmutov, Reference Hlavatskyi and Bakhmutov2020). Stayky, on the Kyiv Upland margin, preserves a complete succession with well-defined palaeopedogenic horizons and palaeomagnetic markers (Veres et al., Reference Veres, Tecsa, Gerasimenko, Zeeden, Hambach and Timar-Gabor2018). Comparable stratigraphic architecture and geochemical indicators (REE, CIA, Th/U) reflect regionally recurrent patterns of deposition and pedogenesis through successive MIS cycles.
At the supraregional scale, VALPS can be linked with key sequences from SE Poland (Orzechowce, Tyszowce, Złota), Hungary (Paks, Tokaj), western Europe (Nussloch, Dolní Věstonice), and SE Europe (Harletz) (Antoine et al., Reference Antoine, Rousseau, Moine, Kunesch, Hatté, Lang, Tissoux and Zöller2009, Reference Antoine, Moine, Rousseau, Lagroix, Kreutzer, Fuchs, Debret and Svoboda2016, Reference Antoine, Lagroix, Jordanova, Jordanova, Lomax, Fuchs and Debret2019; Kovács et al., Reference Kovács, Fábián, Varga, Újvári, Varga and Dezső2011; Bradák-Hayashi et al., Reference Bradák-Hayashi, Biró, Horváth, Végh and Csillag2016; Łanczont et al., Reference Łanczont, Madeyska, Bogucki, Mroczek, Hołub, Łącka, Fedorowicz, Frankowski, Standzikowski, Łanczont and Madeyska2015b; Skurzyński et al., Reference Skurzyński, Jary, Kenis, Kubik, Moska, Raczyk and Seul2020). Comparative analysis of stratigraphy, geochemistry (e.g., HREE patterns), and pedogenic indicators (CIA, RI, AMS) relative to these reference sequences positions VALPS as a critical link between extraglacial, periglacial, and glacial domains, providing evidence for dust transport pathways, depositional conditions, and soil development along the Saalian ice margin (Buggle et al., Reference Buggle, Glaser, Zoeller, Hambach, Marković, Glaser and Gerasimenko2008; Lehmkuhl et al., Reference Lehmkuhl, Nett, Pötter, Schulte, Sprafke, Jary and Antoine2021). In this broader EEP context, detrital zircon U-Pb data show that large river systems such as the Dnieper and Volga acted as major sediment distributors to periglacial loess areas, with strong spatial but often limited temporal variability in source contributions (Költringer et al., Reference Költringer, Stevens, Lindner, Baykal, Ghafarpour, Khormali, Taratunina and Kurbanov2022).
Similar implications emerge from the Dubrivka profile and other sites in the Ukrainian Carpathian foreland, which record Elsterian ice extent and subsequent Pleistocene environmental change (Łanczont et al., Reference Łanczont, Bogucki, Yatsyshyn, Terpiłowski, Mroczek, Orłowska and Hołub2019). Because the VALPS record aligns with regional proxy trends, yet also preserves divergences from idealised global MIS patterns, it can be incorporated into continental-scale databases for Pleistocene palaeoclimate and palaeoenvironmental modelling (Antoine et al., Reference Antoine, Rousseau, Degeai, Moine, Lagroix, Kreutzer, Fuchs, Hatté, Gauthier, Svoboda and Lisá2013, Reference Antoine, Lagroix, Jordanova, Jordanova, Lomax, Fuchs and Debret2019; Marković et al., Reference Marković, Stevens, Kukla, Hambach, Fitzsimmons, Gibbard and Buggle2015). In this context, robust stratigraphic markers—including palaeosols, tephras, palaeomagnetic events, and glacial tills—are essential for correlating sequences at multiple scales (Horváth, Reference Horváth2001; Sauer et al., Reference Sauer, Kadereit, Kühn, Kösel, Miller, Shinonaga and Kreutzer2016; Dzierżek and Lindner, Reference Dzierżek and Lindner2024). The latitudinal transect at 50°N (Fig. 8) illustrates spatial variation in loess–palaeosol development between SE Poland and central Ukraine, including differences in soil thickness, intensity, hiatus frequency, cryogenic deformation, and associated archaeological layers. These comparisons strengthen the role of VALPS as a reference profile for testing regional stratigraphic schemes and refining correlations of palaeosol complexes such as the Kaydaky and Pryluky soils (Mroczek et al., Reference Mroczek, Krokhmal’, Komar and Łanczont2025; Popova et al., Reference Popova, Veklych, Kovalchuk, Mishta, Stachowicz-Rybka, Gorobets and Yanenko2025b). Its combination of well-defined glacial and pedogenic markers, independent chronology, and multi-index proxy data makes it a valuable benchmark for integrated stratigraphic studies in the periglacial zone.
Conclusions
The VALPS provides rare sedimentological, geochemical, and chronological evidence from the penultimate glacial cycle (L2) in eastern Europe, which remains sparsely documented. Within L1, only its youngest subunit (L1LL1) is preserved; older parts—although reported elsewhere—were removed or altered by stratigraphic hiatuses and multiphase pedogenesis. This reflects the combined action of local and regional factors in shaping the aeolian archive. Proxy relationships show that L1LL1 retains a coherent depositional signal, whereas L2 is more heterogeneous and overprinted by postdepositional processes. Although OSL ages older than MIS 5 may be underestimated, the stratigraphic and proxy consistency supports robust paleoenvironmental reconstructions. On this basis, we offer the series of conclusions outlined in the following paragraphs.
Local geomorphological and hydrological settings, interacting with regional climatic forcing, jointly control sedimentation and pedogenesis. The VALPS record shows that these interactions can amplify, attenuate or distort climatic signals, highlighting the need to consider both scales of influence in transitional glacial–periglacial settings.
Correlation of litho- and pedostratigraphic units along a 50°N transect from SE Poland to central Ukraine, using a consistent multiproxy–chronological framework, reveals both synchronous cyclic environmental changes and asynchronous, region-specific departures from idealised stratigraphy. Misinterpretations can be avoided only by comparing sites that share similar geographic and climatic settings, rather than correlating directly with distant, non-analog reference sections.
Lithological and geochemical variability in the loess units reflects shifts in dust transport intensity and provenance—from predominantly local to local–regional inputs in L2 (especially in L2LL2), to more homogenised, distal sources in L1LL1. Enrichment in Zr-Hf and REE, together with associated grain-size patterns, indicates that these changes were driven by climatic fluctuations and linked to the reorganisation of atmospheric circulation and source-area landscapes, underscoring the high sensitivity of the depositional system to environmental change.
Interglacial and interstadial soils at VALPS record multiphase development shaped by climatic variability and modulated by geomorphology, hydrology, and parent material properties. Although comparable to soils in other East European LPSs, their intensity and expression differ according to local environmental conditions, with clear evidence for overlapping or reactivated pedogenic processes.
Stratigraphic marker horizons—including glacial tills and regionally traceable palaeosols—together with coordinated shifts in grain size, geochemistry, and colour, provide robust reference points for reconstructing the evolutionary history of periglacial loess–palaeosol sequences. Their integration allows recognition of diachronic processes, identification of hiatuses, and more reliable correlation across sites.
The OSL chronology provides an independent temporal framework capable of verifying and refining regional loess–palaeosol stratigraphic models. It identifies hiatuses and diachronous boundaries relative to MIS divisions, with some deviations—particularly in AG-I, S2, and L2—plausibly reflecting a combination of genuine environmental or sedimentary dynamics and known methodological limitations of luminescence dating in complex, variably bleached sediments. When integrated with other proxies, these age constraints offer a robust test for both regional and supraregional correlations.
Integrated analysis of VALPS, combined with transect-scale comparisons from SE Poland to central Ukraine, shows that transitional glacial–periglacial zones can register climatic signals that diverge from both western and eastern stratigraphic patterns. Such sequences provide unique archives for detecting environmental gradients that are not captured by conventional models based solely on MIS correlation.
Results from VALPS, combined with comparative analysis of other LPSs in the Middle Dnieper region, highlight the need to reassess existing stratigraphic and palaeontological interpretations. Applying a consistent multiproxy–chronological framework reveals that some discrepancies between local records stem from inconsistent correlation schemes or overinterpretation of limited datasets, emphasising the importance of verifying regional models against well-documented reference sections.
In summary, the VALPS record aligns with regional loess–palaeosol stratigraphy in the Middle Dnieper area, with deviations attributable to site-specific postdepositional processes and known limitations of luminescence dating in complex sediments. Its high resolution, correlation potential, and position along the Saalian ice-margin corridor make it a robust reference section for refining stratigraphic frameworks across the East European loess province.
Supplementary material
The supplementary material for this article can be found at https://doi.org/10.1017/qua.2025.10065.
Acknowledgments
This research was conducted as part of the grant from the National Science Centre, Poland (project no. 2018/31/B/ST10/01507), entitled “Global, Regional and Local Factors Determining the Palaeoclimatic and Palaeoenvironmental Record in the Ukrainian Loess–Soil Sequences along the Dnieper River Valley—from the Proximal Areas to the Distal Periglacial Zone.” Malacological analyses were performed by the late Valentyn Prysyazhniuk, whose contribution is gratefully acknowledged. We also wish to thank Igor Chernikov for his logistical support and supervision during fieldwork. We are grateful to Nicholas Lancaster and Peter Fischer, editors of Quaternary Research, as well as to two anonymous reviewers for their constructive comments and suggestions, which greatly improved the article. AI tools (ChatGPT, OpenAI) were used for language editing. All content was verified by the authors.
Competing Interests
The authors declare no competing interests.