I. INTRODUCTION
Li[Ni1/3Co1/3Mn1/3]O2 (L333) was introduced by Ohzuku and Makimura in 2001 as an alternative layered cathode material by mixing three metal precursors by a solid state method. Reference Ohzuku and Makimura1 Since then, Li[Ni1/3Co1/3Mn1/3]O2 has drawn much attention as it exhibits much higher capacity close to 200 mA h/g with enhanced safety. Reference Choi and Manthiram2–Reference Yabuuchi, Makimura and Ohzuku4 Thus, it proves to be a promising cathode candidate in battery applications. Electronic structural studies have shown that L333 consists of Ni2+, Co3+, and Mn4+ species. Therefore, the reversible capacity involves the oxidation of Ni2+ to Ni4+ in the initial stage while Co3+ oxidizes to Co4+ in the later stages. Reference Lu, MacNeil and Dahn5,Reference Hwang, Tsai, Carlier and Ceder6 Thus, its higher capacity is related to the improved chemical stability from the Ni2+/3+ and the Ni3+/4+ redox couples relative to that of the Co3+/4+ redox couple. Despite these advantages, Li[Ni1/3Co1/3Mn1/3]O2 displays a fading effect of discharge capacities under high rate current densities. Reference Belharouak, Sun, Liu and Amine7 The addition of dopants, Reference Ren, Mu, Huang, Li, Wang, Cai, Peng and Zhou8,Reference Kim, Shim, Han, Kim, Ahn, Jeon, Hur, Kim and Park9 the optimization of Li[Ni1/3Co1/3Mn1/3]O2 morphology, Reference Yang, Wang, Liu, Chen, Yang and Wei10,Reference Lin, Wen, Gu and Huang11 and coatings have been studied to improve its performance during cycling at high rates. Reference Yun, Park and Park12–Reference Huang, Chen, Cheng, Wan, Liu, Zhou and Zhang14
The performance of Li[Ni1/3Co1/3Mn1/3]O2 is directly related to its crystal size, particle morphology, surface area, and cation mixing, which is dependent on the synthesis method. Reference Wu, Wang, Su, Bao and Chen15,Reference Yabuuchi and Ohzuku16 These methods have included coprecipitation, Reference Lee, Kang, Myung and Sun17 sol–gel, Reference Ding, Zhang, Jiang and Gao18 solid-state, Reference Guo, Jiao, Yuan, Wang, Li, Zhang and Wang19 hydrothermal, Reference Xie, Huang, Zhu and Dai20 microemulsion, Reference Venkateswara Rao, Leela Mohana Reddy, Ishikawa and Ajayan21 and pyrolysis processes. Reference Guo, Shi, Cheng and Du22 Much of the focus has been on improving performance by introducing novel synthesis methods, such as Wu et al., who synthesized nanoporous L333 by using vapor grown carbon fibers as templates, Reference Wang, Xiao, Chang, Yang and Wu23 by applying ZrFx, carbon, or Al2O3 coatings, Reference Yun, Park and Park12–Reference Huang, Chen, Cheng, Wan, Liu, Zhou and Zhang14 and by adding dopants of Sn or Al. Reference Ren, Mu, Huang, Li, Wang, Cai, Peng and Zhou8,Reference Kim, Shim, Han, Kim, Ahn, Jeon, Hur, Kim and Park9 At the same time, it is critical to investigate the performance degradation mechanism along with all of these efforts. Manthiram and Choi Reference Choi and Manthiram24 discussed the irreversible capacity loss after the first cycle in layered LiNi1/3Co1/3Mn1/3O2 cathodes at various annealing temperatures. Recently, Ghosh and Kabi Reference Kabi and Ghosh25 reported the relationship between the crystal structure of L333 and calcination conditions using oxalate precursors. However, there is very limited information about the longer term performance and degradation of Li[Ni1/3Co1/3Mn1/3]O2 cathodes. Based on our initial findings of the crystal growth mechanisms of L333, Reference Zhu, Vo, Li, Lu, Kinsinger, Xiong, Yan and Kisailus26 we perform a thorough investigation of the structure–performance relationships, which is of fundamental importance not only for its intrinsic scientific interest but also for its technological significance. Reference Atkinson27,Reference Weaire and Rivier28 The information revealed by this study will help to develop design strategies for cathodes that will enable high efficiency lithium-ion transport and extended lifetime batteries.
II. METHODS
A. Preparation of materials
L333 powders were prepared using a two-step coprecipitation method. Stoichiometric amounts of nickel, cobalt, and manganese nitrates (99.5% purity, Aldrich Chemical Co.) were thoroughly dissolved in deionized water to achieve a homogeneously mixed 100 mM solution, followed by adding a small quantity of 2 M NaOH to adjust the solution pH to 10, thus, inducing precipitation. The resultant suspension was subsequently stirred at 600 rpm under a nitrogen atmosphere at room temperature for 1 h. The (Ni1/3Co1/3Mn1/3)(OH)2 precipitate (i.e., precursor) was washed with DI water 3 times followed by a wash with pure ethanol, then dried under vacuum at 70 °C for 12 h. The precursor was then mixed with a 5 wt% excess of LiOH·H2O and subsequently ground with a mortar and pestle. The mixture was placed in an alumina boat and annealed in a tube furnace at different temperatures (i.e., 750–1000 °C) for 3 h in air.
B. Material characterization
Phase identification was determined by x-ray diffraction analysis (XRD, PANalytical Empyrean, Almelo, The Netherlands) using Ni-filtered Cu Kα radiation at 45 kV and 40 mA from 10–70° (2θ). Using the resulting XRD diffraction patterns, crystallite diameters were calculated based on the Scherrer formula. Particle sizes and morphologies were observed using a scanning electron microscope (SEM, FEI XL30, Eindhoven, The Netherlands) at an accelerating voltage of 10 kV. The surface area of each sample was determined via BET nitrogen adsorption at 77 K using a Micromeritics Tristar 3000.
C. Electrochemical performance
To test the electrochemical performance, coin cells were fabricated. As-synthesized Li[Ni1/3Co1/3Mn1/3]O2 powder, conductive carbon black (Super P), and polyvinylidene fluoride (PVDF) (70:20:10 in wt%) were mixed in N-methylpyrrolidone (NMP) to produce a slurry. This viscous slurry was subsequently coated on an aluminum foil current collector and dried in a vacuum oven at 100 °C for 12 h. A R2032 type of coin cell was assembled in an argon-filled glove box, consisting of the prepared positive electrode, lithium metal foil as the counter electrode, a Celgard polymer film as a separator, and 1.0 M LiPF6 in ethylene carbonate (EC)–diethyl carbonate (DEC) (50:50 in vol%) as the electrolyte solution. The loading of the active material was 2 mg/cm2. The cyclic performance and rate capability of batteries were tested using an Arbin battery test system (Arbin Instruments, Model BT2043) in the voltage range of 2.8–4.5 V at 25 °C. Cyclic voltammograms (CVs) of Li[Ni1/3Co1/3Mn1/3]O2 were recorded on a VMP3 multichannel electrochemical station (Bio-logic, Claix, France) in the voltage range of 2.8–4.5 V at a scan rate of 0.1 mV/s.
III. RESULTS AND DISCUSSION
A. Characterization of synthesized Li[Ni1/3Co1/3Mn1/3]O2
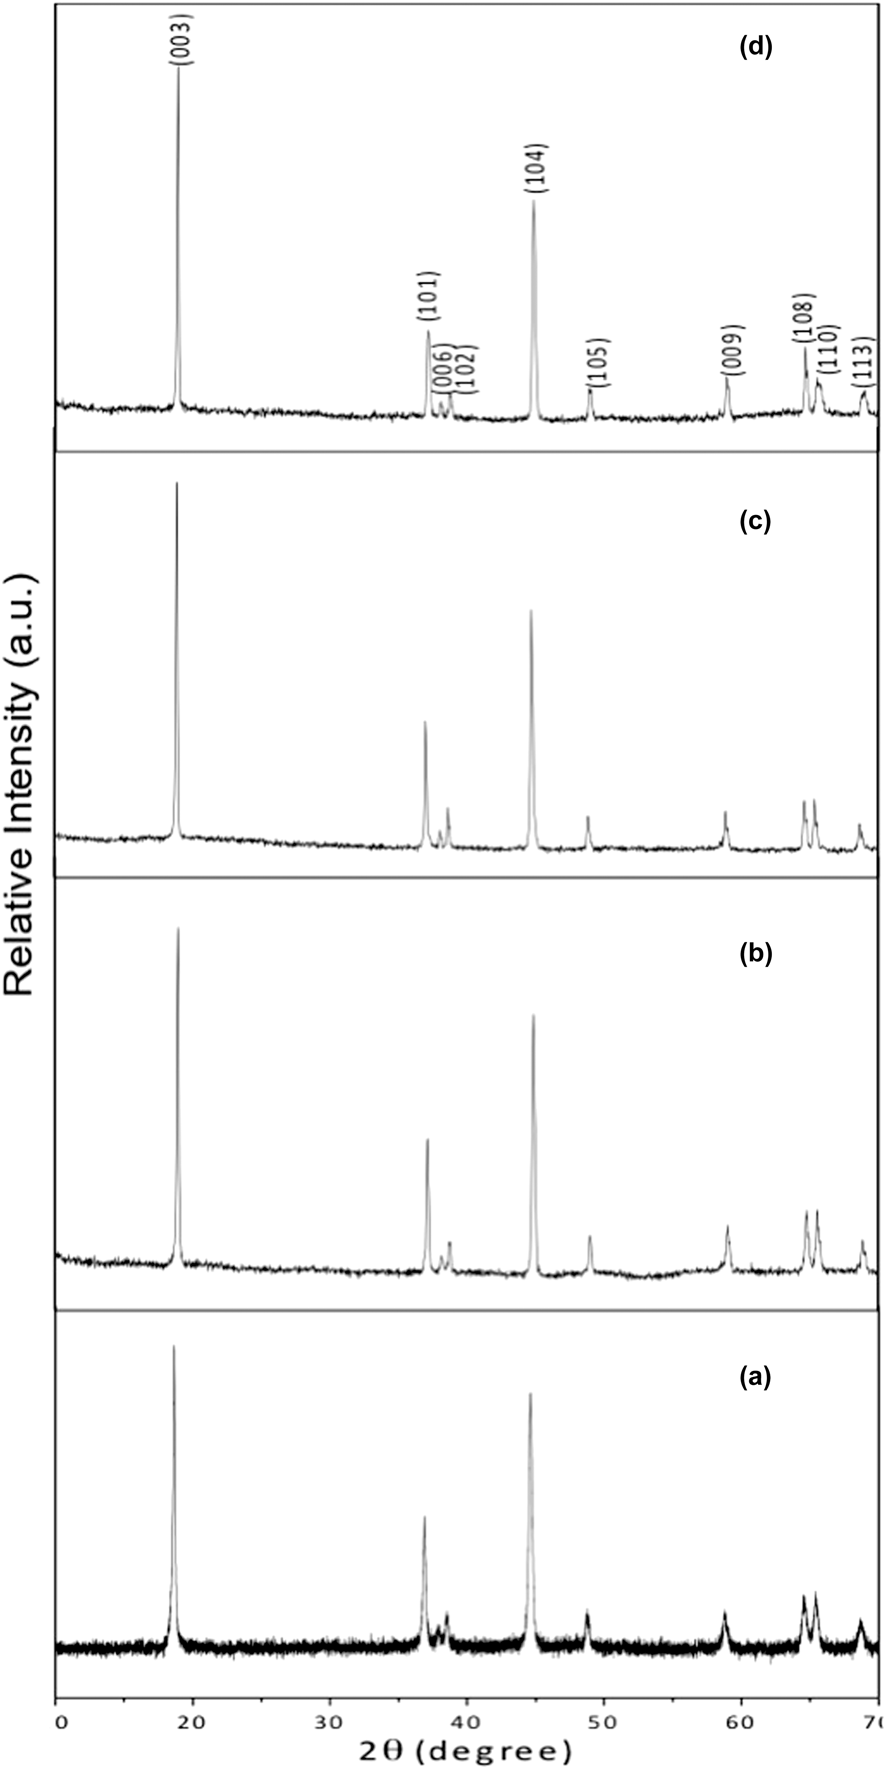
XRD patterns of Li[Ni1/3Co1/3Mn1/3]O2 annealed in air for 3 h with increasing temperature are shown in Fig. 1. All peaks from L333 were indexed on the basis of the hexagonal α-NaFeO2 structure with the
 $R\bar 3m$
space group. Indexing of these diffraction patterns confirmed the formation of the layered L333 structure without any detectable impurities. All of the samples displayed doublet peaks for the (006)/(102) at 37° (2θ) and the (108)/(110) reflections at 65° (2θ), an indication of ordering of the hexagonal layered structures.
Reference Hwang, Tsai, Carlier and Ceder6
XRD patterns of Li[Ni1/3Co1/3Mn1/3]O2 annealed in air for 3 h at (a) 750 °C, (b) 850 °C, (c) 950 °C, and (d) 1000 °C.

This reduction of cationic mixing enabled a more efficient intercalation and deintercalation of lithium ions inside the host matrix, leading to improved electrochemical performance. Reference Reimers, Dahn, Greedan, Stager, Liu, Davidson and Vonsacken29
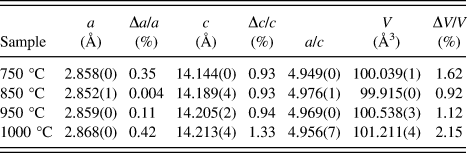
It is also clear that with increasing annealing temperature, the peak-splitting became more pronounced, indicating an increased cationic ordering. Besides peak splitting, the ratio of the intensities of the (003) to (104) indices (i.e., I (003)/I (104)) is an indicator of cation mixing in materials with a layered structure. For example, a ratio of I (003)/I (104) > 1.2 indicates lower cation mixing with highly ordered structures. Reference Ding, Zhang, Jiang and Gao18 From Table I, we can clearly see that the ratios of I (003)/I (104) at 750, 850, 950, and 1000 °C are 1.19, 1.28, 1.49, and 1.47, respectively, demonstrating an increase in cationic ordering with temperature and confirming results from the peak splitting analyses.
Calculated lattice parameters.

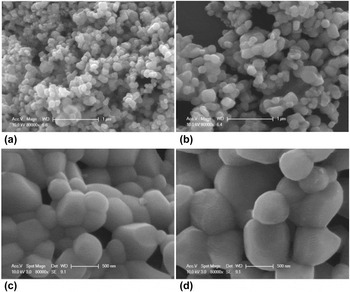
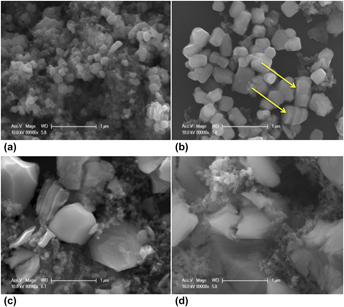
SEM micrographs of specimens annealed in air at different temperatures are illustrated in Fig. 2. As expected, the micrographs show that the particle sizes increase with increasing annealing temperature. Confirmation of the particle crystallinity was demonstrated by TEM from previous work, Reference Zhu, Vo, Li, Lu, Kinsinger, Xiong, Yan and Kisailus26 which revealed significant crystal growth of L333 between 750 and 1000 °C. Specifically, specimens heated to 750 °C demonstrated a nanocrystalline nature (i.e., crystal diameters less than 50 nm) as determined by analyses of the FWHM from XRD patterns. These crystals grow in size with increased temperature up to 166 nm by 850 °C, 458 nm by 950 °C, and eventually to 850 nm by 1000 °C (Table I). It is evident that annealing at lower temperatures [i.e., Figs. 2(a)–2(c)] yields a more uniform size distribution than at 1000 °C [Fig. 2(d)]. Thus, the annealing temperature not only affects the crystal size but also changes the particle size dispersity.
SEM micrographs of Li[Ni1/3Co1/3Mn1/3]O2 annealed in air for 3 h at (a) 750 °C, (b) 850 °C, (c) 950 °C, and (d) 1000 °C.

B. Electrochemical performance
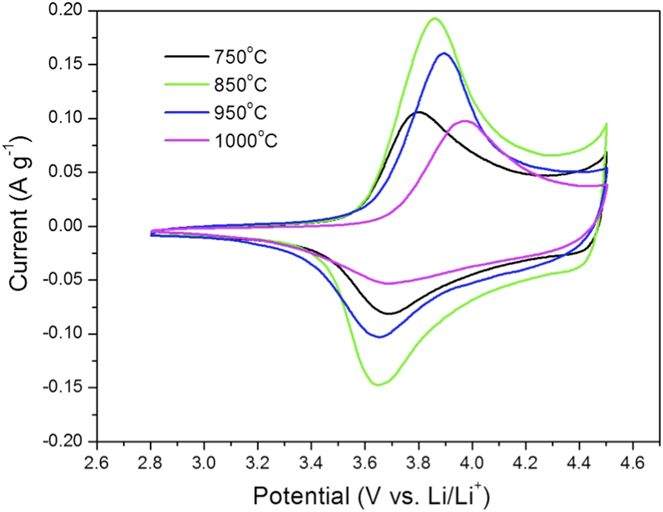
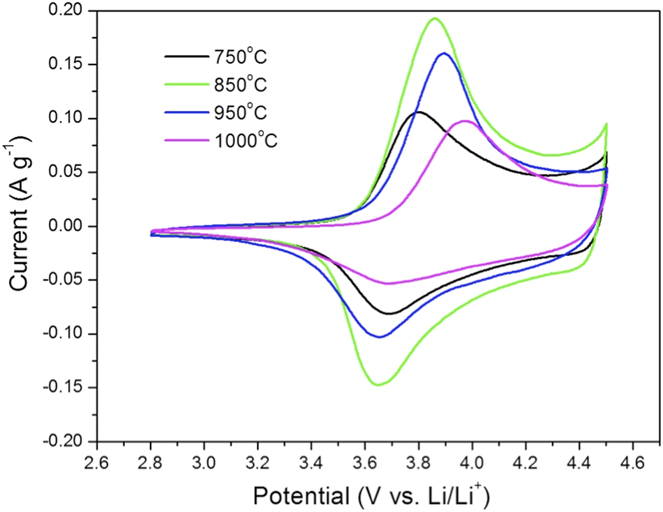
Figure 3 shows representative CV curves of samples annealed under different temperatures. Each of these curves displays only one oxidation peak and reduction peak, corresponding to the charge/discharge reactions of the Ni2+/Ni4+ redox couple. Reference Kim and Chung30,Reference Wu, Wang, Su and Chen31 The lack of a peak at 3 V indicates the absence of Mn3+ in the as-synthesized material. Reference Gopukumar, Chung and Kim32,Reference He, Ma, Liao and Jiang33 The potential separations between the anode and cathode peaks are at 0.12, 0.21, 0.24, and 0.28 V for samples annealed at 750, 850, 950, and 1000 °C, respectively. Here, there is an increased peak separation, which indicates a decreased rate constant for charge transfer due to the increasing crystalline sizes for specimens annealed at 750–1000 °C. In addition, samples treated at 850 and 950 °C display the highest peak currents (0.19 A/g, and 0.16 A/g) compared to samples annealed at 750 and 1000 °C. It is clear that samples treated at 850 and 950 °C which show smaller voltage differences between the charge and discharge as well as higher peak currents indicate better electrode reaction kinetics and rate performance. Reference Lan, Wang, Zhang, Zhang, Wu and Zhang34,Reference Zhu, Fiore, Li, Kinsinger, Wang, DiMasi, Guo and Kisailus35
CV profiles of Li[Ni1/3Co1/3Mn1/3]O2 (annealed in air for 3 h at various temperatures) in the voltage range of 2.8–4.5 V at a scan rate of 0.1 mV/s.
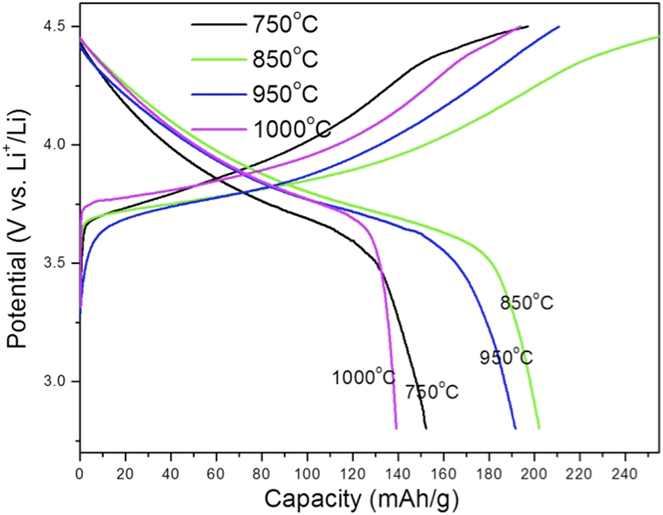
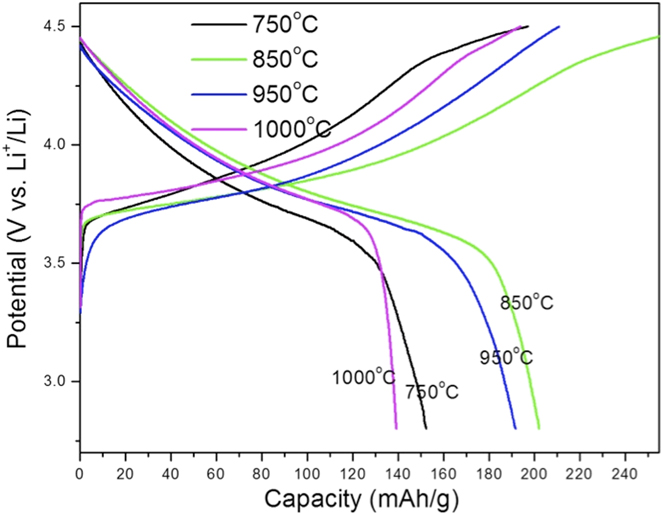
The initial charge/discharge profiles of cells with different L333 cathode crystal sizes are illustrated in Fig. 4. The first discharge capacities are 155.1, 204.7, 191.6, and 139.3 mA h/g at 750, 850, 950, and 1000 °C, respectively. Here the discharge capacities are comparable or even better than those currently reported. Reference Gao, Li, Liu, Pinto, Jiang and Yang36 The discharge plateaus for samples annealed at 850 and 950 °C are longer compared to the other two samples, indicating the increased kinetics of these cathodes with increased annealing temperatures.
Initial charge/discharge profiles of Li[Ni1/3Co1/3Mn1/3]O2 samples at 16 mA g−1 (synthesized at different annealing temperatures) in the voltage range of 2.8–4.5 V.
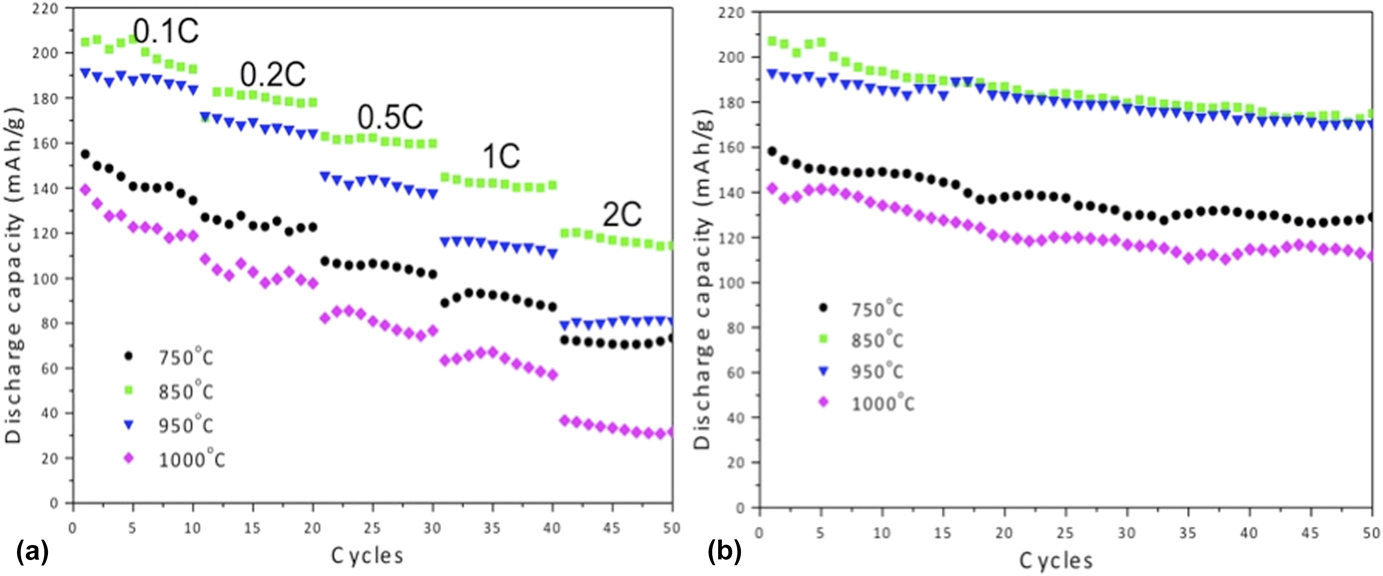
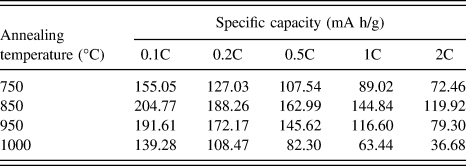
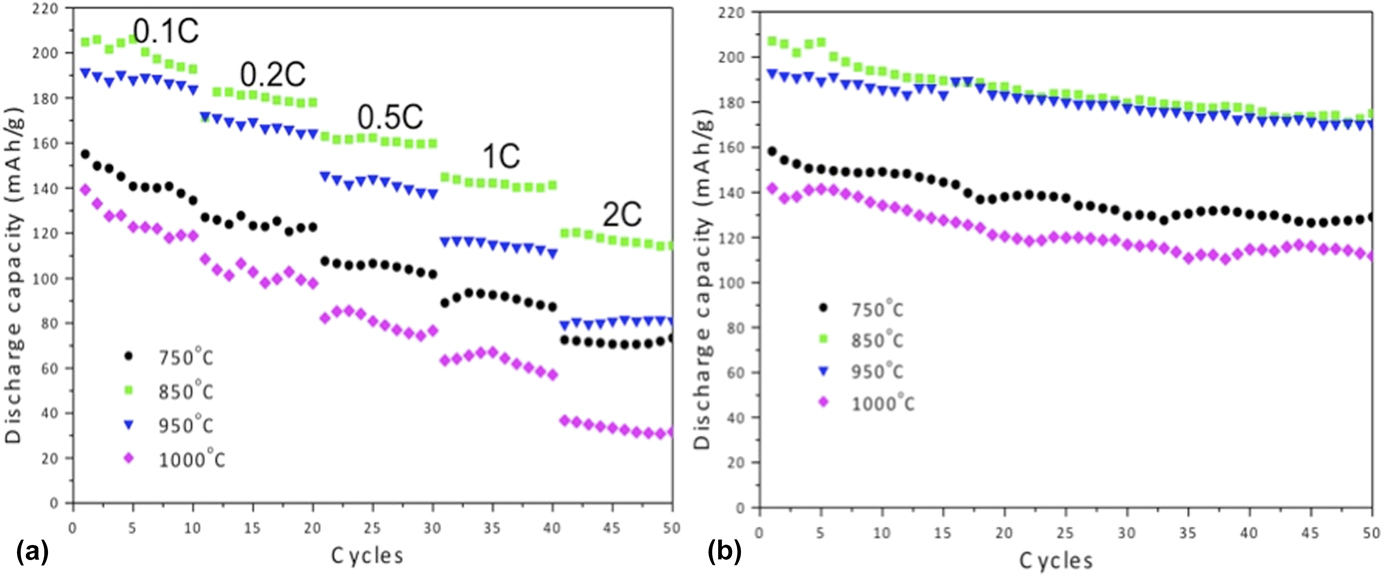
Further cycling charge–discharge capacities were measured at 0.1C for 10 cycles followed by 10 cycles at 0.2C, 0.5C, 1C, and 2C. Figure 5(a) clearly demonstrates that the sample annealed at 850 °C delivers the highest discharge capacity. Although the discharge capacity inevitably decreases with increasing current density, cathodes annealed at 850 °C in air for 3 h delivered a discharge capacity of 119.9 mA h/g at 2C (Table II), comparable with a carbon coated L333 system. Reference Hsieh, Mo, Chen and Chung37 By comparing the samples annealed at 950 and 1000 °C, which have similar cation ordering (I (003)/I (104) = 1.49 and 1.47, respectively), the smaller crystal size (458 nm at 950 °C) displays a higher capacity than larger ones (850 nm at 1000 °C) due to the increased surface area and the decreased diffusion path for lithium ions.
Cycling performance of Li[Ni1/3Co1/3Mn1/3]O2 cathodes between 2.8 and 4.5 V (versus Li+/Li) (a) at different current rates (0.1C, 0.2C, 0.5C, 1C, and 2C); (b) discharge capacity at 0.1C over 50 cycles.
Specific capacities for Li[Ni1/3Co1/3Mn1/3]O2 cathodes annealed at various temperatures for 3 h.
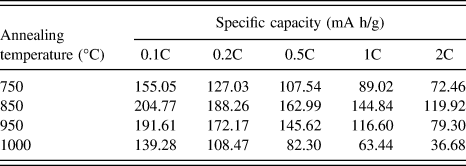
Further calculations (Table II) show that the capacity difference between samples annealed at 850 and 950 °C is smaller (∼15 mA h/g) at low current densities (from 0.1 to 0.5C), but increases to 30 mA h/g at 1C and 40 mAh/g at 2C. Therefore, the smaller crystal size is beneficial under high rates.
The similar phenomenon was also reported by the other researchers in their nanomaterial system. Reference Wang, Ruiz, Guo, Favors, Bay, Ozkan and Ozkan38 This is because the increased surface area provides increased interfaces between the electrolyte and the active material, at the same time, the smaller particle sizes shorten the diffusion path of lithium ions from the surface to the interior of particles, therefore delivering high capacity, especially at high rates. Figure 5(b) displays the cycling stability at 0.1C for all samples. Clearly, the 850 and 950 °C samples carry higher discharge capacities with higher capacity retention (84% for 850 °C and 88% for 950 °C) compared with the other two samples (81% for 750 °C and 79% for 1000 °C) after 50 cycles.
C. Degradation
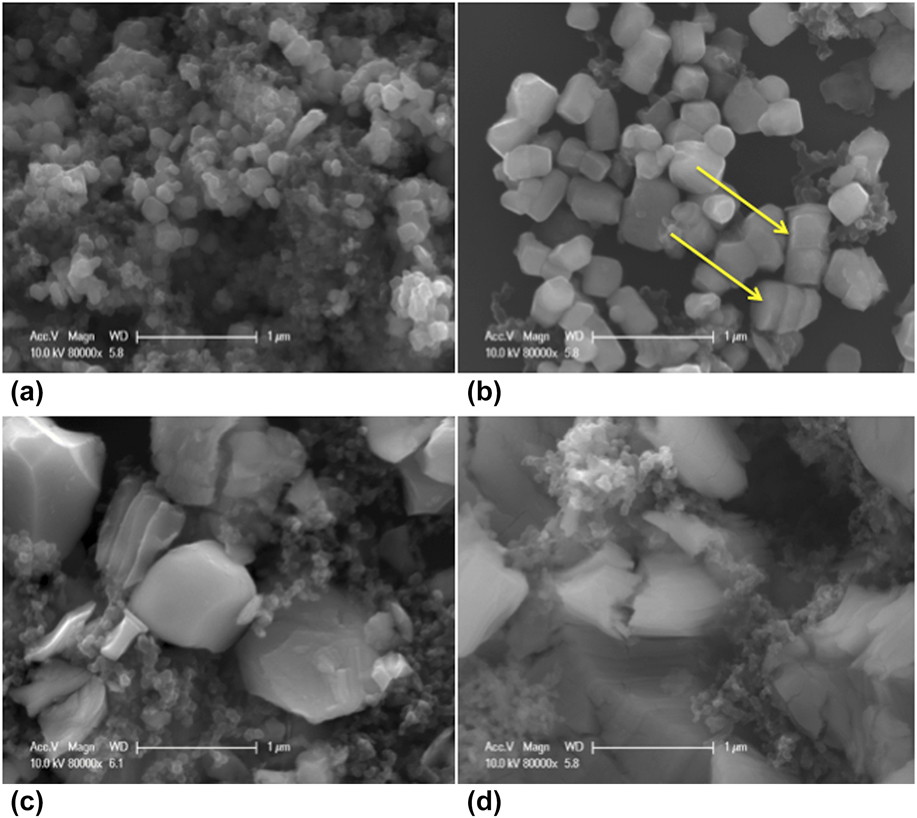
To investigate the degradation in performance for Li[Ni1/3Co1/3Mn1/3]O2 cathodes annealed at different temperatures, we disassembled the cells after 50 cycles and collected the cathode materials from the Al foil. The mixture was rinsed with NMP several times to remove the PVDF binder and the remaining organic solvents from the electrolyte. The material was subsequently dried in the vacuum oven for 2 days at room temperature and then subjected to XRD and SEM characterization. Figure 6 demonstrates the SEM micrographs of cathodes removed from the cells after 50 cycles. Based on analyses by EDS, smaller particles in each micrograph are mostly carbon that was mixed during the cell preparation.
SEM micrographs of Li[Ni1/3Co1/3Mn1/3]O2 cathode particles, annealed in air for 3 h at (a) 750 °C, (b) 850 °C, (c) 950 °C, and (d) 1000 °C, and removed from cells after 50 charge–discharge cycles. Yellow arrows in (b) show particles that appear banded due to strain.

The particles that were annealed at 750 and 850 °C did not show obvious structural changes [Figs. 6(a) and 6(b), respectively]. However, some evidence of banding was observed in a few particles [see yellow arrows in Fig. 6(b)]. Small cracks appeared in particles annealed at 950 °C [Fig. 6(c)] and the significantly larger cracks and fractured particles were observed in samples annealed at 1000 °C [Fig. 6(d)]. To study the crystal microstructure change, we conducted the further XRD analyses to calculate the lattice parameters and volume changes.
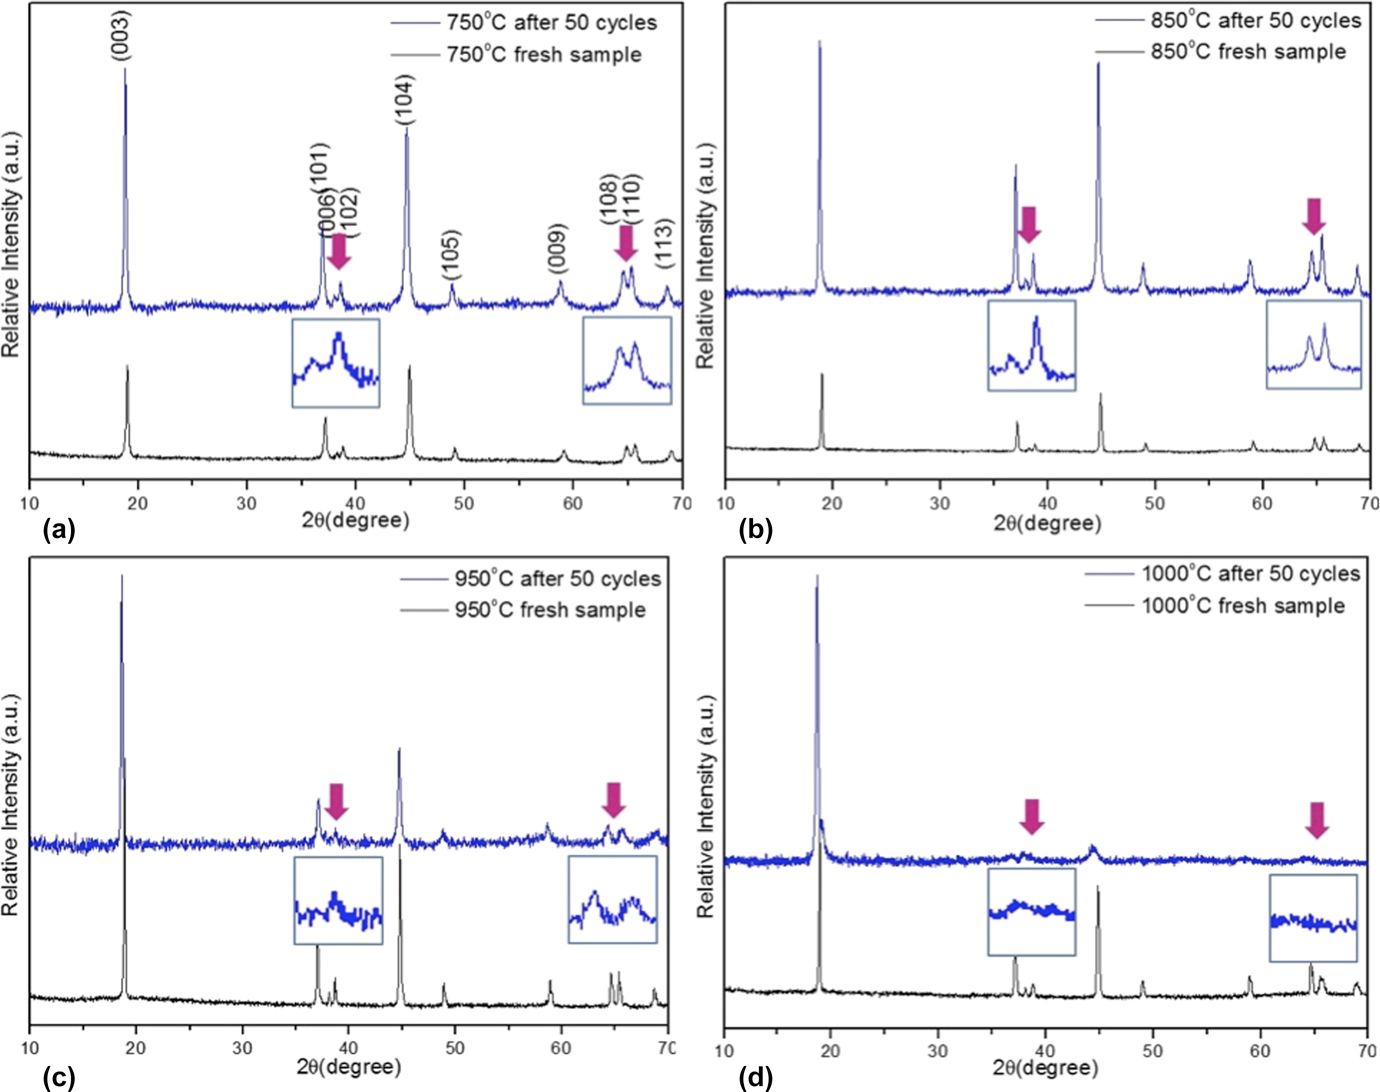
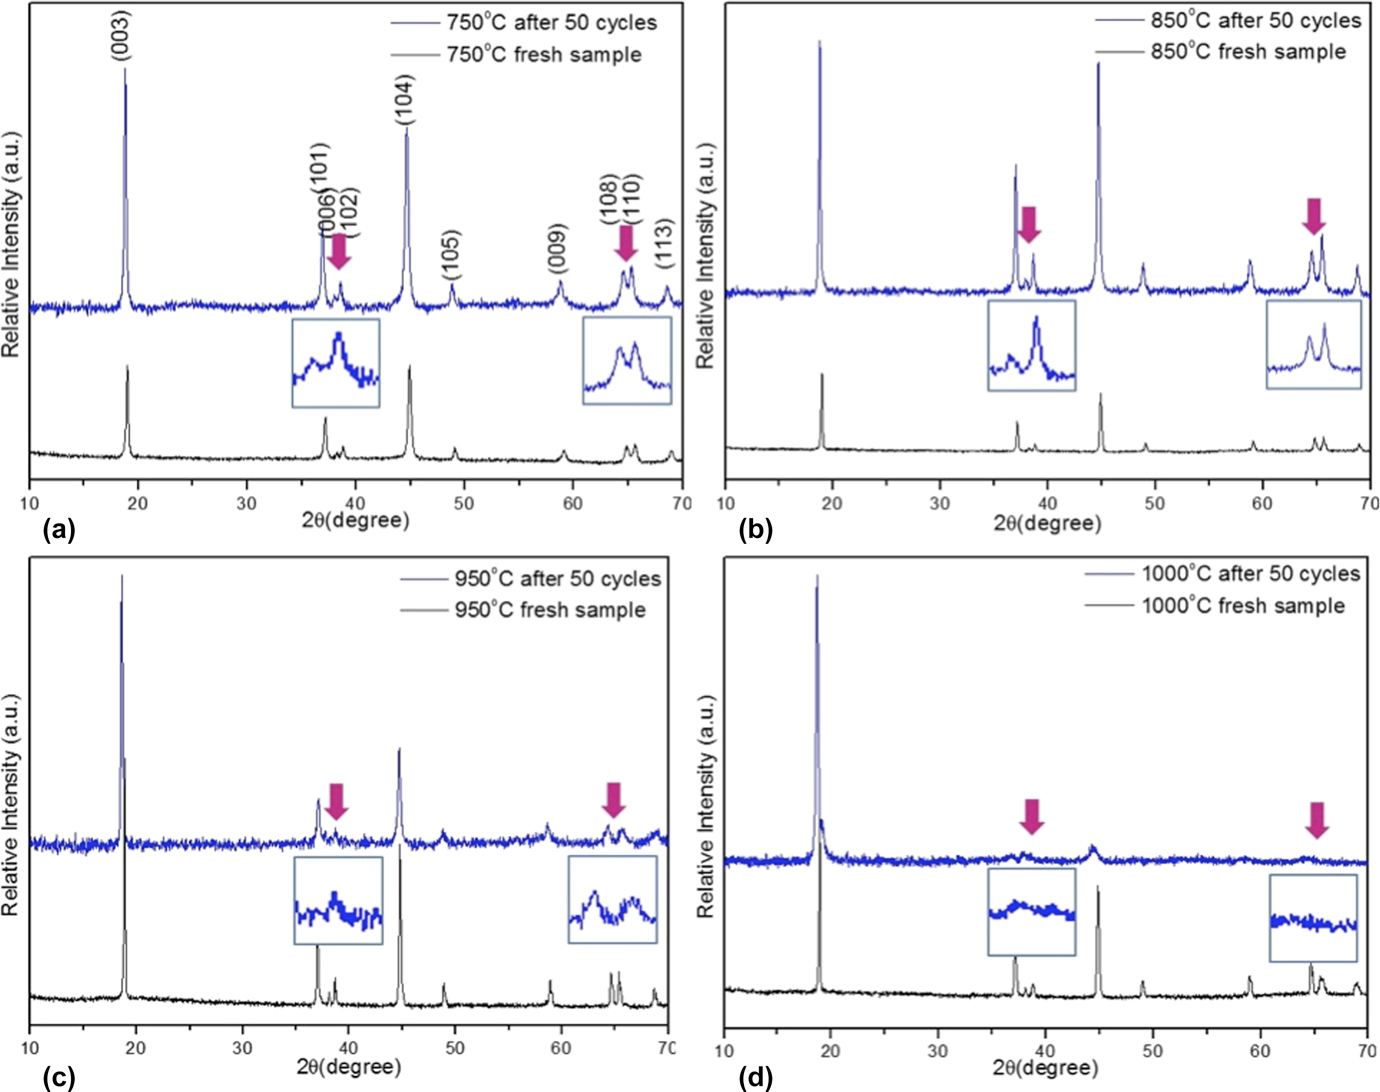
Figure 7 show the XRD patterns for noncycled Li[Ni1/3Co1/3Mn1/3]O2 samples (black line) and after 50 cycles (blue line). It can be seen that some of the peaks shifted to lower 2-theta values after cycling, indicating an increased lattice parameter and expanded volume. As discussed earlier, the peak splitting for the (006)/(102) and (108)/(110) reflections represents a well-ordered layered structure. After 50 cycles, the extent of splitting of peaks did not appear to change for specimens annealed at 750 and 850 °C. However, the intensity of the splitting decreased for the sample annealed at 950 °C [Fig. 7(c)] and was especially significant in the first peak splitting ((006)/(102) reflections). The sample annealed at 1000 °C [Fig. 7(d)] showed a further decrease in peak intensity, with almost no splitting observed. These analyses are consistent with our SEM observations.
Comparisons of cation ordering via XRD for Li[Ni1/3Co1/3Mn1/3]O2 samples annealed in air for 3 h at: (a) 750 °C, (b) 850 °C, (c) 950 °C, and (d) 1000 °C, before (black) and after (blue) cycling with enlarged area highlighted to show peak splitting.
Detailed lattice parameters are listed in Table III, from which we can see that the 1000 °C cathode shows the largest lattice parameter increase and volume expansion (2.15%), while samples annealed at 850 and 950 °C display minimal changes. Here, we also observed that the percent change in the “a” lattice parameter (i.e., <0.5%) is significantly less compared to those occurring in the “c” (∼1 or >1%), indicating anisotropic degradation in the L333 system. It is known that lithium ions move along the ab plane in L333 during lithiation and delithiation. Thus, we suspect that parameter c change in this crystal structure degradation is comparably a mild effect to the performance compared to changes along a and b. By combining the above SEM and XRD analyses with charge–discharge cycling performance, it is clear that smaller particle sizes will yield smaller structural changes and thus, better strain accommodation, which is also observed in LiCoO2 cathodes as well as Si-based anodes. Reference Liu, Zhong, Huang, Mao, Zhu and Huang39–Reference Zhao, Pharr, Vlassak and Suo42 According to Liu et al., Reference Liu, Zhong, Huang, Mao, Zhu and Huang39 there exists a critical particle size of ∼150 nm below which cracking did not occur, and above which surface cracking and particle fracture took place upon lithiation. The unexpected surface cracking is attributed to the development of hoop tension in the surface layer, resulting from a unique lithiation mechanism in crystalline Si nanoparticles by means of motion of a two-phase interface. In the study of Zhao et al., Reference Zhao, Pharr, Vlassak and Suo42 the inhomogeneous distribution of lithium in LiCoO2 results in stresses that may cause the particle to fracture. This might also apply to the L333 system based on the similar results, which is currently under investigation. One exception to this was the sample annealed at 750 °C. In this sample, it is believed that reduced ordering in the noncycled layered structure (I (003)/I (104) = 1.19) yielded poorer performance compared to samples annealed at 850 and 950 °C.
Lattice parameters for Li[Ni1/3Co1/3Mn1/3]O2 cathodes after 50 cycles.

In Figs. 7(c) and 7(d), it is clear that the intensity of some high index/low intensity crystallographic reflections was reduced or eliminated after extended electrochemical cycling (i.e., 50 cycles). For example, we observed that the (009) reflection in the 1000 °C annealed specimen almost completely disappears after 50 cycles. Careful observation of particles from Figs. 6(b)–6(d) reveals that many of the fractures initiate in specimens annealed at lower temperature (i.e., 850 °C) and are significantly exacerbated in specimens annealed at higher temperature (e.g., 1000 °C). Since lithium intercalation and deintercalation occur between metal oxide layers, which are parallel to (00l) planes, there are stresses developed due to volumetric strain. Thus, cracks are likely to develop along these planes. In fact, Fig. 6(b) shows a few particles that are apparently fracturing along parallel planes. During this fracture, it is clear that the severe fragmenting due to strain in larger crystals annealed at higher temperatures has reduced the faceting, fractured specimens along low index planes and subsequently reduced the intensities of higher order crystal reflections.
IV. CONCLUSIONS
We have systematically investigated the effects of crystal structure and size on the performance of Li[Ni1/3Co1/3Mn1/3]O2 cathodes. With increasing annealing temperature, Li[Ni1/3Co1/3Mn1/3]O2 has the increased ordering of the hexagonal α-NaFeO2 layered structure and increased crystallite sizes. Samples annealed at 850 and 950 °C, which have clear peak splitting, higher cation ordering, and uniform crystal sizes, demonstrated better electrochemical performance. The higher cationic ordering provides better cycling performance for the crystal sizes below 500 nm. In addition, crystal size has a key effect on the performance, especially for the high-current density discharge capacity. Due to the lower strain accommodation within the larger particles, cracks form in the microstructures during lithiation/delithiation, which results in a fast capacity fade.
ACKNOWLEDGMENT
This work is sponsored by the Winston Chung Global Energy Center.