
I. INTRODUCTION
Since the 21st century, environmental pollution and energy shortage problems have become an increasingly serious issue. There is an urgent need for the development and utilization of various clean and economical power sources. Currently commercial graphite anode material, with the theoretical lithium storage capacity of only 372 mA h/g, has been unable to meet the growing requirements of high energy density batteries. Therefore, the new generation of battery materials with high capacity and long cycle stability is the focus and the direction of the research. Although the theoretical capacity of graphene sheets is low, it has also attracted great scientific interest recently for lithium ion batteries due to its versatile combination of outstanding electronic conductivity, high charge mobility, large specific surface area, and good flexibility. Graphite-like transition metal disulfide MoS2 and graphene posses many superior physical and chemical characterizations. Owning to their matching crystal structure and micro-morphology, as well as their complementary electrical properties, these materials are becoming a hot spot of current research. The crystal structure of MoS2 is that hexagonal layers of Mo are sandwiched between two S layers. Strong covalent bonding characterizes the Mo–S interactions, while the interactions between S layers are characterized by weak van der Waals interactions. Reference Ramakrishna, Gomathi, Manna, Late, Datta, Pati and Rao1,Reference Zhu, Mu, Aken, Yu and Maier2 These weak van der Waals interactions between the sheets indicate that MoS2 can be exfoliated to single-layer or few-layer sheets. It is known to all that the transition metal disulfide nanosheets with single-layer or few-layers exhibit distinctively different electrical and mechanical properties in comparison with the bulk materials, which make it suitable for both the accommodation of large changes in volume and for the intercalation of lithium ions with high specific capacity.
Recently, it was reported that the single-layer or few-layer MoS2 sheets can be obtained from bulk materials by weakening the van der Waals force between the MoS2 layers, such as chemical liquid-phase exfoliation in N-butyllithium solution, Reference Smith, King, Lotya, Wirtz, Khan, De, Neill, Duesberg, Grunlan, Moriarty, Chen, Wang, Minett, Nicolosi and Coleman3 mechanical exfoliation, Reference Novoselov, Geim, Morozov, Jiang, Zhang, Dubonos, Grigorieva and Firsov4 and electrochemical lithium intercalation method. Reference Zeng, Sun, Zhu, Huang, Yin, Lu, Fan, Yan, Hng and Zhang5 However, the mechanical exfoliation is too inefficient, the liquid exfoliation consumes a large amount of organic solvent and is sensitive to environmental conditions. Electrochemical lithium intercalation is an effective way to get few-layered two-dimensional nanomaterials, but the pretreatment process is complicated. Moreover, the exfoliated nanosheets would re-aggregate or re-stack easily due to their van der Waals forces when they are extracted from suspensions. Thus, a facile and environmentally friendly route for the synthesis of single-layer or few-layer MoS2 nanosheets still remains a challenge.
A few new approaches toward the few-layer MoS2/graphene composites have been reported, during which the cationic surfactants, Reference Wang, Ma, Chen, Huang, Chen, Wang and Lee6–Reference Huang, Chen, Chen, Wang, Chang, Ma, Huang, Chen and Lee8 such as hexadecyl trimethyl ammonium bromide (CTAB), sodium dodecyl benzene sulfonate (SDBS), octadecyl trimethyl ammonium bromide (OTAB), and tetrabutylammonium bromide (TBAB), and many small molecule compounds (L-cysteine, ethylene glycol, polyethylene oxide, polyaniline, etc. Reference Chang and Chen9–Reference Lemon and Lerner11 ) showed some ability to control the microstructure (layer number) of MoS2 in the composites. It was believed that the cationic surfactants can be adsorbed on the negatively charged graphite oxide surface easily through electrostatic interaction, while the small molecule compounds can intercalate into the multi-layered MoS2 nanosheets, inducing few-layer MoS2/graphene composites. Reference Xiao, Choi, Cosimbescu, Koech, Liu and Lemmon12,Reference Kanatzidis, Bissessur, DeGroot, Schindler and Kannewurf13
However, there are apparent differences for the microstructure and electrochemical performances of the MoS2/graphene composites prepared by the above two ways. This phenomenon is not only related to the combinative state of MoS2 and graphene, but also related to the experimental parameters and the selection of surfactants and intercalating agents. Moreover, it is found that most of the aforementioned MoS2/graphene composites after annealing depict a disorder multi-layers stacked composite construction, with a restacking d-spacing at ∼0.62 nm, which would lead to electrical contact loss between active MoS2 and conductive graphene framework. Thus, the prospective of introduction of small molecule to prevent the agglomeration of pulverized MoS2 nanosheets and the buffer strain and stress of the volume change during cycling is very limited. Therefore, it is desirable to develop an efficient MoS2/graphene composite confining nanosized MoS2 with enlarged interlayer distance and ultrathin structure that can enhance the electronic and ionic conduction throughout the electrode.
Herein, we demonstrate a novel nanocomposite comprised of few-layer MoS2 nanosheets with enlarged interlayer distance inlayed into three-dimensional graphene (MoS2/GNS-G) by a facile hydrothermal method followed by glucose-assisted thermal annealing. The glucose serving as a small organic molecule can interlay into MoS2 nanosheets, and therefore effectively hinder the aggregation and restacking of MoS2 during the heat treatment, promoting the formation of fewer-layer MoS2 sheets with enlarged interlayer distance (approximately 0.98 nm). The as-synthesized MoS2/GNS-G composites with sandwich structure exhibit a remarkably enhanced reversible lithium storage capacity with fast charge/discharge capability and long cycle life when it was applied in the lithium-ion batteries anode.
II. EXPERIMENTAL
A. Synthesis of few-layer MoS2/GNS-G composite
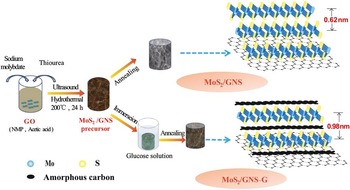
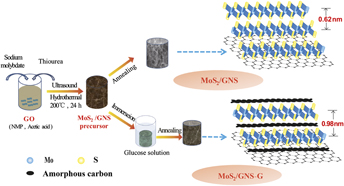
Firstly, graphene oxide (GO) sheets were prepared from natural graphite powder via a modified Hummers method as described in our previous work. Reference Zhao, Zhang, Song, Jiang, Zhuang, Liu and Fang14,Reference Jiang, Ling, Cai, Jiao, Cheng, Bian, Nguyen, Chu and Zhao15 Then, few-layer MoS2/graphene composite with enlarged interlayer distance (MoS2/GNS-G) was synthesized via a hydrothermal method followed by glucose-assisted thermal annealing. The schematic formation process was illustrated in Fig. 1.
Schematic synthesis of MoS2/GNS and MoS2/GNS-G composites.

In a typical experiment, 30 mL of 3 mg/mL GO aqueous dispersion was firstly treated by sonication for 2 h, forming a brown dispersion. Afterward, 20 mL 1-methyl-2-pyrrolidone (NMP) and 2 mL glacial acetic acid were added with vigorous stirring for several minutes. Subsequently, 0.45 g of sodium molybdate and 0.57 g of thiourea were added to the mixture with stirring for 30 min. The resultant mixture was transferred into the 100 mL Teflon-lined stainless steel autoclave. The tightly sealed autoclave was maintained at 200 °C for 24 h. After cooling naturally, the hydrothermal product was taken out, washed repeatedly with deionization water, and then freeze-dried to obtain the MoS2/graphene aerogels precursor. Subsequently, the precursor was immersed into 2 mol/L glucose aqueous solution for 24 h and then subjected to freeze drying in a freeze-dryer. The final product was obtained by annealing at 800 °C for 2 h in a nitrogen atmosphere. For comparison, MoS2/GNS composite was obtained in the same way by annealing the MoS2/graphene aerogels precursor directly without immersing into the glucose aqueous solution.
B. Structural characterization
X-ray powder diffraction patterns were obtained from Rigaku D/max-2500 powder x-ray diffractometer (Rigaku Co., Tokyo, Japan) operating at 40 kV and 30 mA and using Cu Kα radiation (λ = 0.15406 nm). The diffraction patterns were recorded at room temperature in the 2θ range from 5° to 80°. The powder morphology was observed under a field-emission scanning electron microscope (FESEM; JSM-6700F, 15 kV, JEOL Ltd., Tokyo, Japan). The transmission electron microscope (TEM) observations were performed on a JEM-2010F electron microscope (JEOL Ltd.) operating at 200 kV. Raman spectra were recorded on Renishaw in plus laser Raman spectrometer (Renishaw Plc, Birmingham, United Kingdom) with a 514.5 nm laser (5 mW) from 200 cm−1 to 900 cm−1 at room temperature. The specific surface area and pore size distribution were obtained from a N2 adsorption-desorption analysis conducted at 77 K on Quadrasorb SI (Quantachrome Instruments, Boynton Beach, Florida). The specific surface area was calculated by the BET method, and pore size distribution was obtained from desorption plots by a Barrett–Joyner–Halenda (BJH) analysis.
C. Electrochemical measurements
The working electrode was prepared by mixing active material, carbon black (Super P), and polytetrafluoroethylene (PTFE) at a weight ratio of 85:10:5 and pasted onto Cu foil (99.6%, Goodfellow). Lithium foil (φ = 15 mm, 1.0 mm thick, Aldrich) served as counter electrode and reference electrode, the microporous polypropylene film Celgard 2400 (Celanese Corporation, Charlotte, North Carolina) served as a separator. The electrolyte consisted of a solution of 1 M LiPF6 in a mixture of dimethyl carbonate (DMC), diethyl carbonate (DEC), and ethylene carbonate (EC) (1:1:1 by weight) was obtained from Ube Industries Ltd. (Tokyo, Japan). The coin-cells (2032) were assembled in an argon-filled glove box (Mikrouna, Super 2440/750, Shanghai, China) and tested on a LAND CT2001A cell test system (Wuham LAND Electronics Co. Ltd., Wuhan, China) under current density range from 100 mA/g to 1000 mA/g in the voltage range of 0.005–3.0 V. Cyclic voltammetry measurements were carried out on CHI 660C electrochemical workstation (CH Instruments, Inc., Shanghai, China) in the potential range of 0.01–3.00 V versus Li/Li+ at a scan rate of 0.5 mV/s.
III. RESULTS AND DISCUSSIONS
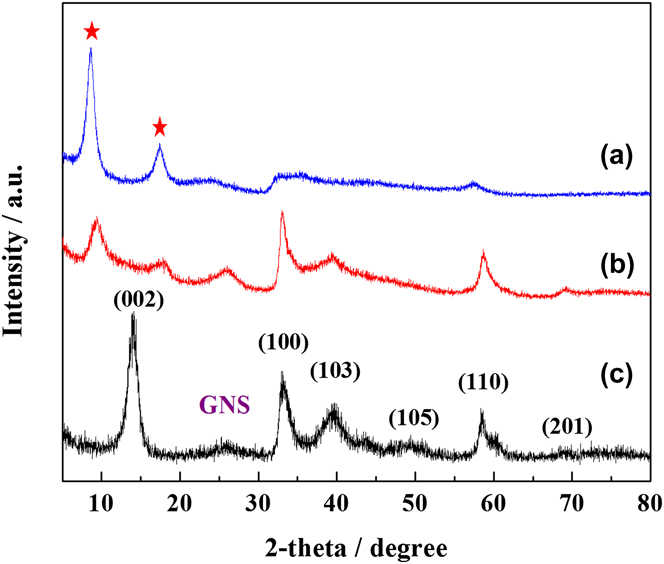
Figure 2 shows the XRD patterns of the MoS2/graphene aerogels precursor, MoS2/GNS and MoS2/GNS-G composites after annealing. It is clear that all the diffraction peaks at 2θ = 33.5, 39.5, 49.5, 58.6, and 69.0° can be readily ascribed to the (100), (103), (105), (110), and (201) planes of hexagonal 2H-MoS2 phase (JCPDS No. 37-1492), respectively. Besides these peaks, the MoS2/graphene aerogels precursor before annealing depicts two prominent diffraction peaks at 8.9 and 17.6°. Whereas, the diffraction peak at 2θ = 14.2° corresponding to the (002) plane of the MoS2 is disappeared. According to Bragg's equation, it can be calculated that the mean interlayer distances of these two planes are 0.98 and 0.50 nm, respectively. It is known to all that the d-spacing of MoS2 is 0.62 nm, the d-spacing of carbon is 0.334 nm. The interlayer distance of 0.98 nm is approximately equal to the sum of d(002) of MoS2 and one carbon atom thickness. So we indicate that the appearance of a new diffraction peak at 8.9° is contributed to solvent molecules inlayed into MoS2 nanosheets, the appearance of another diffraction peak at 17.6° is attributed to the diffraction from adjacent MoS2 sheets and solvent molecules. Reference Wang, Chen, Chen, Chang, Ma, Huang, Chen and Lee7,Reference Chang, Chen, Ma, Li, Li, Huang, Xu, Zhang and Lee16 However, a strong diffraction peak at 13.8° corresponding to (002) plane of MoS2 with a d-spacing of 0.64 nm was observed for the MoS2/GNS composite, indicating a well stacked layered structure after heat treatment. This phenomenon reveals that the solvent molecules are volatilized or decomposed during annealing, causing the restacking of the MoS2 nanosheets. It also explains the multiple-layers structure of the previous reported MoS2-based composites. Reference Ma, Huang, Chen, Wang, Ye, Li, Chen and Lee17–Reference Ding, Chen and Lou20
XRD patterns of MoS2/graphene aerogels precursor (a), MoS2/GNS-G (b) and MoS2/GNS (c) composites after annealing.
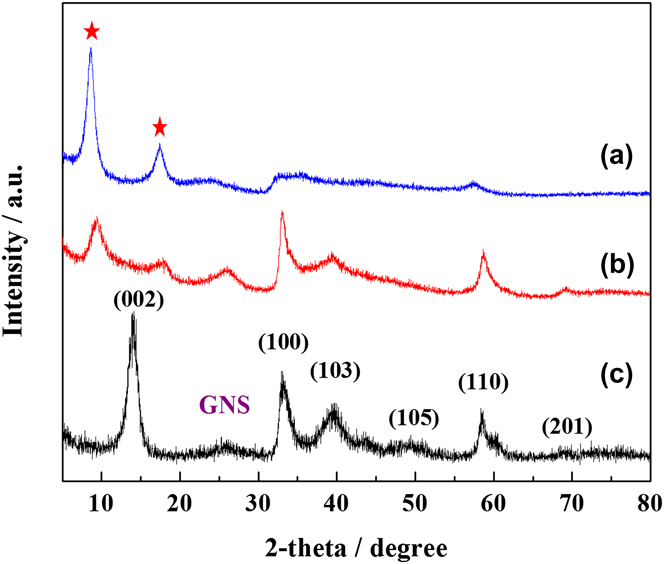
Whereas, when the MoS2/graphene aerogels precursor was immersed into glucose aqueous solution, these two diffraction peaks of the annealing product (MoS2/GNS-G composite) can be effectively retained with only a slight weakness in intensities. Therefore, it is delighted to find that the facile glucose-immersing method could effectively inhibit the restacking of MoS2 during annealing, thus obtaining a stable sandwich structure nanocomposite. It is one of the few XRD identification that the intercalation structure can be retained after thermal annealing among all the hydrothermal routes. Reference Huang, Chen, Chen, Wang, Chang, Ma, Huang, Chen and Lee8 This might be that the glucose, which was adsorbed on the surface of solvent-molecules-inlayed MoS2 nanosheets, was in situ pyrolyzed into amorphous carbon and thus inlayed into the interlayer of MoS2 nanosheets. It is notable that the sandwich structure with increased interlayer distance can provide a larger space for lithium ion intercalation and facilitate lithium ion diffusion with reduced diffusion barriers.
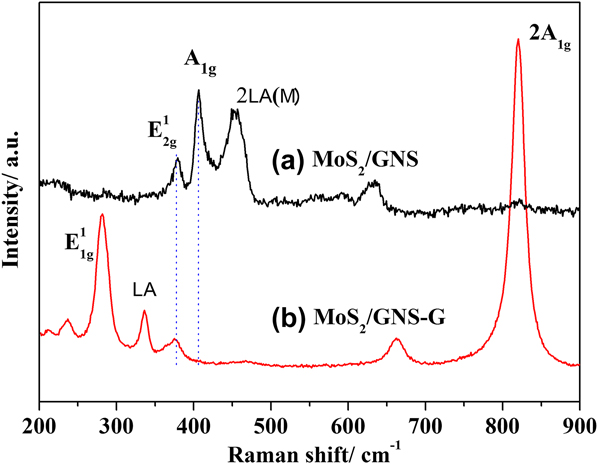
Raman spectra shown in Fig. 3 are further used to analyze the corresponding structure. Three prominent peaks at 383, 408, and 454 cm−1 are attributed to the in-plane E2g 1 (the in-plane displacement of Mo and S atoms), out-of-plane A1g (out-of-plane symmetric displacements of S atoms along the c-axis), and 2LA(M) mode of MoS2/GNS composite, respectively. Apparently, the Raman peak's intensity of the MoS2/GNS-G corresponding to E2g 1 Raman mode at 383 cm−1 become weaken compared with MoS2/GNS, which is due to the enlarged d-spacing of MoS2 nanosheets and the weakened interlayer forces. In addition, we can see that the mode of E1g 1 becomes stronger and the mode of A1g is severely suppressed. This implies that S atoms are more active in in-plane than the direction along the c-axis, which agrees with that of few-layer MoS2 sheets coated on carbon nanotubes. Reference Ma, Huang, Chen, Wang, Ye, Li, Chen and Lee17,Reference Bindumadhavan, Srivastava and Mahanty21 It is noteworthy that the appearance of two new Raman peaks at 330 and 660 cm−1 are due to the vibration of Mo‒S‒O bond, implying that the amorphous carbon is bound into the interlayer of MoS2 via strong chemical interaction. This electrostatic interaction between tetravalent molybdenum and carbon would increase the conductivity of the composite and improve the utilization of active materials effectively. Reference Li, Yu, Fu, Guo, Lei and Zhu18
Raman spectra of MoS2/GNS and MoS2/GNS-G composites.

The morphology and microstructure of the MoS2/GNS and MoS2/GNS-G composite before and after heat treatment are compared by SEM and TEM images. It can be observed from Fig. 4(a) that the MoS2/graphene aerogels precursor possesses an interconnected three-dimensional porous morphology, and the MoS2 nanosheets were stacked disorderly on the surface of graphene. After heat treatment, it can be clearly seen from Fig. 4(b) that the whole structure of the sample was contracted to a certain degree and the MoS2 nanosheets agglomerated on the surface of graphene, which is unfavorable for the structural stability. MoS2/GNS-G before heat treatment in Fig. 4(c) shows that the pore structure of aerogel was almost completely filled after immersing into glucose. Then, with the carbonization of the glucose, MoS2/GNS-G [Fig. 4(d)] represents a quasi-three-dimensional architectures comprising of numerous highly wrinkled nanosheets owing to the ultrathin features of MoS2 nanosheets. In addition, abundant macropores with size about several hundred nanometers and mesopores with size below 50 nm were observed for this composite. It is envisioned that the quasi-three-dimensional architectural composites built up with highly wrinkled few-layer two-dimensional nanosheets and abundant pores could provide multi-dimensional electron transport pathway, more and shorten channels for the electrolyte access, lithium ion diffusion, and insertion/extraction.
SEM images of MoS2/GNS and MoS2/GNS-G composites before (a and c) and after (b and d) annealing.

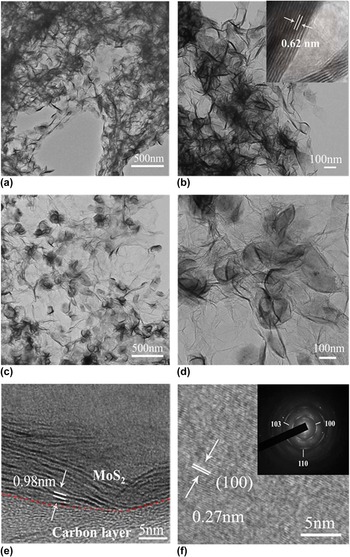
TEM and HRTEM characterizations are adopted to further observe the microstructure of MoS2/GNS and MoS2/GNS-G composites after annealing, as shown in Fig. 5. From Figs. 5(a) and 5(b), it is clearly discerned that a large number of MoS2 nanosheets are agglomerated to nanocluster and loaded on the surface of graphene in MoS2/GNS composite. The inset in Fig. 5(b) shows that the interlayer distance between two adjacent (002) lattice planes of MoS2 is about 0.62 nm, which is in accordance with the XRD analysis. In contrast, the MoS2 nanosheets are decorated uniformly on the surface of graphene without any obvious agglomeration for the MoS2/GNS-G composite [Figs. 5(c) and 5(d)]. We can initially conclude that the layers of MoS2 significantly reduced from the depth of the substrate. In addition, one can find that the ultrathin MoS2 nanosheets are curled or folded for minimizing the surface energy, which is benefit to increase the specific surface area of the sample and might result in generating more active sites to increase the lithium storage capabilities. Further, the HRTEM image of MoS2/GNS-G shown in Fig. 5(e) shows that the typical layered MoS2 with a few layers (8–10) are highly dispersed in amorphous carbon. The proximal MoS2 nanosheets exhibit an interlayer distance of about 0.98 nm. This result further demonstrates that the amorphous carbon inlayed into MoS2 nanosheets, generating two new diffraction peaks at 8.9 and 17.6° in the XRD pattern. HRTEM image of Fig. 5(f) taken from a typical MoS2 nanosheet shows that the spacing of the adjacent lattice is 0.27, which is in good accordance with typical (100) plane of the MoS2. A selected-area electron diffraction pattern is shown in inset of Fig. 5(f), it is clearly discerned that three concentric circles are in accordance with typical (100), (101), and (110) planes of the pure hexagonal MoS2 phase, respectively. In general, the few-layer MoS2 nanosheets with enlarged gallery can effectively shorten the migration path of Li+, providing more active sites and lower diffusion energy barrier of Li+ ions, which is leading to improved electrochemical lithium storage ability. Reference Ma, Ye, Chen, Wang, Liu and Lee22
TEM images of MoS2/GNS (a and b), inset of (b) shows the multiple-layer structure of MoS2 nanosheet with d-spacing of 0.62 nm. TEM and HRTEM images of MoS2/GNS-G (c–f), inset of (f) shows the corresponding SAED pattern.

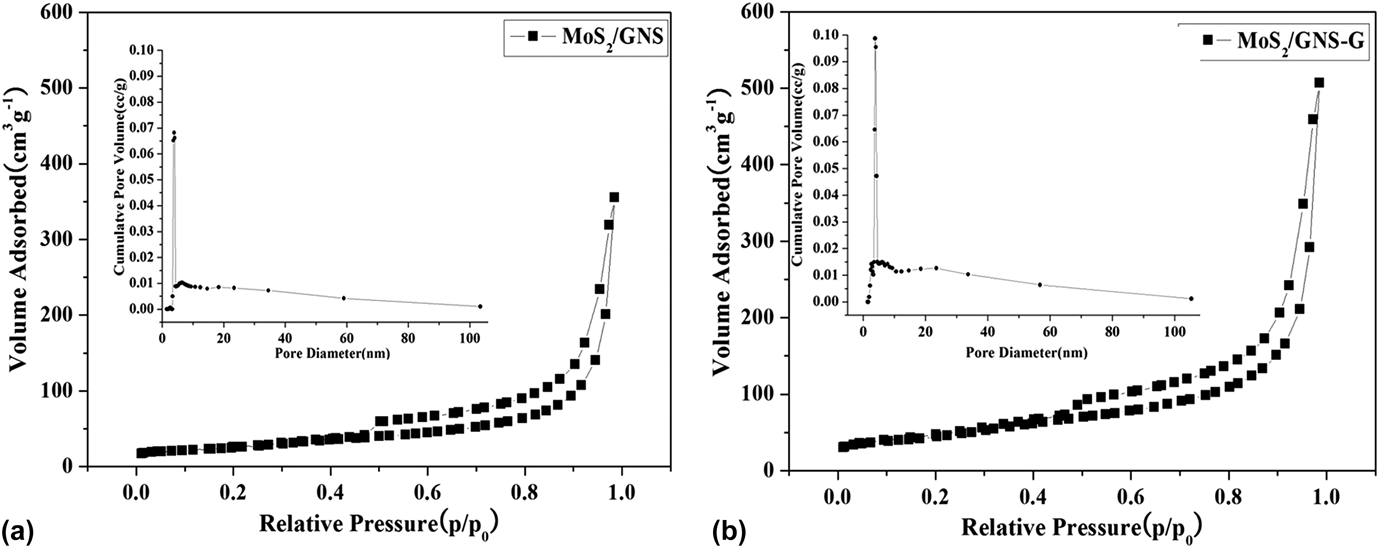
Nitrogen adsorption–desorption measurements were utilized to study the specific surface area, texture, and porous nature of the MoS2/GNS and MoS2/GNS-G composites after annealing. As shown in Fig. 6, their adsorption–desorption isotherms coincide with a type H3 isotherm. The specific surface area of MoS2/GNS-G is calculated to be about 155 m2/g by the Brunauer–Emmett–Teller (BET) analysis, which is much larger than the MoS2/GNS composite (approximately 85 m2/g). The difference of specific surface area between MoS2/GNS and MoS2/GNS-G composites is due to the amorphous carbon can effectively hamper the aggregation and restacking of MoS2 nanosheets. In addition, a large number of mesopores with a peak centered at 3–5 nm are generated in the curled and folded few-layer MoS2 nanosheets [inset of Fig. 6(b)]. These pores are formed from the stacking of MoS2 nanosheets, which have been demonstrated in the SEM and TEM images.
N2 adsorption/desorption isotherms and pore size distribution of MoS2/GNS (a) and MoS2/GNS-G (b).

The electrochemical performances of the MoS2/GNS and MoS2/GNS-G composite electrodes are systematically evaluated by cyclic voltammetry and galvanostatic discharge/charge measurements. Figures 7(a) and 7(b) show the first three CV cycles of MoS2/GNS and MoS2/GNS-G composites at a scanning rate of 0.5 mV/s between 0.005 and 3.0 V versus Li+/Li. The CV features of the two samples are basically similar to that of other MoS2 and MoS2-based composite electrodes reported in the previous literature. Reference Chang, Chen, Ma, Li, Li, Huang, Xu, Zhang and Lee16,Reference Yang, Wang, Mao, Deng, Gao, Tang and Schmidt23–Reference Tronganh, Yang, Chen, Lu, Jiang, Gao, Cheng and Jiao26 It can be observed that after the first cycle the subsequent CV curves of MoS2/GNS-G electrode almost overlap, indicating its excellent retention of structural stability during the charge/discharge process. However, the peak intensity constantly decreases with cycle number for MoS2/GNS electrode, which also reflects in the cyclic performance shown later.
The first three cycle voltammograms and charge and discharge potential profiles of MoS2/GNS (a and c) and MoS2/GNS-G (b and d) composites.

Figures 7(c) and 7(d) show the charge/discharge potential profiles of the MoS2/GNS and MoS2/GNS-G composite electrodes for the initial three cycles at a current density of 100 mA/g. The first discharge potential profile of the MoS2/GNS composite electrode can be divided into two plateaus and a sloped region, as shown in Fig. 7(c). The plateau at about 1.1 V is ascribed to the intercalation of Li+ into the MoS2 lattice, accompanied by the phase transformation from 2H to 1T Li x MoS2. Reference Hu, Wang, Zhang, Wang, Cheng, Tao and Chen27 The subsequent plateau at about 0.6 V is due to the conversion reaction process, in which Li x MoS2 is first decomposed to Mo particles embedded into a Li2S matrix. Reference Jiang, Ren, Wang, Hu, Guo, Yuan, Hu, Zhang and Li28,Reference Liu, Wu, Ma, Dou, Wu, Tao, Wang, Ouyang, Shen and Wang29 The sloped region below 0.5 V could be ascribed to the formation of a solid electrolyte interphase (SEI) layer, which is due to the electrochemical drive electrolyte degradation. In the second and third discharge curves, two potential plateaus at 1.9 and 1.2 V can be observed and the potential plateau at 0.6 V in the first discharge disappears. These results of the charge–discharge curves are in accordance with the aforementioned CVs. In the charge process, the potential plateau at 2.2 V can be clearly identified for the first and subsequent cycles, which might be ascribed to the oxidation of Li2S. By contrast, for the MoS2/GNS-G sample, the potential plateaus become inconspicuous because of the poor crystallinity of few-layer MoS2 nanosheets and the introduction of amorphous carbon in the composite. The initial discharge and charge specific capacities of MoS2/GNS are determined to be 1121.7 mA h/g and 718.2 mA h/g, with a coulombic efficiency of 64.0%. The following discharge specific capacity decreased sharply to 832.4 mA h/g, demonstrating fast capacity decay. In comparison with MoS2/GNS, the MoS2/GNS-G composite delivers high discharge and charge capacities at the first cycle, which are 1582.0 and 951.0 mA h/g, respectively. The discharge capacity steadily retains at about 929 mA h/g at the 2nd and 3rd cycles. And the discharge and charge curves are well overlapped from the second cycle, indicating the high reversibility and high capacity retention of the MoS2/GNS-G electrode. Hence, this method could effectively improve the discharge capacity and reversibility of the composite electrode.
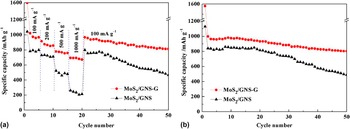
To investigate the rate capability of the MoS2/GNS and MoS2/GNS-G composite electrodes, we conducted a multiple-current galvanostatical testing, as shown in Fig. 8. It is obviously shown that all the rate capacities of MoS2/GNS-G are higher than those of MoS2/GNS. Even at a high current density of 1000 mA/g, the specific discharge capacity is 673.5 mA h/g for MoS2/GNS-G, whereas the MoS2/GNS could only deliver less than 270 mA h/g. Furthermore, as the current density drops back to 100 mA/g, the specific capacity of MoS2/GNS-G composite almost returns to its original value and further test demonstrates the conservation of the capacity. Hence, MoS2/GNS-G electrode appears to be useful for situations where quick charge and discharge are desired. Figure 8(b) further shows the cyclic stability of these two electrodes at 100 mA h/g. It is shown that the MoS2/GNS electrode delivers a significantly reduced discharge capacity over 350 mA h/g after 50 cycles. The irreversible capacity loss of approximately 57% can be mainly attributed to the aggregation of the MoS2, thus cannot form an effective electron transfer channel within the conductive framework of graphene. Moreover, the MoS2/GNS cannot effectively buffer the strain and stress of the volume change during lithium ions insertion/extraction process, which might result in the detachment and restacking of the MoS2 nanosheets and drastic particle pulverization. On the contrary, the MoS2/GNS-G composites display significantly improved cycling stability. After 50 cycles, a reversible capacity is maintained as high as 767.5 mA h/g. It is obvious that the MoS2/GNS-G demonstrates a much better electrochemical performance compared to MoS2/GNS, which is also superior to those of MoS2/graphene composites prepared by cationic-surfactant assisted solution process reported previously. Reference Wang, Ma, Chen, Huang, Chen, Wang and Lee6,Reference Huang, Chen, Chen, Wang, Chang, Ma, Huang, Chen and Lee8,Reference Zhou, Qin, Zhang, Shi, Liu, Li, Zhao and He30 The excellent electrochemical performance of MoS2/GNS-G for reversible Li+ storage can be ascribed to the expanded interlayer distance of MoS2 nanosheets and the interlayed amorphous carbon. As we all know that the enlarged interlayer distance could provide more active sites, shorten the migration path of Li+ and promote the lithium intercalation process. In addition, the presence of amorphous carbon can provide sufficient interspace between the MoS2 nanosheets. Along with the three-dimensional graphene matrix, the amorphous carbon can effectively hinder the aggregation and restacking of MoS2 and mitigate the strain caused by lithium insertion/de-insertion. What is more, the folded structure, large surface area, and abundant mesopore distribution can dramatically increase a large number of reactive sites, thus increasing the electrochemical performance of active materials.
Rate capabilities (a) and cycling performances (b) of MoS2/GNS and MoS2/GNS-G composites.

IV. CONCLUSIONS
In summary, few-layered MoS2/graphene nanocomposite with enlarged interlayer distance was successfully synthesized by a simple glucose-assisted hydrothermal route. During the synthesis, glucose served as a small organic molecule can interlay into MoS2 nanosheets and effectively retain a sandwich structure of the MoS2/graphene composite, hindering the aggregation and stacking of MoS2 during the heat treatment. Structural characterization shows that the MoS2/GNS-G composite is composed of a few-layered MoS2 nanosheets with an expanded interlay spacing (approximately 0.98 nm). This structure can effectively buffer the volume expansion of MoS2 nanosheets during charging and discharging process and fundamentally suppress their restacking. Electrochemical tests demonstrate that the MoS2/GNS-G delivers a high discharge capacity of 1583.0 mA h/g in the initial cycle at current density of 100 mA/g. The specific capacity remained at a relatively high value of 673.5 mA h/g even at a current density of 1000 mA/g.
ACKNOWLEDGMENTS
This work was supported by the National Natural Science Foundation of China (21501119, 11575105, 21371116, 21571063), Science and Technology Committee of Shanghai (15DZ0501402, 15195800600), Shanghai Municipal Education Commission (Peak Discipline Construction Program), Program for Changjiang Scholars and Innovative Research Team in University (IRT13078).