





Suicide remains a leading cause of death worldwide, with an estimated 727 000 people dying by suicide every year, according to the World Health Organization (WHO). 1 Young adults have been reported to have disproportionately high suicide rates. Suicide is the third leading cause of death among individuals aged 15–29 worldwide. 1 According to the WHO, about 73% of suicides occur in low- and middle-income countries, with Asian countries accounting for nearly 60% of the world’s suicides. 1 In 2022, after the COVID-19 pandemic, Lew et al conducted a study that revealed Malaysia to have the second-highest suicide rate among selected Muslim-majority countries, with 5.8 suicides per 100 000 population and an estimated 1841 suicide deaths; this indicates an average of 5 deaths per day. Reference Lew, Kõlves, Lester, Chen, Ibrahim and Khamal2 Many individuals who contemplate or attempt suicide do not receive adequate mental health support from professionals. This can be attributed to the stigma and taboo surrounding suicide, which often leads individuals to hide their struggles and suffer in silence. Reference Gunnell, Appleby, Arensman, Hawton, John and Kapur3
The high prevalence of suicide in the Southeast Asian region is due to multiple factors. For example, low mental health and suicide literacy, the high stigma associated with mental illness and suicide, and the criminalisation of suicide attempts are all predisposing causes that hinder people from seeking help. Reference Batterham, Han, Calear, Anderson and Christensen4–Reference Aldalaykeh, Dalky, Shahrour and Rababa6 Furthermore, suicide is considered a sinful and forbidden behaviour in most major religions in Malaysia. Reference Amiri, Voracek, Yousef, Galadari, Yammahi and Sadeghi7,Reference El Halabi, El Hayek, Kahil, Nofal and El Hayek8 Additionally, many individuals with suicidal thoughts believe that people around them would stigmatise them as weak and selfish and hinder them from help-seeking behaviour. Reference Calear, Batterham and Christensen9,Reference Sheehan, Corrigan and Al-Khouja10 Limited suicide prevention literacy and high stigma towards suicide may also pose obstacles to the development of effective preventive strategies. Reference Fekih-Romdhane, Daher-Nashif, Stambouli, Alhuwailah, Helmy and Shuwiekh11 Hence, understanding the stigma towards suicide is vital in the policy-making process for a multicultural and religious country.
In Malaysia, two instruments indirectly assess stigma towards suicidal behaviour. The first instrument validated in Malaysia is the Suicide Opinion Questionnaire, which consists of 22 items and assesses the acceptability of suicide, morality, mental illness, professional role, work and care, communication, attention and beliefs. Reference Nazli, Ooi, Thyagarajan and Jamaluddin12 The second commonly used measure is the Attitudes Towards Suicide (ATTS) questionnaire, adapted for Malaysian healthcare personnel, which consists of 37 items divided into 10 factors. Reference Siau, Wee, Ibrahim, Visvalingam and Wahab13 However, neither instrument assesses stigma directly. The SOSS-SF effectively serves this purpose by assessing stigma towards individuals who die by suicide using one- or two-word descriptors. Reference Batterham, Calear and Christensen14
The present study aimed to validate a Malay translation of the SOSS-SF and explore its psychometric properties for assessing stigma towards suicide. We believe that an adapted Malay version will help researchers in further studies that contribute to policy-making in formulating the national suicide prevention strategy in Malaysia.
Method
Ethics statement
Ethical approval for this study was obtained from the National University of Malaysia (ref.: JEPUKM_JEP-2022-543) and online consent was obtained from all participants.
Study sample
The sample for this online cross-sectional study comprised students at three universities in the Klang Valley, Malaysia. All participants were sampled conveniently. The inclusion criteria were: (a) at least 18 years old; (b) Malaysian; (c) an active student of the university. International students are excluded from the study. Based on Hair et al, at least 2 to 20 persons for each item are required for scale validation, Reference Hair, Anderson, Tatham and Black15 and a minimum of 100 participants is suggested to validate an instrument. Reference Comrey and Lee16 In line with these recommendations, the sample size calculated for this study was 224 participants (16 items × 14 persons = 224). Reference Hair, Anderson, Tatham and Black15 Assuming a non-response rate of 10%, the final sample size required was 246. Reference Hoerger17
Instruments/measures
The online questionnaire comprised three sections: the demographic section, the Malay translation of the Stigma of Suicide Scale-Short Form (SOSS-SF) section and the Malay version of the Attitudes Towards Suicide (ATTS) section.
The Stigma of Suicide Scale-Short Form (SOSS-SF)
The original 16-item Stigma of Suicide Scale-Short Form (SOSS-SF) was developed by Batterham et al to determine the stigma towards people with a history of suicide attempts. Reference Batterham, Calear and Christensen14 It consists of three subscales, each item of which includes a positive or negative phrase/statement (one or two words) about suicide and people who take their own lives. Reference Batterham, Calear and Christensen5 The subscales are: (a) Stigma (eight items, e.g. shallow, stupid, irresponsible); (b) Isolation or depression (four items, e.g. lonely, isolated, disconnected); and (c) Glorification/Normalisation (four items, e.g. strong, noble). Participants are required to rate how much they agree with each item using a 5-point Likert scale (1 = strongly disagree, 2 = disagree, 3 = neutral, 4 = agree, 5 = strongly agree). Higher scores denote higher levels of stigma towards people who kill themselves. The SOSS-SF has been translated into several languages, such as Chinese, Reference Han, Batterham, Calear, Wu, Shou and van Spijker18 Arabic, Reference Aldalaykeh, Dalky, Shahrour and Rababa6 Bangla (Bengali), Reference Arafat, Hussain, Hossain, Islam and Menon19 Hong Kong Chinese Reference Fong, Yip, Chan and Ho20 and Nepali. Reference Gupta, Sharma, Sah, Sharma, Jha and Chapagai21 The SOSS-SF is deemed a short, focused and easily administrable tool for large-scale research. Reference Wu, Chen, Batterham and Han22
The subscales of the original SOSS-SF have been demonstrated to have high internal consistency, with overall Cronbach’s α values of 0.89 (Stigma subscale), 0.88 and 0.78 (Isolation or depression subscale), 0.78 and 0.82 (Glorification/Normalisation subscale), and 0.70 for the overall scale in a sample size of 1286 Australians aged 18 years and above. Reference Batterham, Calear and Christensen14
The Attitudes Towards Suicide (ATTS) questionnaire
We used the adapted Attitudes Towards Suicide (ATTS) questionnaire to test the discriminant validity of the translated SOSS-SF. The ATTS was developed by Renberg & Jacobsson, Reference Renberg and Jacobsson23 who aimed to introduce an instrument to measure attitudes towards suicide from a broader perspective. It consists of 37 items rated on a 5-point Likert scale (1 = totally disagree, 5 = totally agree). The questionnaire has been translated into Malay and validated among healthcare personnel in Malaysia. Reference Siau, Wee, Ibrahim, Visvalingam and Wahab13 The ATTS comprises ten factors, such as Suicide as a right, Non-communication, Preventability and Tabooing. Higher scores indicate agreement with the factor or domain. The Malay ATTS demonstrated acceptable reliability (Cronbach’s α = 0.72) and adequate validity within Malaysia. Reference Siau, Wee, Ibrahim, Visvalingam and Wahab13 In our study, the researchers focused on four distinct domains: Factor 1, ‘Ability to understand and accept suicide’, with six items; Factor 3, ‘Believability of suicidal threats’, consisting of five items; and Factor 10, ‘Normality of suicide’, comprised of two items.
Translation of the SOSS-FF into Malay
For the translation and cross-cultural adaptation process, the SOSS-SF was forward-translated into Malay, following the recommended guideline outlined by Cruchinho et al. Reference Cruchinho, López-Franco, Capelas, Almeida, Bennett and da Silva24 A Malay linguistic expert was recruited who is also bilingual in both the source language and Malay to ensure that the SOSS-SF’s meaning was retained as much as possible. The Malay version was then back-translated into English by a counsellor registered with the Board of Counsellors (Malaysia), who is a native speaker of Malay. For some items, direct translation was not achievable since some phrases required adjustment to the local context.
We convened a harmonisation meeting with a panel of clinical psychologists, psychologists, counsellors and linguistic experts, with the aim of comparing the forward- and back-translations. In the meeting, the panel reviewed and discussed potentially unclear phrases and agreed on the first Malay version of SOSS-SF. For example, ‘isolated’ and ‘disconnected’ presented inconsistencies during translation. The direct translations were discarded to align with local understanding of ‘isolation’ and ‘feeling disconnected from society’, and the disparities were reconciled: a five-word descriptor was utilised for ‘disconnected’ and a two-word descriptor was agreed on for ‘isolated’.
A pilot test of this first (‘harmonised’) version was conducted in a public university, involving 30 undergraduate students recruited through convenience sampling. Following this, the translation was amended and proceeded to validation in a larger sample (Supplementary Fig. S1, available at https://doi.org/10.1192/bji.2026.10132), as described in this paper.
Data analysis
The Statistical Package for the Social Sciences (SPSS, version 25.0; IBM, Armonk, New York; https://www.ibm.com/support/pages/downloading-ibm-spss-statistics-25) and Jeffrey’s Amazing Statistics Program (JASP, version 0.93; JASP Team, University of Amsterdam, the Netherlands; https://jasp-stats.org/) were used for statistical analysis. Descriptive statistics were used to understand respondents’ demographic characteristics, calculate scores and explore the instrument’s range. Its reliability was assessed using Cronbach’s α.
Factor structure
Previous studies have demonstrated 3 to 4 structures of the SOSS-SF in different contexts: for example, in Hong Kong, a 4-factor structure with 12 items was recommended rather than the original 3-factor structure with 16 items. Reference Fong, Yip, Chan and Ho20 Therefore, exploratory factor analysis (EFA) was again employed as an exploratory approach in our study. This method was used to determine the number of latent factors and to evaluate which observed variables serve as meaningful indicators of these latent dimensions, based on the magnitude and variability of the factor loadings. Reference Brown25 We used EFA used principal component analysis and oblimin rotation to determine the number of factors and similarities between three-factor domains. We chose oblimin rotation from the oblique rotation methods because the factors in the SOSS-SF were estimated to correlate with one another. Reference Batterham, Han, Calear, Anderson and Christensen4 Factor loading of an item had to be above a threshold level of 0.35 on the factors on which it loaded the strongest, and the item factor loading on others should not exceed 0.30. Reference Hair, Anderson, Tatham and Black15
Discriminant validity
The scarcity of validated psychometric instruments in Malaysia for directly assessing stigma towards suicide underscores the importance of synthesising the discriminant validity of the SOSS-SF and comparing it with other instruments. Discriminant validity helps to determine whether the Malay versions of the SOSS-SF and ATTS measure distinct constructs. Discriminant validity refers to two instruments demonstrating validity by showing that their scores have low correlations with factors that, in theory, they should not be strongly associated with. Reference Reber, Reber and Allen26 This weak correlation indicates that the measures are indeed capturing different constructs. Reference Rönkkö and Cho27 As part of the evaluation of discriminant validity, the total scores on the SOSS-SF and subscores on the ATTS were assessed by Pearson correlations. Furthermore, each latent variable was assessed for internal consistency reliability using Cronbach’s α coefficients. Cronbach’s α values between 0.70 and 0.95 were considered to indicate adequate reliability of the questionnaire. Reference Tavakol and Dennick28
Invariance
We used several models to assess the invariance of the Malay version of the SOSS-SF across age and gender groups. Reference Tan and Pektaş29 First, we established the configural invariance model, allowing for differences in all parameters, including factor loadings, intercepts and error terms for age and gender groups. The focus was on determining whether the latent variable structure replicated consistently across groups. Second, the metric invariance model aimed to assess whether the factor loadings were the same across groups by allowing the differences in intercepts and error terms. This model also assessed whether the strength of relationships between observed variables and latent variables was equivalent across groups. Its model fit was compared with the configural invariance model fit to determine whether a metric invariance model was achieved. Third, the scalar invariance model assessed whether factor loadings and intercepts were at the same value across groups by allowing for differences in intercepts and error terms. This step makes meaningful comparisons of the means for each latent variable across groups. Its model fit was compared with the metric invariance model fit to determine whether a scalar invariance model was achieved. The measurement invariance of the instrument was subsequently confirmed when the model fit indices were satisfactory, and nested model comparisons met the criteria of difference in the comparative fit index (ΔCFI ≤ 0.010), in the Tucker–Lewis index (ΔTLI ≤ 0.010) and in the root mean square error of approximation (ΔRMSEA ≤ 0.010), indicating that the invariance model was supported. Reference Andre, Maulana, Helms-Lorenz, Telli, Chun and Fernández-García30,Reference Yue, Yue, Liu, Li, Dong and Bao31 The difference in the chi-squared statistic (Δχ2), the difference in the degree of freedom (Δd.f.) and the p-value were not used as criteria owing to sensitivity to sample size and the limited ability to differentiate between invariant and non-invariant models. Reference Andre, Maulana, Helms-Lorenz, Telli, Chun and Fernández-García30,Reference Yue, Yue, Liu, Li, Dong and Bao31
Results
In the pilot test with 30 undergraduate students, the first Malay version of the SOSS-SF had a Cronbach’s α of 0.82.
In the main study, involving the amended Malay version, 248 participants were recruited. Five (2%) of these were excluded from the analysis because they either had missing data or had failed to meet the inclusion criteria, and their data were removed. Thus, the final sample size was 243 (98%) participants. Of these, 151 (62.1%) were 21 years old and above, and 171 (70.4%) were female. Most participants were in the Faculty of Science and Technology (20.6%) and the Faculty of Medicine and Health Science (18.1%). Participants’ demographic data are shown in Supplementary Table S1, available at https://doi.org/10.1192/bji.2026.10132.
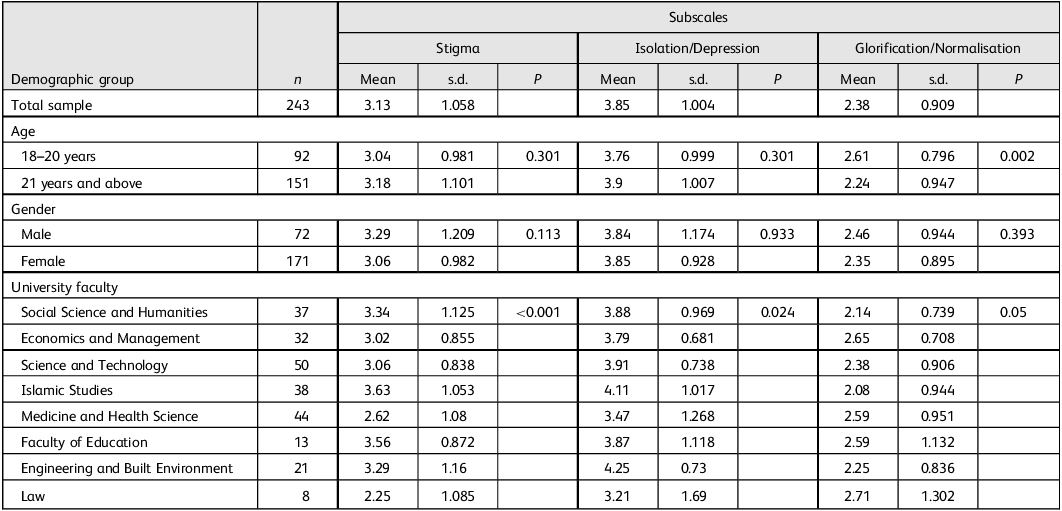
The total score on the SOSS-SF is computed by calculating the average score of the responses. An average score >3.0 suggests alignment of respondents with the objective concept. Reference Fekih-Romdhane, Daher-Nashif, Stambouli, Alhuwailah, Helmy and Shuwiekh11 Results for the subscale items on the Malay version of the SOSS-SF showed that 75.3% of participants agreed or strongly agreed with the item ‘lost’ (mean (M) = 3.96, s.d. = 1.228), making it the highest-rated item. Conversely, 11.5% of participants agreed or strongly agreed with the item ‘noble’ (M = 2.26, s.d. = 1.228), the lowest-rated item. Responses to each subscale are shown in Supplementary Table S1. The Isolation/Depression subscale reported the highest average score with a mean of 3.85 (s.d. = 1.004), whereas the glorification/normalisation subscale lowest average score with a mean of 2.38 (s.d. = 0.909) (Table 1).
Association between participants’ demographic group and their scores on the Malay version of the Stigma of Suicide Scale-Short Form (n = 243)

Table 1 Long description
The table presents data on the scores of different demographic groups on the Malay version of the Stigma of Suicide Scale-Short Form (SOSS-SF). It includes 243 participants divided by age, gender, and university faculty. The table has 12 rows and 12 columns. The columns are labeled as Demographic group, n, Stigma (Mean, s.d., P), Isolation/Depression (Mean, s.d., P), and Glorification/Normalisation (Mean, s.d., P). Row 1: Total sample, 243, Stigma (3.13, 1.058, -), Isolation/Depression (3.85, 1.004, -), Glorification/Normalisation (2.38, 0.909, -). Row 2: Age 18-20 years, 92, Stigma (3.04, 0.981, 0.301), Isolation/Depression (3.76, 0.999, 0.301), Glorification/Normalisation (2.61, 0.796, 0.002). Row 3: Age 21 years and above, 151, Stigma (3.18, 1.101, -), Isolation/Depression (3.9, 1.007, -), Glorification/Normalisation (2.24, 0.947, -). Row 4: Gender Male, 72, Stigma (3.29, 1.209, 0.113), Isolation/Depression (3.84, 1.174, 0.933), Glorification/Normalisation (2.46, 0.944, 0.393). Row 5: Gender Female, 171, Stigma (3.06, 0.982, -), Isolation/Depression (3.85, 0.928, -), Glorification/Normalisation (2.35, 0.895, -). Row 6: Social Science and Humanities, 37, Stigma (3.34, 1.125, <0.001), Isolation/Depression (3.88, 0.969, 0.024), Glorification/Normalisation (2.14, 0.739, 0.05). Row 7: Economics and Management, 32, Stigma (3.02, 0.855, -), Isolation/Depression (3.79, 0.681, -), Glorification/Normalisation (2.65, 0.708, -). Row 8: Science and Technology, 50, Stigma (3.06, 0.838, -), Isolation/Depression (3.91, 0.738, -), Glorification/Normalisation (2.38, 0.906, -). Row 9: Islamic Studies, 38, Stigma (3.63, 1.053, -), Isolation/Depression (4.11, 1.017, -), Glorification/Normalisation (2.08, 0.944, -). Row 10: Medicine and Health Science, 44, Stigma (2.62, 1.08, -), Isolation/Depression (3.47, 1.268, -), Glorification/Normalisation (2.59, 0.951, -). Row 11: Faculty of Education, 13, Stigma (3.56, 0.872, -), Isolation/Depression (3.87, 1.118, -), Glorification/Normalisation (2.59, 1.132, -). Row 12: Engineering and Built Environment, 21, Stigma (3.29, 1.16, -), Isolation/Depression (4.25, 0.73, -), Glorification/Normalisation (2.25, 0.836, -). Row 13: Law, 8, Stigma (2.25, 1.085, -), Isolation/Depression (3.21, 1.69, -), Glorification/Normalisation (2.71, 1.302, -).
Construct validity
Exploratory factor analysis (EFA)
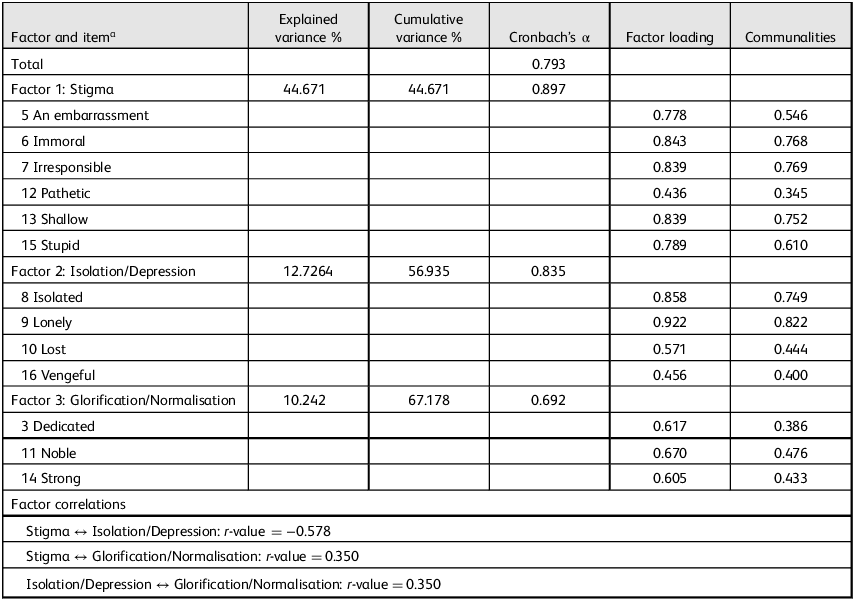
Principal axis factoring revealed good sampling adequacy on the Kaiser–Meyer–Olkin test (KMO = 0.854). The KMO value was above the recommended value of 0.60, indicating that the variables could be factorised. Of the 16 items in the translated instrument, 13 had communalities ≥0.20 (range: 0.345–0.822), indicating reasonable factorability (Table 2). Reference Comrey and Lee16 Furthermore, Bartlett’s test of sphericity showed p < 0.001 (less than 0.05), which also denoted that the factor analysis was acceptable.
Explained variance, factor loadings, communalities based on principal axis factoring analysis with oblimin rotation, and correlation of the Stigma of Suicide Scale-Short Form with its factors (n = 243)

Table 2 Long description
A table with 16 rows and 6 columns. The columns are labeled Factor and item, Explained variance percent, Cumulative variance percent, Cronbach’s alpha, Factor loading, and Communities. The table presents data on the explained variance, cumulative variance, Cronbach’s alpha values, factor loadings, and communalities for different items and factors. The factors include Stigma, Isolation/Depression, and Glorification/Normalisation. Each factor has multiple items listed with their respective values. The table also includes factor correlations with r-values.
a. The item numbers are those in the original 16-item Stigma of Suicide Scale-Short Form. Reference Batterham, Calear and Christensen14
Based on the factor loading, a 13-item version gave the best model fit, with a factor loading >40 and cumulative variance of 67.18%. Three of the original 16 items (‘Brave’, ‘Cowardly’ and ‘Disconnected’) were eliminated as they had a factor loading <0.4. Thus, the final version of the Malay SOSS-SF consists 13 items.
Based on the scree plot, the three-factor solution was preferred (Supplementary Fig. S2). On examining the scree plot, a clear break was observed after the third factor, indicating a three-factor solution.
We reassessed the 13-item version of adapted Malay SOSS-SF structure analysis using EFA. The second EFA yielded three factors with an eigenvalue >1.00 (Factor 1 Stigma = 5.807; Factor 2 Isolation/Depression = 1.594; Factor 3 Glorification/Normalisation = 1.332). These three factors accounted for 44.67, 12.26 and 10.24% respectively, with a total variance of 67.18% (Table 2). Based on the result, we determined that Factor 1 (Stigma) should consist of six items: items 12, 6, 15, 5, 7 and 13. In comparison, Factor 2 (Isolation or Depression) should consist of four items: 9, 8, 10 and 16. Last, Factor 3 (Glorification/Normalisation) should consist of three items: 3, 14 and 11. Correlations between factors indicated a moderate to low (0.35–0.578) association, indicating the existence of distinct stigma facets towards suicide. Based on the result, the three-factor structure was retained, supported by Kaiser’s criterion (eigenvalues ≥1), the scree plot and interpretability.
Measurement invariance
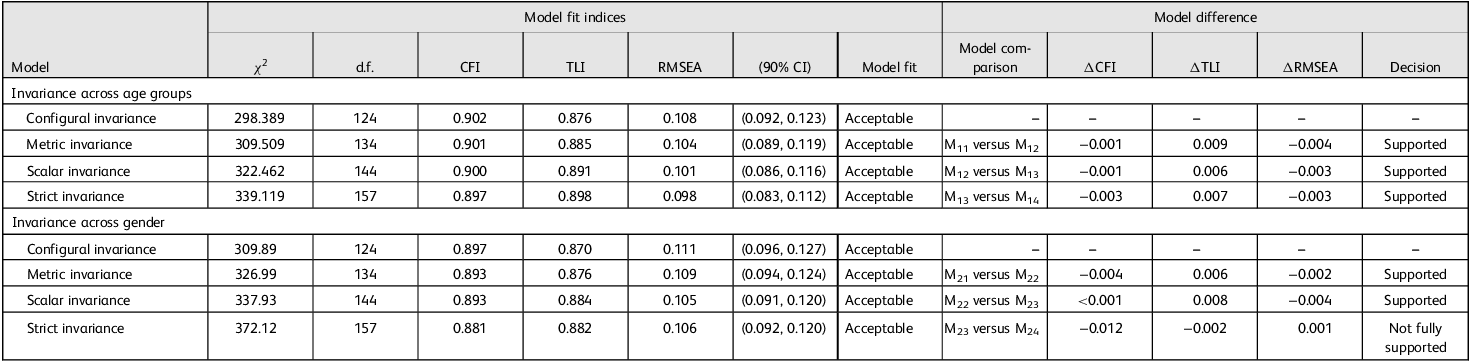
Table 3 shows the fit indices of the measurement invariance of the SOSS-SF across age groups and gender.
Measurement invariance test across age groups and gender

Table 3 Long description
A table with 8 rows and 14 columns comparing model fit indices and differences for invariance across age groups and gender. The table is divided into two sections: invariance across age groups and invariance across gender. Each section includes rows for configural invariance, metric invariance, scalar invariance, and strict invariance. Columns include chi-square (χ²), degrees of freedom (d.f.), CFI, TLI, RMSEA with 90% confidence intervals, model fit, model comparison, ΔCFI, ΔTLI, and ΔRMSEA. Each row provides specific values for these columns, indicating the fit indices and differences for each model. Notable trends include acceptable model fit across all models and supported decisions for most comparisons, with one instance of not fully supported decision.
CFI, comparative fit index; TLI, Tucker–Lewis index; RMSEA, root mean square error of approximation.
The configural invariance model had a good fit to the data across age groups (CFI = 0.902, TLI = 0.876, RMSEA = 0.108) and gender groups (CFI = 0.897, TLI = 0.87, RMSEA = 0.111). As a result, the evidence supports the presence of configural invariance.
Second, the metric invariance model was assessed by ensuring that the factor loadings were the same across age and gender groups. The model fitted the data well for age groups (CFI = 0.901, TLI = 0.885, RMSEA = 0.104) and gender groups (CFI = 0.893, TLI = 0.876, RMSEA = 0.109). The CFI, TLI and RMSEA differences for age groups between the configural and metric invariance models were 0.001, 0.009 and 0.004 respectively. For gender, the differences in CFI, TLI and RMSEA between the configural and metric invariance models were 0.004, 0.006 and 0.002 respectively. These changes for age groups and gender were all within acceptable ranges. Therefore, the metric invariance of the SOSS-SF questionnaire across age groups and gender was supported.
Third, the scalar invariance model proved the strength of the factors measured by the SOSS-SF questionnaire (factor loadings) and the starting points on the scale (observed variable intercepts) to be the same across age groups and genders. The analysis showed a good fit for age groups (CFI = 0.9, TLI = 0.891, RMSEA = 0.101) and gender groups (CFI = 0.893, TLI = 0.884, RMSEA = 0.105) compared with the metric invariance model. The differences in CFI, TLI and RMSEA for age groups between the metric invariance model and the scalar invariance model were 0.003, 0.007 and 0.003 respectively. For gender groups, the differences in CFI, TLI, and RMSEA between the two models were <0.001, 0.0088 and 0.004 respectively. These changes for age and gender groups were all within acceptable ranges. Therefore, the scalar invariance of the questionnaire across age and gender groups was supported.
Fourth, the strict invariance model examined the strength of the factors measured (factor loadings), the starting points on the scale (observed variable intercepts) and even how consistently people responded to the questions (error terms) to be the same across age and gender groups. The analysis continued to show a good fit to the data for age groups (CFI = 0.897, TLI = 0.898, RMSEA = 0.098) and gender (CFI = 0.881, TLI = 0.882, RMSEA = 0.106) compared with the previous model. The differences in CFI, TLI and RMSEA for age groups between the scalar invariance model and the strict invariance model were 0.003, 0.007 and 0.003 respectively. When the scalar and strict invariance models for gender groups were tested, the differences in CFI, TLI and RMSEA were 0.012, 0.002 and 0.001 respectively. The decline in the CFI exceeded thresholds, indicating that strict invariance was not fully supported. However, measurement invariance of the SOSS-SF across age and gender groups was supported by configural invariance, metric invariance and scalar invariance.
Discriminant validity
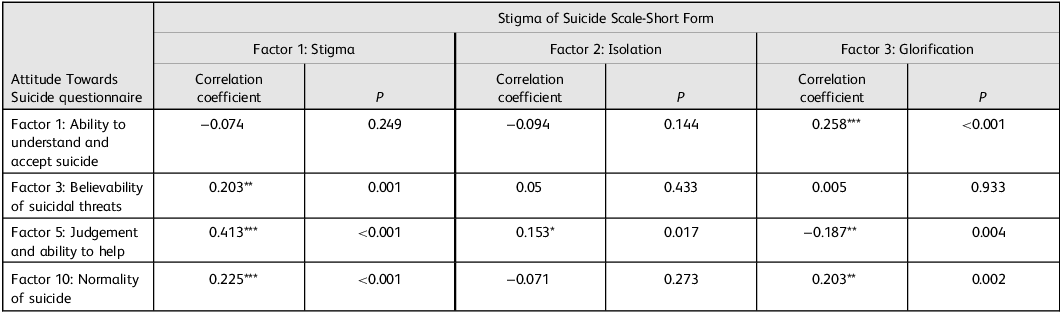
The SOSS-SF subscales showed adequate discriminant validity compared with the ATTS (Table 4).
Reliability analysis of the Malay versions of the Stigma of Suicide Scale-Short Form and the Attitude Towards Suicide questionnaire

Table 4 Long description
A table comparing factors of stigma, isolation, and glorification related to suicide. The table has four rows and three columns. The columns are labeled Factor 1: Stigma, Factor 2: Isolation, and Factor 3: Glorification. Each column contains correlation coefficients and P values for different factors. Row 1: Factor 1: Ability to understand and accept suicide, Correlation coefficient: -0.074, P: 0.249, Correlation coefficient: -0.094, P: 0.144, Correlation coefficient: 0.258***, P: <0.001. Row 2: Factor 3: Believability of suicidal threats, Correlation coefficient: 0.203**, P: 0.001, Correlation coefficient: 0.05, P: 0.433, Correlation coefficient: 0.005, P: 0.933. Row 3: Factor 5: Judgement and ability to help, Correlation coefficient: 0.413***, P: <0.001, Correlation coefficient: 0.153*, P: 0.017, Correlation coefficient: -0.187**, P: 0.004. Row 4: Factor 10: Normality of suicide, Correlation coefficient: 0.225***, P: <0.001, Correlation coefficient: -0.071, P: 0.273, Correlation coefficient: 0.203**, P: 0.002.
*Correlation is significant at the 0.05 level (2-tailed), p < 0.05.
**Correlation is significant at the 0.001 level (2-tailed).
***Correlation is significant at the <0.001 level (2-tailed).
Specifically, the SOSS-SF Stigma subscale was significantly associated with ATTS Factor 3 (Believability of suicidal threats), Factor 5 (Judgement and ability to help) and Factor 10 (Normality of suicide). The SOSS-SF Isolation/Depression subscale was associated with ATTS Factor 5 (Judgement and the ability to help). Although the SOSS-SF Glorification/Normalisation subscale had a significant association with the ATTS Factor 1 (Ability to understand and accept suicide) and Factor 10 (Normality of suicide), it had a negative association with ATTS Factor 5 (Judgement and ability to help). The correlations between the two instruments were small to moderate. For instance, the result indicated that the perceived ‘Normality of suicide’ in the ATTS was associated with the SOSS-SF subscales Stigma and Glorification, suggesting that the constructs are related yet conceptually distinct. Reference Hair, Anderson, Tatham and Black15
Reliability analysis
The Cronbach’s α values for the three domains ranged from 0.692 to 0.897. The overall internal consistency reliability coefficients of the overall adapted Malay version of SOSS-SF was acceptable, with a value of 0.793 (Table 2). Reliability scores >0.7 are considered acceptable and similar to the findings from Australia. Reference Batterham, Calear and Christensen14,Reference Tavakol and Dennick28
Discussion
The main objective of this study was to adapt, translate and validate the Malay version of the Stigma of Suicide Scale-Short Form (SOSS-SF) in Malaysia. As discussed, the Malay version of SOSS-SF demonstrated adequate validity in the sample. The study’s population and sample size were similar to the other studies that tested the psychometric properties of the SOSS-SF. For example, 160 university students participated in a Jordanian study Reference Aldalaykeh, Dalky, Shahrour and Rababa6 and a Chinese validation study involved 224 university students. Reference Han, Batterham, Calear, Wu, Shou and van Spijker18
The influence of cultural factors on interpretation of SOSS-SF items
Despite many studies attempting to validate translations of the SOSS-SF, there were variations in the factors and item loadings derived from each study. For example, the Bangla SOSS-B version consists of 13 items. Three items in the original version (embarrassment, pathetic and shallow) were removed. Reference Arafat, Hussain, Hossain, Islam and Menon19 The Chinese SOSS-SF dropped four items (irresponsible, disconnected, pathetic and cowardly) because of the poor loading in the stigma factor. Reference Han, Batterham, Calear, Wu, Shou and van Spijker18 For the Nepalese SOSS-SF, five items were removed: ‘an embarrassment’, ‘vengeful’, ‘pathetic’, ‘disconnected’ and ‘dedicated’. Reference Gupta, Sharma, Sah, Sharma, Jha and Chapagai21 This suggests that cultural aspects may influence how individuals interpret the SOSS items; notably, stigma towards suicide survivors might differ depending on subcultural variations. Reference Kheibari, Szechy, Cerel and Fruhbauerova32
In our study, three items – ‘cowardly’, ‘brave’ and ‘disconnected’ – were removed because of low factor loading. The item ‘cowardly’ was similarly dropped in the Chinese version, Reference Han, Batterham, Calear, Wu, Shou and van Spijker18 and a literature review reported that Malaysian respondents described those who attempted suicide as ‘cowards’. Reference Snowdon33 The item ‘brave’ was removed because suicide is sometimes perceived to be honourable in Asia. Reference Chua, Chong, Chee Lee, Kharbanda, Ren and Pinheiro-Mehta34 The low factor loading for the item ‘disconnected’ was consistent with the findings from China, Hong Kong and Nepal. Reference Han, Batterham, Calear, Wu, Shou and van Spijker18,Reference Fong, Yip, Chan and Ho20,Reference Gupta, Sharma, Sah, Sharma, Jha and Chapagai21 This suggests that suicidal behaviour in Malaysia may be associated with a sense of disconnection from society. Reference Lyndon, Azman, Che Rose and Mat Jali35 From a religious perspective, suicidal behaviour can also reflect a disconnection with religious beliefs. Reference Lehmann, Leung, Miller and Girguis36 One possible explanation for the poor factor loading observed for the item ‘disconnected’ is that within the Malaysian cultural context, the term may have been interpreted differently by current study participants, which may be contributing to its poor factor loading.
The three-factor solution
Similar to studies from Bangladesh and China, this study’s results yielded a three-factor solution consistent with the original version established by Batterham et al. Reference Batterham, Calear and Christensen14,Reference Han, Batterham, Calear, Wu, Shou and van Spijker18,Reference Arafat, Hussain, Hossain, Islam and Menon19 The consistency of this result across different cultural samples in Asia may serve as evidence for the reliability of the SOSS-SF, except for the study in Hong Kong. Reference Fong, Yip, Chan and Ho20 In terms of the subdomains, the validated Malay SOSS-SF was derived from three factors – Factor 1, Stigma; Factor 2, Isolation or depression; and Factor 3, Glorification or normalisation – echoing the original study. Reference Batterham, Calear and Christensen14 In comparison, the Hong Kong SOSS-SF consists of four factors, with an additional factor, ‘Disgrace’, and the ‘Stigma’ factor replaced by ‘Selfishness’. Reference Fong, Yip, Chan and Ho20
Measurement invariance
The measurement invariance of the Malay SOSS-SF was assessed across gender and age groups, with multiple-group confirmatory factor analysis conducted. Consistent with Williams et al Reference Williams, Cero, Gauthier and Witte37 and Fong et al, Reference Fong, Yip, Chan and Ho20 the SOSS-SF demonstrated scalar invariance across gender and age groups and reported no difference in the factor loadings and threshold for the items. Notably, our RMSEA values ranged from 0.10 to 0.11, exceeding the common threshold of 0.06. We speculate that cultural factors and suicide stigma might have influenced this result, which is consistent witht the findings of Davidov et al. Reference Davidov, Meuleman, Cieciuch, Schmidt and Billiet38 The stigma surrounding suicide, together with cultural diversity, may lead participants to interpret the suicide-related items differently. Such variation in interpretation may contribute to difficulties in meeting the criteria for strict measurement invariance. Reference Davidov, Meuleman, Cieciuch, Schmidt and Billiet38,Reference Chen39
This measurement invariance also suggests that the SOSS-SF serves as a valuable comparison of the structural parameters of stigma across different demographic subgroups. The SOSS-SF factors reported similar variances and covariances across the different demographic subgroups. However, male respondents in the stigmatisation subscale scored higher than females. This finding is consistent with studies in Bangladesh. Reference Arafat, Hussain, Hossain, Islam and Menon19
Group comparisons and subscale findings
Additionally, previous studies have reported that students from medicine and psychology faculties exhibit lower stigmatisation scores than students in other faculties. Our observations aligned with these findings. Reference Batterham, Calear and Christensen14,Reference Fong, Yip, Chan and Ho20 However, an unexpected pattern emerged, as respondents from the Faculty of Law also reported lower stigmatisation than students in other faculties.
The Isolation/Depression subscale had the highest approval rate among the three subscales in the SOSS-SF, indicating that Malaysian students associate suicide with isolation and glorification more than stigma. This finding aligns with the studies conducted in Australia and Bangladesh, Reference Batterham, Calear and Christensen14,Reference Arafat, Hussain, Hossain, Islam and Menon19 which indicated that the Isolation/Depression subscale had the highest mean score and differed from the Spanish and the Chinese findings, Reference Han, Batterham, Calear, Wu, Shou and van Spijker18,Reference Collado, Martínez, Cangas and Trigueros40 in which the stigma subscale was higher than other subscales. However, these findings provide valuable insights for researchers to conduct in-depth studies on stigma towards suicide rather than attributing the differences solely to collectivist, religious, Asian or Western cultural influences. Nevertheless, it is essential to acknowledge that direct comparisons with other Asian countries may not be suitable. The distinctive culture and diverse religions in Malaysia may affect their stigma towards suicidal individuals. Reference Foo, Mohd, Muhd, Ismail, Ibrahim and Jamil Osman41,Reference Bahar, Ismail, Hussain, Haniff, Bujang and Hamid42
Reliability
Cronbach’s α coefficient (α = 0.793) showed that the Malay version of the SOSS-SF had acceptable reliability. These results replicate the original study’s findings, where the Australian version reported α > 0.70. In that study, the correlation coefficients of the item scale ranged between 0.6 and 0.8. Reference Batterham, Calear and Christensen14 This finding also coincides with previous studies on the Arabic and Chinese versions. Reference Aldalaykeh, Dalky, Shahrour and Rababa6,Reference Han, Batterham, Calear, Wu, Shou and van Spijker18
Implications
Validating the Malay SOSS-SF has significance in furthering suicide stigma research in Malaysia. This is because conducting comprehensive research to examine how stigmatising attitudes towards suicide emerge and to what extent cultural differences contribute to stigma may inform intervention programmes to reduce stigma towards suicide.
Limitations
This study has several limitations. The sample of university students does not reflect the diversity of Malaysia’s population. In addition, data collection was conducted in an urban area using a convenience sampling method, thus introducing bias. Although existing literature reviews had explored the stigma surrounding suicide, the studies focused on cultural and religious factors rather than on rural populations and age groups, leaving scope for future research to conduct substantial studies in this area. Reference Chua, Chong, Chee Lee, Kharbanda, Ren and Pinheiro-Mehta34 Next, the proportion or ratio of female to male respondents and programmes in this study did not reflect the Malaysian university student population. Finally, data collection was conducted at universities, and the results regarding the psychometric properties would be more applicable to highly educated individuals rather than the general population. Future studies should be conducted among a representative sample of Malaysians.
Supplementary material
The supplementary material is available online at https://doi.org/10.1192/bji.2026.10132
Data availability
The data that support the findings of this study are available from the corresponding author on reasonable request.
Acknowledgements
During the preparation of this manuscript, the authors_used ChatGPT (GPT-5.6 Luna) to improve the readability and language editing of the results and discussion sections. ChatGPT was not used to conduct the statistical analyses, generate or modify data, or generate manuscript text. All analytical decisions, interpretations and final manuscript content were reviewed and verified by the authors.
Author contributions
Conceptualisation, K.Y.W., N.I. and C.S.S.; methodology, K.Y.W., N.I. and C.S.S.; software, K.Y.W.; formal analysis, K.Y.W.; investigation, K.Y.W. and N.I.; data curation, K.Y.W.; writing – original draft preparation, K.Y.W., N.I. and C.S.S.; writing – review and editing, N.I. and C.S.S.; supervision, N.I. and C.S.S.; All authors have read and agreed to the published version of the manuscript.
Funding
This research received no specific grant from any funding agency, commercial or not-for-profit sectors.
Declaration of interest
None.


 Open access


eLetters
No eLetters have been published for this article.