Introduction
Conventional agriculture was not traditionally associated with conservation and sustainable resource management. This has resulted in escalating environmental degradation and growing social realization that current agricultural systems must develop strict environmental standards rather than prioritizing on economic returns. As a result, there is much emphasis on alternative farming systems designed to decrease environmental harm caused by conventional farmingReference Pacini, Wossink, Giesen, Vazzana and Huirne1.
Currently, a great body of literature exists on the quantification of environmental impacts and sustainability of conventional and alternative agricultural production systemsReference Pacini, Wossink, Giesen, Vazzana and Huirne1–Reference Van Passel, Nevens, Mathijs and Van Huylenbroeck6. System environmental performance is difficult, if not impossible, to evaluate directly because of various constraints. Studies generally assess system performance using a pre-chosen set of related indicators that are easily measured. Several indicators are preferred because of their sensitivity to change as a function of time and land management. Indicator selection criteria, proper methodologies and validations have also been widely addressedReference Bockstaller, Guichard, Makowski, Aveline, Girardin and Plantureux7. Individual indicators often do not provide an exhaustive vision of reality or complete information on the environmental risk of a system, as they tend to concentrate on a single criterion. Therefore, assessment results will likely be biased when limited criteria are used. Many researchers propose the use of multiple indicator measurements for a valid assessmentReference Parra-Lopez, Calatrava-Requena and De-Haro-Gimenez3, Reference Van Calker, Berentsen, Romero, Giesen and Huirne5, Reference Van Passel, Nevens, Mathijs and Van Huylenbroeck6, Reference Jollands, Lermit and Patterosn8.
The criteria for indicator selection cover a broad range of aspects that are not all equally achievable. Nevertheless, most researchers agree that an indicator should be scientifically founded, easy to interpret, responsive to changes related to human activities and able to show trends over timeReference Bockstaller and Girardin9–Reference Von Wiren-Lehr12. It should also provide a representative picture of reality and be measurable at a reasonable benefit–cost ratio. Furthermore, an indicator may be meaningful only if a reference or target value exists based on empirical evidenceReference Rigby, Howlett and Woodhouse13. Such a value should always be determined in the context of a current problem or situation. Indicators could be developed at the plot, field, farm, village, community, watershed, regional or national level. The level at which indicators should be applied depends on the problem and on data availability.
The objective of this study was to test an assessment that integrates multiple factors into single score of environmental risk and to employ a web-graph to display and interpret system differences.
Materials and Methods
This study used data collected from experimental plots of a long-term systems study, the Farming Systems Research Unit (FSRU) (Fig. 1), at the Center for Environmental Farming Systems (CEFS), Goldsboro, North Carolina. CEFS, established in 1994, is a partnership between the North Carolina Department of Agriculture and Consumer Services, North Carolina State University and North Carolina A&T State University. The center is dedicated to research on farming systems that are environmentally, economically and socially sustainable. FSRU addresses various issues relevant to long-term agricultural sustainability in North Carolina.
Experimental layout of the Farming Systems Research Unit study at the CEFS, Goldsboro, NC.

The FSRU experiment
FSRU is an 81-ha long-term field experiment with five systems and three replications (Fig. 1). Systems are conventional best management practices including conventional tillage (BMP/CT) and no-tillage (BMP/NT), a certified organic system (COS), an integrated crop–animal system (CAS), a successional (abandoned agronomic field) system (SUS) and a plantation forestry system (PFS). Experimental plots vary in size from 1.2 to 3.8 ha, depending on the landscape and the size of the block replicate. Soils have been intensively mapped and digitized using GPS and GIS, and sampling was done on the ‘diagnostic’ soil type of each block to minimize soil type variability. Mueller et al.Reference Mueller, Barbercheck, Bell, Brownie, Creamer, Hitt, Hu, King, Linker, Louws, Marlow, Marra, Raczkowski, Susko and Wagger14 provide a full description of FSRU.
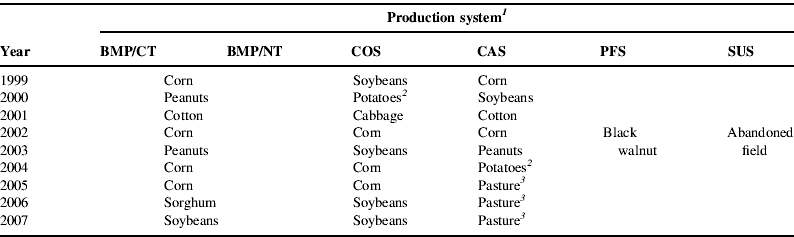
Table 1 lists vegetation grown in each system since FSRU began in 1998. The two BMP systems predominate among farmers in the area, representing a standard for comparison. They are characterized by management practices commonly used by regional growers, such as annual crops and short rotations. Crops are regularly scouted for pests, and pesticides are applied only when economically justified. CAS represents a 15-year rotation of crops and livestock, mainly dairy steers. COS employs unique experimental approaches to nutrient management and pest control and provides critical information that helps growers' transition into organic production. Appropriate sivicultural practices are used in PFS under the production of black walnut (Juglans nigra L.). SUS represents an abandoned agronomic field allowed to succeed naturally since 1998. It serves as a control for the evaluation of farming effects.
Vegetation grown in each system from 1999 through 2007 at the Farming Systems Research Unit at the Center for Environmental Farming Systems (CEFS), Goldsboro, NC.
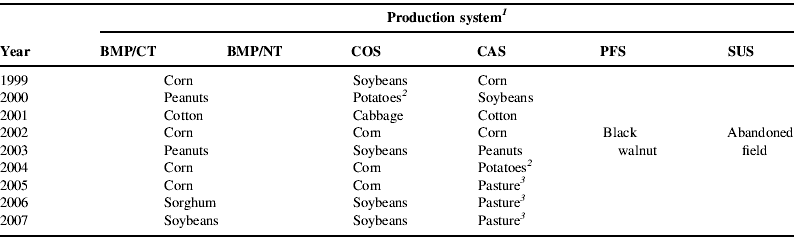
1 BMP/CT, best management practice–conventional tillage; BMP/NT, best management practice–no-tillage; COS, certified organic system; CAS, integrated crop–animal system; PFS, plantation forest system; SUS, successional system.
2 Sweet potatoes.
3 Warm-season switchgrass (Panicum virgatum), big bluestem (Andropogon geradii), eastern gamagrass (Tripsum dactyloides) and cool-season tall fescue (Festuca arundinacea).
Indicators framework
Knowledge of potential effectors will determine a suitable set of indicators and therefore increases assessment reliability. For example, an assessment that includes nutrient movement below the root zone needs to consider multiple variables including fertilizer type, rate and type of tillage practice used. In general, a multiple indicators approach needs to be implemented for an unbiased assessment.
Although this study focused on system environmental impact risks, we also determined yield index values to assess system productivity. The environmental impact risk assessment was based on soil quality status, amount of pesticide and fertilizer and tillage intensity. While many studies of this nature assessed single systems from different fields, our study was conducted on a single field having a large-scale, long-term, replicated experiment with very diverse systems. The final approach of the assessment was to integrate indicators and graphically delineate the overall system risk.
Crop yield
Because system crop rotations differed, a normalization procedure was done to compare yield data. In years where at least two systems had the same crop, we divided each yield measurement by the highest crop yield observed in the same year. The calculated ratios, ranging from 0 to 1, were used as productivity index values and allowed for system comparisons.
Soil quality
The soil management assessment framework (SMAF) developed by Andrews et al.Reference Andrews, Karlen and Cambardella15 was used to assess soil quality. SMAF uses a system of decision rules to identify a set of soil properties as soil quality indicators. It allows selection of specific indicators based on the primary management goal for each specific site, and makes adjustments for climate, crop rotation, tillage practices, assessment purpose and inherent soil properties. Soil properties are transformed into unitless scores based on site-specific algorithmic relationships to soil functions. Finally, scores are averaged to produce a single index of soil quality.
Soil physical, chemical and biological properties measured in fall 2007 were used in SMAF. Properties were available water holding capacity (AWHC), soil bulk density (Db), aggregate stability (AS), soil pH, soil phosphorus (soil P), total organic carbon (TOC), microbial biomass carbon (MBC), soil metabolic quotient (qCO2) and potentially mineralizable nitrogen (PMN). These properties were measured from soil core samples collected from the upper 7.6 cm in the five geo-referenced sampling points within the diagnostic soil of each experimental plot. For AWHC, undisturbed cores (7.6 cm in diameter, 7.6 cm in length) were slowly water saturated, placed in a low-pressure outflow systemReference Klute and Klute16 and desorbed to soil water potential of −10 KPa to determine field capacity. Bulk soil samples collected adjacent to the soil cores were desorbed in a high pressure outflow system to a soil water potential of −1500 KPa to determine permanent wilting point. Cores were then oven dried at 105°C to determine bulk densityReference Grossman, Reinsch, Dane and Topp17. AS was measured using the wet sieving procedureReference Nimmo, Perkins, Dane and Topp18 on air-dried aggregates of size 2.00–4.75 mm in diameter. Soil P was measured using the Mehlich-3 extraction method and pH using a 2:1 soil:water ratio. For MBC, field moist soil was sieved through a 3-mm sieve, immediately stored in sealed plastic bags at 4°C and within 1 week of sampling the chloroform fumigation-direct extraction procedureReference Vance, Brookes and Jenkinson19 was used. Total carbon was measured by combustion using a Perkin-Elmer 2400 CHN analyzer (Perkin-Elmer Corp., Norwalk, Conn.). PMN was determined using the anaerobic incubation methodReference Drinkwater, Cambardella, Reeder, Rice, Doran and Jones20. Soil respiration measurements were made at each geo-referenced sampling point using the closed-chamber techniqueReference Parkin, Doran, Franco-Vizcaino, Doran and Jones21 and used to determine qCO2; the proportion of soil respiration and MBC.
Analysis of variance was conducted on the soil property data and on property score values to test for system differences. The pair comparison test used was Fisher's protected least significant difference. Results from the analysis of variance and pair comparison tests were interpreted at the 5% level of probability.
Pesticides
Pesticide risk assessment is complex because of the multidimensional nature of pesticide impacts. Pesticides are strictly regulated in the United States through a complex system that leads to product registration and regulations. During the registration process, the US Environmental Protection Agency (EPA) evaluates general, technical and safety information to approve product label and Material Safety Data Sheet (MSDS). The label and MSDS follow established uniform standards for describing potential risks and were used as our risk information source.
Product impact on water resources focuses on leaching and runoff losses, both determined by pesticide persistence, water solubility and mobility. Pesticide LD50 is the material dosage that would result in the death of 50% of a population of test species under standard conditions. Expressed as milligrams per kilogram of body weight it represents the acute effects of solids and liquids that are swallowed or affect the skin. We applied a measure proposed by Nelson and BullockReference Nelson and Bullock22, the number of LD50 doses applied per hectare, to represent a level of pesticide acute human risk.
The pesticide Groundwater Ubiquity Score (GUS) was used to assess pesticide groundwater pollution risksReference Gustafson23. Based on a pesticide's half-life and soil adsorption potential, GUS is determined as

where K oc is a measure of soil adsorption of the pesticide, a high value indicating strong adsorption, therefore leaching is less likely. Pesticide half-life in soil (t 1/2), expressed in days, is the time necessary for transformation or degradation to one-half its previous concentration. It varies depending on soil moisture, temperature, oxygen status, microbial population, soil pH and other factorsReference Becker, Herzfeld, Ostlie and Stamm-Kativich24. A GUS value of 2.8 or greater indicates high leaching potential, between 1.8 and 2.8 a moderate potential and less than 1.8 a low potential.
Fertilizer
Fertilizer N and P can have adverse environmental effects when excessively applied. For example, excessive N and P losses can result in the euthrophication of surface and coastal watersReference Sullivan25. Our assessment rationale for fertilizer use was based on the amount of fertilizer N and P applied; i.e., less of an environmental impact as fertilizer N and P use is reduced. Fertilizer indicator values were determined as the average amount (kg ha−1) of fertilizer N and P used in each system across all years (1999–2007).
Tillage
While tillage is required in some production systems, its effects on soil could be counterproductive. It reduces crop residue surface cover and thus increases aggregate breakdown, resulting in crusting and reduced infiltrationReference Cassel and Raczkowski26. Conversely, conservation tillage systems, systems with tillage practices that leave 30% or more of the soil surface covered by crop residues at planting, can increase soil organic matter content, improve soil quality, increase rainfall capture and reduce runoffReference Franzluebbers, Langdale and Schomberg27–Reference Raczkowski, Reyes, Reddy, Buscher and Bauer29. Tillage indicator values were determined as the average number of tillage operations (e.g., plowing, chiseling, disking and cultivating) across years.
Determination and integration of index values
As mentioned previously, soil quality index values were determined by SMAF as the average of all soil property scores. For pesticides, fertilizers and tillage, indicator values were normalized using the procedure of Diaz-Balteiro and RomeroReference Diaz-Balteiro and Romero30 to produce aggregated index values. In general, the normalization used was
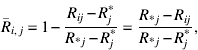
where  is the normalized value of system ith when evaluated with indicator jth, Rj* is the best observed (ideal) value of indicator jth, Ri j is the outcome of system ith when evaluated with indicator jth before normalization and R *j is the worst observed value achieved by indicator jth. In general, normalized indicator values are bounded between 0 and 1 with 1 being the ‘ideal’ situation and ‘lesser than ideal’ as the value becomes lower than 1. Aggregated index values for pesticides and fertilizers were calculated as the average of individual normalized pesticide and fertilizer indicators.
A web graphReference Gomiero and Giampietro31, Reference Krajnc and Glavic32 was used to integrate all index values and delineate the overall risk in each system. Graph axes represent individual integrated risk indices. The external web of the graph represents the optimal condition for all indices. In other words, a system has less of an overall environmental risk as its web spreads more toward the outer boundary of the graph.
Results
Soil quality
No differences in soil properties were found between systems with the data collected when the study began in 1998 (baseline data – not shown). We point out that the soil quality differences presented with the data collected in fall 2007 are differences that developed over a period of 9 years. The differences observed during the first few years may not have been as large. Also, with one assessment date available, it is difficult to speculate how soil quality conditions changed over the study period.
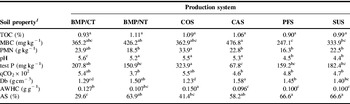
System differences were found for all soil properties except for TOC (Table 2). MBC was highest in BMP/NT, CAS COS and BMP/CT and lowest in PFS and SUS. The qCO2, which reflects the intensity of organic matter decomposition, was highest in COC and BMP/CT and lowest in BMP/NT. The higher decomposition activity in COS and BMP/CT was likely due to the increase availability of organic matter sources like crop residues and organic fertilizer, which were tilled into the soil. Residues in the other four systems predominate at the soil surface and therefore decompose at a slower rate. Soil P and PMN followed the same system trend as qCO2. The greater PMN in COS and BMP/CT indicates greater availability of organic N for microbial use, which also explains the greater decomposition activity.
Soil properties measured in 2007 from the upper 7.5 cm in each production system.

1 For each soil property, production system means having the same letter in common are not significantly different at the 5% level of significance as indicated by Fisher's Protected LSD test. TOC, total organic carbon; MBC, microbial biomass carbon; PMN, potential mineralizable nitrogen; test P, extractable phosphorus; qCO2, metabolic quotient; Db, soil bulk density; AWHC, available water holding capacity; AS, aggregate stability.
Soil pH values were higher in the four agronomic systems (COS, BMP/CT, BMP/NT and CAS) and lowest in the two non-agronomic systems PFS and SUS. These differences are likely related to differences in organic matter dynamics and microbial activities. The highly diverse group of broadleaf plants and grasses that grow in SUS produce large plant biomass and thatch residue amounts. During the decomposition of this material acid, functional groups are released from which H+ ions dissociate. Also, the carbonic acid released from microbial respiration accumulates with time acidifying the soil. In addition, grasses in these two systems with their massive root system likely produced a significant amount of carbonic acid from root respiration.
Soil bulk density was lowest in the tilled COS and BMP/CT systems and highest in the untilled CAS and BMP/NT systems. The higher Db in the untilled systems developed naturally by the settling and consolidation of soil. The baseline Db measured when the study began in 1998 was 1.36 g cm−3.
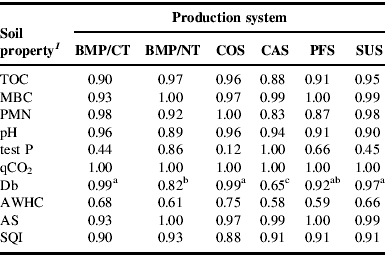
Overall score values for TOC, MBC, PMN, pH, qCO2 and AS were mostly greater than 0.90 indicating that in each system these properties were adequate (Table 3). Lower score values and system differences were obtained for soil P, Db and AWHC. The score values of 0.12 for COS and 0.44 for BMP/CT indicate excessive soil P levels. For Db, the lowest score value was obtained with CAS, the system with the highest bulk density of 1.58 g cm−3. Studies have found that for the type of soils found at the study site, sandy loam to loamy sands, a bulk density of 1.60 g cm−3 or greater will limit root growthReference Jones33, Reference Vepraskas34.
Soil property scores and soil quality index (SQI) obtained with the soil management assessment framework (SMAF) using the 2007 soil property data.
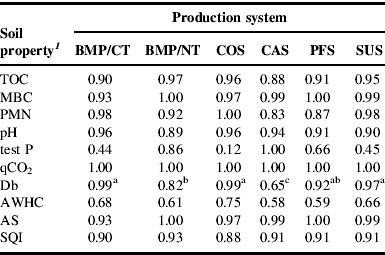
1 For Db, production system means having the same letter in common are not significantly different at the 5% level of significance as indicated by Fisher's Protected LSD test. No system differences were found for other soil property scores.
Pesticides
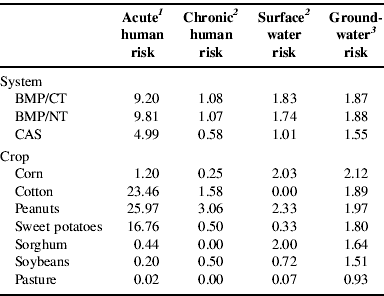
Results from the pesticide assessment are presented in Table 4. The system data are means across years and crops while the crop data are means across years when that specific crop was planted. No pesticides were applied in COS, SUS and PFS; therefore, pesticide indicator values equal zero. The two BMP systems had the highest values of all indicators. The CAS system resulted in somewhat lower risks because no pesticides were added in pasture years (2005–2007).
Pesticide risk indicator values for each production system averaged across crops and for each crop averaged across systems. For each pesticide risk factor, the higher the indicator value, the higher the risk.
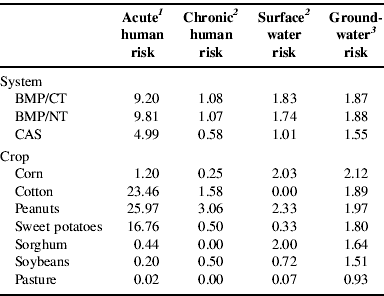
1 Acute human risk is a sum of LD50 doses (the presented values are in 1000 doses) from all pesticides applied per year.
2 Chronic human and surface water risks are measured as the number of pesticides with high risk applied per year.
3 Groundwater risk is an average GUS of pesticides applied per year.
For the crops considered, the acute human risk was highest for cotton and peanuts, the chronic human risk was highest for peanuts, the surface water risk was highest for corn and peanuts. The groundwater risk was moderate for most crops except for soybeans and pasture which had low values of risk.
Fertilizer
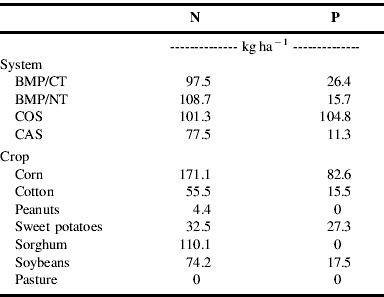
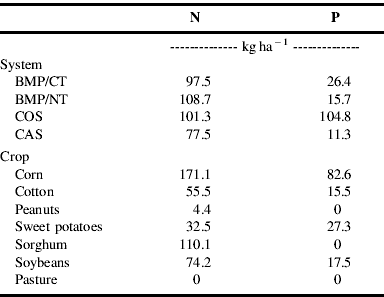
SUS and PFS are not listed in Table 5 since no fertilizers were added in these systems. In COS, turkey litter was used as source of fertilizer while commercial fertilizers were used in the two BMP systems and in CAS. The two BMP systems and COS received the most N while COS received the most P. Therefore, CAS has a lower N risk while all systems except COS have low P risks. The amount of turkey litter applied that met crop N requirements in COS resulted in excess P applications. The N risk was highest with corn and sorghum and the P risk was highest with corn.
Fertilizer risk indicators as amount (kg) of fertilizer N and P applied per hectare in each system (averaged across crops) and in each crop (averaged across systems).
Tillage
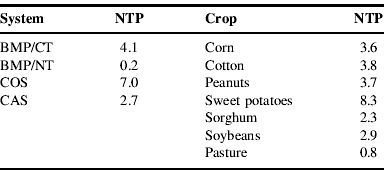
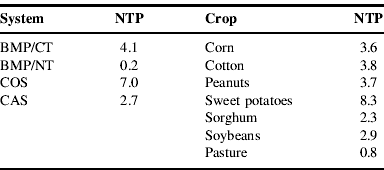
The tillage indicator value was highest in COS and lowest in BMP/NT (Table 6). A post harvest pass with a disk unit was done in BMP/NT during peanuts years (2000 and 2003) resulting in the 0.2 indicator value. More tillage was done in COS because of its requirements of primary tillage (chisel plowing), secondary tillage (disking), creation of raised beds during cabbage and sweet potato years and cultivation for weed control. Tillage in BMP/CT and in CAS each year consisted of chisel plowing followed by disking several times until a smooth seedbed was achieved. The indicator value was lower in CAS because no tillage operations were conducted during pasture years.
Tillage risk indicators as the number of tillage practices (NTP) performed in each system (averaged across crops) and in each crop (averaged across systems).
Index values
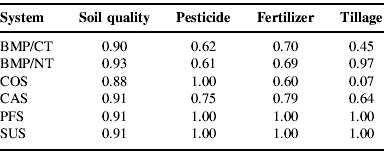
Resulting index values are shown in Table 7. Soil quality index values did not differ between systems, averaging 0.91. This high value indicates that, based on the soil properties considered in the assessment, the overall soil quality in each system was adequate. This does not mean that all soil properties in each system were within the ‘ideal’ range. As discussed earlier, some system properties were less than ideal and others were adequate with varying trends between systems. However, the average of property scores produced similar system soil quality index values and reflected adequate soil quality overall.
Environmental impact risk index values for each assessment factor in each production system.
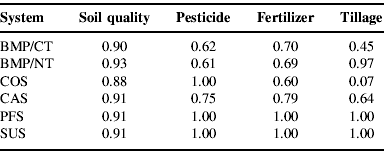
Pesticide index values were slightly lower in the two BMP systems compared with CAS where less pesticide was used. More fertilizer was used in COS and less in CAS as reflected by the respective index values of 0.60 and 0.79, but unlike in other systems, no commercial fertilizers were used in COS. The more tillage practices used in COS resulted in an index value of 0.07, while BMP/NT resulted in the highest 0.97 value.
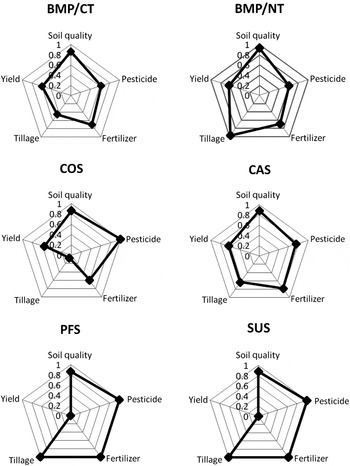
The web graph (Fig. 2) illustrates individual risk indices and the overall multi-index assessment for each system. The tillage risk was highest with COS and BMP/CT, pesticide risk with the two BMP's, fertilizer risk with COS and no risk was associated with the soil quality factor. The two systems with the smallest web were COS and BMP/CT. Hence, the highest overall environmental impact risks are associated with these two systems. Conversely, there are lower risks with PFS and SUS, the two systems having the largest web. The two agronomic production systems with the lowest potential impact were web portrayed by BMP/NT and CAS. As illustrated in the graph, the productivity among systems was similar.
Web-graphed environmental impact risk index values for each system. BMP/CT, best management practice–conventional tillage; BMP/NT, best management practice–no-tillage; COS, certified organic system; CAS, integrated crop–animal system; PFS, plantation forest system; SUS, successional system.

Discussion
We used a multi-factor approach to assess the potential environmental impact risk of six systems: five production systems (four agronomic and one planted trees) and a successional system or abandoned agronomic field. The assessment outcome is based on agronomic practices used and resulting soil conditions. For an overall system assessment, individual indicators are averaged into a single index value and a web graph is constructed. The major advantage of a web graph is that the overall system impact risk can be easily interpreted by the size of the web where the individual factor index values are also presented.
The assessment identified COS and BMP/CT as the two systems with the highest environmental risk mostly because they had the highest use of fertilizers and tillage. This does not imply that these two systems are environmentally unsound, but that potential risk factors need to be well managed to avoid adverse environmental effects. For example, when poultry litter is used as the nutrient source in the COS system its application rates are based on the nitrogen needs of the crop, but poultry litter also contains large amounts of P. Since crop P requirements are lower, an overapplication and build-up of P results. Therefore, the fertilizer guidelines for organic systems should be reconsidered to reduce P buildup. Equally, a positive assessment does not imply that the system is environmentally sound. BMP/NT and CAS were characterized as low-risk relative to the agronomic practices considered, but they could be environmentally unsound due to other factors. For instance, the consolidated soil condition in the pastured CAS, as indicated by the high bulk density, may limit infiltration and therefore increase the potential for fertilizer runoff.
The soil quality assessment in this study included measurements of physical, chemical and biological properties that reflect the status of multiple soil functions affecting productivity and environmental health. However, because SMAF is limited to the use of 11 soil properties, we were unable to make the assessment using specific properties that relate to limited functions in the coarse-textured soils of the Atlantic Coastal Plains region. For instance, these soils have low nutrient retention due to low clay and low organic matter contents. Hence, humic matter and CEC would be good indicators of nutrient retention and of the potential risk for nutrient movement below the root zone. Unwanted soil conditions like compacted soil zones that restrict crop rooting and water movement also develop due to poor soil management. A standard measurement that identifies this condition would also make the assessment more resourceful.
Five of the soil properties, TOC, MBC, soil P, PMN and AWHC, are used in SMAF on a weight basis rather than on a volume basis. Because Db changes as a function of soil management, the content of these measurements on a per soil volume basis will also change. This has been addressed in other studies and interpretation errors of 7–14% have been made when using soil data on a per weight basisReference Bell and Raczkowski35.
The tillage assessment component can be improved by including measurements or estimations of surface crop residue cover which influences soil processes. As it is, two systems each with two tillage operations per year will have the same tillage index value regardless of the amount of surface residue left post tillage. One would expect more benefits in a system with significant surface residue cover (e.g., a conservation tillage system) compared with a system with no residue cover (e.g., a conventional tillage system).
The fertilizer factor can also be improved by adding an availability component. Fertilizer availability varies with chemical composition, fertilizer type (organic versus inorganic), release activity (slow versus fast) and application methods (split, banded, etc.). In general, fertilizer rates may be high for some systems but the environmental risk can be low if the above factors are considered in an effective management scheme.
Conclusions
Our approach to assess the potential environmental impact risk of integrated system production practices and resulting soil conditions was relatively simple and useful. For soil quality, SMAF is user-friendly and many soil properties used are relatively easy to sample and measure. The normalization and conversion procedures used on fertilizer, pesticide, tillage and yield scores were also simple. The display of integrated indicators in a web graph gives a clear system performance overview and includes individual index values for system comparisons.
The methods used in this study can, to a certain degree, assist in the assessment of environmental impact risks of implemented agronomic practices. We recognized that for a more complete assessment additional environmental performance indicators need to be included and the indicators used can be improved. We would also like to point out that aggregated index values for soil quality, pesticides and fertilizers were calculated as the average of individual normalized indicators. Such an approach is informative about the general environmental impact trends, but with different set of relative weights assigned to individual indicators, aggregated results could vary. Indicator aggregation into some composite indices still remains a fruitful area for future research.
In addition, comprehensive assessments of this type should include economic and social indicators that would broaden the understanding of growers and determine any trade-offs between these indicators and environmental responsibility. Lastly, a comprehensive study should assess systems over time to account for the temporal variations of the highly dynamic indicators used. In general, we conclude that this assessment, with further development and the inclusion of additional indicators, can be a resourceful tool to promote agricultural sustainability and environmental stewardship and to assist policy-making processes.