


I. Introduction
Wine grape production in California supports over 3,500 wineries, which account for 90% of U.S. wine production and capture a 61% share of the U.S. wine market. Additionally, the wine industry contributes $61.5 billion to the California economy and supports 330,000 jobs in the state (Wine Institute, 2012). Wine grapes are the second most valuable crop in California and account for 7.5% of the value of crop production in the state. This represents an important contribution in a state that produces nearly half of all U.S. fruits, vegetables, and nuts (CDFA, 2012a). The importance of wine grape production in California and the high value of the fruit imply that pest control practices or pest damage likely have large impacts on growers and the value of total production.
Fruit loss to birds is a costly problem for producers of many agricultural commodities (Anderson et al., Reference Anderson, Lindell, Moxcey, Siemer, Linz, Curtis, Carroll, Burrows, Boulanger, Steensma and Shwiff2013). In addition to fruit consumption, birds can damage fruit, leading to increased susceptibility to other pests and pathogens and reduced product quality (Duffy and Schaffner, Reference Duffy and Schaffner2002; Holb and Scherm, Reference Holb and Scherm2008; Pritts, Reference Pritts2001). The economics of bird damage to fruit crops has received relatively little research attention compared to other agricultural pest problems (Gebhardt et al., Reference Gebhardt, Anderson, Kirkpatrick and Shwiff2011), and only a few studies have specifically addressed the economics of bird damage in wine grape production. Boyce et al. (Reference Boyce, Meister and Lang1999) conducted a cost–benefit analysis of bird management in wine grape production in the Malborough region of New Zealand and estimated a cost–benefit ratio of 7.5. Hueth et al. (Reference Hueth, Cohen, Sangrujee and Zilberman1997) measured the welfare impacts of vertebrate pest damage in a number of California crops, but neither bird damage nor wine grapes was treated separately. The economic impacts of bird damage in California wine grape production were estimated by Anderson et al. (Reference Anderson, Lindell, Moxcey, Siemer, Linz, Curtis, Carroll, Burrows, Boulanger, Steensma and Shwiff2013), but only the cost of damage at current market prices was estimated. There was no examination of the cost of control or any attempt to incorporate bird damage and its control into a model of the wine grape market.
Estimation of the welfare impacts of pest damage and its control is complicated by several factors. First, damage and control methods are often region specific, and it may be desirable to estimate the impacts on a regional level. Second, information on the impacts of a change in control or damage may not be readily available. Field studies have often addressed the effectiveness of a given method of control or measured local damage, but the threat posed by pests can vary considerably even within a small area (Gebhardt et al., Reference Gebhardt, Anderson, Kirkpatrick and Shwiff2011; Somers and Morris, Reference Somers and Morris2002). This makes reliance on field studies to estimate regional or market level impacts problematic.
To address these problems, we developed a partial equilibrium model in which producers explicitly choose to engage in pest control. Pest control costs and yield loss affect supply, and the model allows these effects to vary regionally. Minimal data is required to apply the model; only elasticities, current market price and production data, and estimates of the change in the cost of pest control and damage levels are needed. Elasticities as well as price and production data are readily available for many agricultural commodities. The model is similar to the models developed by Lichtenberg et al. (Reference Lichtenberg, Parker and Zilberman1988) and Sunding (Reference Sunding1996) in that all have the same data requirements, permit regional differences in marginal cost, and can be used to estimate welfare changes. However, our model differs by explicitly incorporating choices related to pest control into the producer's profit maximization problem and in the way that producers' marginal cost functions are affected. It is also easily applied and requires only basic calculations.
We use the model to examine the welfare impacts of both current bird damage and the use of bird control methods to limit damage in California wine grape production. To estimate the first of these we model the hypothetical elimination of the threat of bird damage in California wine grape production (Scenario 1); to estimate the second, we assume that California growers make no attempt to control birds (Scenario 2). We account for the considerable regional variation in wine grape production within California by separating California production into three distinct regions, following Fuller and Alston (Reference Fuller and Alston2012). All modeling efforts are based on a recent survey of California wine grape growers regarding their experience with bird damage and control.
II. The Model
The California wine grape market is highly differentiated, with substantial regional variation in price, yield, and production practices. Prices are, on average, highest in Napa and Sonoma Counties (crush districts 3 and 4). The focus in these counties is on quality and yields are generally relatively low. In contrast, production in much of the Central Valley (crush districts 12–14) is focused on yield and prices are much lower. Therefore, we follow Fuller and Alston (Reference Fuller and Alston2012) and define a high-price region that includes crush districts 3 and 4, a low-price region that includes crush districts 12–14, and a medium-price region that contains the remaining crush districts. The California Department of Food and Agriculture maintains detailed production data at the level of crush districts. Thus, defining price regions in terms of crush districts allows us to calculate average prices and per-acre yields within the three price regions. We assume that the wine grape market is competitive within each of the price segments, and we model each of the three segments in a purely partial equilibrium setting to maintain an emphasis on model usefulness in applied settings.
A. Profit Maximization
The profit maximization problem for each producer is given by
 $$\max \; \pi = Pq(X,{\bf Z}) - xX - {\bf z} \cdot {\bf Z},$$
where P is the market price of the crop, q is the quantity harvested, X is the number of acres harvested in a given year, Z is a vector of the number of acres on which each method of pest control is used, x is the per-acre production costs excluding pest control costs, and z is a vector of the per-acre cost of each method. Because we assume that the market is competitive, producers maximize profit by choosing X and Z but must take price as a given. First-order conditions for the maximization problem are
 $$\displaystyle{{\partial \pi} \over {\partial x}} = P\displaystyle{{\partial q} \over {\partial x}} - x = 0\quad {\rm and}\quad \displaystyle{{\partial \pi} \over {\partial z_j}} = P\displaystyle{{\partial q} \over {\partial z_j}} - z_j = 0{\rm \;} \forall {\rm \;} j,$$
where j denotes a specific pest control method. Equation 2 implies that producers will apply pest control to an acre as long as the additional revenue earned by doing so is greater than the cost of application. Input demand functions are then given by
 $$X_1^{\rm *} = X(P,x,{\bf z})\quad {\rm and}\quad {\rm} {\bf Z}^{\rm *} = {\bf Z}(P,x,{\bf z}),$$
where X* 1 and Z* are the optimal quantities of acres and pest control under current regulations.
Supply functions for individual producers are expressed as
 $$q_1^* = q_1 (X_1^*, {\bf Z}^* ) = q_1 (P,x,{\bf z}) = a + bP.$$
While the quantity produced is fundamentally a function of acreage and pest control use, for now we specify supply as a linear function of price and let the values of a and b reflect some particular level of x and z.
B. Regional Differences in Damage or Control
We assume that there are m+n producers that are differentiated due to the n California growers hypothetically altering pest control practices while the m non-California growers maintain current practices. Specifically, we assume that the California growers engage in no control. In Scenario 1, the California growers no longer face any threat of damage, and the result is that per-acre yield increases; in another scenario, the threat remains, and damage increases when growers do not manage bird damage. In both scenarios, the effect of no control is to restrict all Z j to zero for the n California producers, which has two effects on those producers' marginal cost functions. The marginal cost function for each producer was
 $$MC_1 = {{ - a}\over b} + {q\over b}$$
and for the n growers now becomes
 $$MC_2 = {{ - a}\over b}} + k + {q\over b}(1 + L)}$}},$$
where
 $$k = \displaystyle{{\mathop \sum \nolimits \Delta\, z} \over {yield\;per\;acre}}$$
and
 $$L = \displaystyle{{\% \; yield\;change\;relative\;to\;current\;yield} \over {100}}. $
Equation (6) can be obtained by adding the change in per-unit control costs (k) to equation (5), solving for q and multiplying the resulting expression by (1+L), and then solving for MC. Recall that z represents the per-acre cost of the pest control method. We are considering the elimination of all bird control, which implies that the numerator of equation (7) is simply the negative of what is currently being spent per acre on bird control. Current yield reflects current control efforts and current damage. Thus, L is positive when considering the case of no control and no damage (Scenario 1) and it is negative when considering the case of no control and the resulting increase in damage (Scenario 2).
Equation (6) implies that the change in marginal cost is given by
 $$\Delta MC = k - \displaystyle{{qL} \over {b(1 + L)}}.$$
Thus, the change in marginal cost is the combined impact of two different effects: (1) a parallel shift of the original curve given determined by k and (2) a change in slope due to a change in the quantity of crop lost as production varies.
C. Market Supply
Market supply before the change is the horizontal summation of the (m+n) individual supply functions and is observed as Q s=α+βP, where
 $$\alpha = a(m + n)\quad {\rm and}\quad \beta = b(m + n).$$
When the n growers hypothetically do nothing to control bird damage, the market supply function becomes
 $$Q_s = [n(a + bP - bk)(1 + L)] + [m(a + bP)],$$
where the two terms in brackets represent the aggregate supply functions for the n producers and m producers, respectively. It is useful to rewrite equation (11) in terms of the fraction of producers to which the change in pest control practices applies. Manipulating the relationships in equation (10) and substituting the results into equation (11), we obtain
 $$Q_s = f_n (\alpha + \beta P - \beta k)(1 + L) + f_m (\alpha + \beta P),$
where  $f_n = \left( {\displaystyle{n \over {n + m}}} \right)$ and
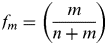 $f_m = \left( {\displaystyle{m \over {n + m}}} \right)$.
Then let market demand be given by Q d=δ+γP, so that a change in pest control practices and damage reflected in (12) yields a new equilibrium given by
 $$P_2 = \displaystyle{{\delta - f_n \alpha + f_n \beta k - f_n \alpha L + f_n \beta kL - f_m \alpha} \over {\,f_n \beta + f_n \beta L + f_m \beta - \gamma}}. $$
D. Welfare Impacts
The market-wide change in consumer surplus is given by
 $$\Delta {\rm CS} = \mathop \int \limits_{P_2} ^{P_1} (\delta + \gamma P)dP.$$
It is useful to estimate the change in producer surplus for the n and m producers separately. For the n producers, the change is calculated as
 $$\Delta PS_n = \mathop \int \limits_{{\raise0.7ex\hbox{${ - \alpha} $} \!\mathord{\left/ {\vphantom {{ - \alpha} \beta}} \right.\kern-\nulldelimiterspace} \!\lower0.7ex\hbox{$\beta $}} + k}^{P_2} (\,f_n \alpha + f_n \beta P - f_n \beta k)(1 + L)dP - \mathop \int \limits_{{\raise0.7ex\hbox{${ - \alpha} $} \!\mathord{\left/ {\vphantom {{ - \alpha} \beta}} \right.\kern-\nulldelimiterspace} \!\lower0.7ex\hbox{$\beta $}}}^{P_1} (\,f_n \alpha + f_n \beta P)dP.$$
For the m producers, the change in surplus is given by
 $$\Delta PS_m = \mathop \int \limits_{P_1} ^{P_2} (\,f_m \alpha + f_m \beta P)dP.$$
E. Model Parameterization
Because of the linearity assumptions, deriving the initial supply and demand curves is straightforward, given that the price elasticities of supply and demand are known and the initial equilibrium is observed. Parameters in the initial market supply function can be estimated by
 $$\beta = \displaystyle{{E_s Q_1} \over {P_1}} \quad {\rm and}\quad \; \alpha = Q_1 - \beta P_1, $$
where E s is price elasticity of supply. Parameters in the market demand function can be derived in a similar fashion.
Estimation of the new supply curve requires additional information. The model assumes that all producers (CA and non-CA) are identical, but in reality the scale of operations may vary considerably by region. As a result, although in theory f n represents the fraction of all producers that alter pest control practices (the California producers), in practice it is desirable to estimate it based on the fraction of production that occurs within California. Estimates of yield per acre, the percentage of yield lost as a result of the pest control change, and the per-acre cost of the pest control method no longer being used are also required. The first of these is readily available from various sources, while the latter two must be estimated for the specific application.
III. Data
Much of the data used in this analysis was based on a survey of growers in California. We chose to rely on a survey rather than field studies for several reasons. First, field studies would have been impractical given that we needed data from across the state. Damage and control methods are likely to vary even within regions, and it would be difficult to implement a sufficient number of field studies to capture these differences. Growers also use many different combinations of control methods, and it would have been difficult to capture the variety of combinations in field studies. Furthermore, damage is likely to vary by year, and it is possible that growers' perceptions are based on their experiences over a number of recent years. This might provide us with data that are less subject to year-to-year variability than data from a field study. We do, however, recognize that survey data are subject to bias by growers and the survey design. Unfortunately, few previous studies have addressed the potential for bias in agricultural pest damage studies. A notable exception is Tzilkowski et al. (Reference Tzilkowski, Brittingham and Lovallo2002), who implement both a survey and field study to assess damage in corn production. The authors could not reject the hypothesis that the average damage estimates from the survey and field studies were equal. Additionally, our own study is part of a larger effort that also assesses the effectiveness of individual control methods using field studies. Although it is not possible to compare the field study results with the survey results directly, preliminary field study results do suggest that the estimates of damage from the survey are quite reasonable.
The survey instrument consisted of 21 questions that solicited information about the location and size of the grower's farm, growers' level of fruit production experience, acreage and yield data, bird damage, bird management methods, and estimated costs for bird damage management.Footnote 1 All survey mailings were completed between March 5 and May 1, 2012, and the sample size was 1,319. Respondents received up to three mailings (i.e., an initial letter and questionnaire, a reminder letter, and a final reminder letter and replacement questionnaire within two weeks of the follow-up reminder letter). To encourage survey response, all mail survey implementation incorporated several characteristics of the Dillman (Reference Dillman2000) Total Design Method, including a brief, respondent-friendly questionnaire, multiple contacts by first-class mail, and cover letter elements that personalized correspondence. Non-response follow up was not possible because we were not given access to the necessary contact information.
We received a total of 237 completed questionnaires from wine grape growers.Footnote 2 Responding growers were located in 29 different counties, with the most responses coming from San Joaquin and Sonoma Counties. All responses from San Joaquin were included in both the low-price and medium-price regions because crush districts 11 and 12 both overlap the county. Total responses for the three price regions were 63 (low price), 155 (medium price), and 69 (high price). Responding growers had been farming an average of about 30 years (low-price average experience=35.6, SD=18; medium-price=29.9, SD=20; high-price=29.7, SD=15) and average wine grape acreage was 307 (low-price average acreage=510, SD=967; medium-price=365, SD=818; high-price=69, SD=326).Footnote 3 Statewide, 75% of responding growers considered farming their primary occupation and 94% considered wine grapes their most important fruit crops. About 38% of the growers believed bird damage has a significant effect on their profits, 21% believed damage increased in the five years prior to the survey, and 68% believed that it remained stable over that time period. Growers were also asked to name the top-three most damaging bird species, and starlings were the most frequently named in all three price regions (Table 1).
Top Five Most Commonly Named Species Causing Damage by Region

Current damage levels and control costs in each region reflect the use of the bird damage control methods that appear in Table 2. Statewide, a majority of respondents used auditory and visual scare devices and nearly half used netting. However, nearly one-third of respondents did nothing to limit bird damage. There were considerable differences in control methods across price regions. The use of chemical repellants appears to decrease with price, and, as expected, the use of netting increases with price. In general, growers in the medium-price region are considerably more likely to use some type of bird control.
Bird Control Methods Used in Wine Grape Production with Percent of Respondents Using by Region (in %)

Survey responses indicate that statewide average bird control costs per acre were $15.94, and current damage is about 1.77% of per-acre yields, but considerable variation exists between regions (Table 3).Footnote 4 Damage levels any without control and without regional control were derived from responses to two separate questions. The first asked growers to forecast damage levels if they engaged in no bird control on their property, but other growers continued to use current practices; the other asked growers to forecast damage if no one in their region attempted to control bird damage. One of the objectives of this study was to understand the impact of bird control at a regional level, but it seems unlikely that the effects of no regional control could be estimated with any certainty. This motivated the use of two different questions to solicit this information, and our quantitative analyses rely on the midpoints of the resulting loss estimates within each price region. While the results of the two questions were quite similar within each region (unreported tests failed to reject the hypotheses of equality within regions), there were interesting differences in responses across the three regions.
Acreage-weighted Mean Per-acre Yield Loss and Control Cost Estimates from Survey of California Growers (in %)

Growers in the low- and high-price regions expected that damage without any regional control would be worse than if they alone did nothing to control birds. This indicates that these growers believe bird damage control produces an external net benefit. That is, growers benefit from control by neighboring growers, perhaps through impacts on bird populations in the region. Conversely, growers in the medium-price region expected that lack of regional control would result in less damage than if they alone did not control birds. This has the opposite implication of an external net cost being associated with bird control. It seems plausible that growers in regions that rely heavily on lethal control methods would realize a benefit of control by other growers and growers in regions that rely heavily on exclusion and scare tactics would be harmed by control by other growers.
Examination of the types and intensity of control methods used in the three regions reveals several factors that might explain or the differences in expectations about damage without control. Although netting is implemented less frequently in the medium-price region than in the high-price region, medium-price growers are most likely to use auditory and visual scare devices and predator nest boxes. The overall high level of netting and use of scare tactics in the medium-price region supports the observation by medium-price growers that bird control involves an external net cost because these methods of control tend to displace birds to other properties, where they are not being used.Footnote 5 The use of scare tactics in the medium-price region may be an important explanation for another reason. Not only do scare tactics used by other growers displace birds to other properties, but their frequent and widespread use may habituate birds to their use and render them less effective. Finally, the expectation of an external net cost rather than an external net benefit in the medium-price region is consistent with the fact that, compared to growers in the other regions, they are much more likely to engage in some type of bird control. If growers in the other regions believe that they benefit from their neighbors' control efforts, their own incentive to engage in control decreases.
Estimates of California wine grape production and prices within each of the three price regions were based on the 2012 California grape crush report (CDFA, 2013b). Prices were calculated as the production-weighted average of the crush districts that made up each price region. Yield per acre in each region was calculated based on production estimates from the crush report and estimates of bearing acreage reported by CDFA (2013a). Table 4 summarizes the price and production estimates used in the analyses. We assumed that 90% of U.S. wine grape production occurs within California based on information from the Wine Grape Growers of America (n.d.) and the Wine Institute (2012). Data on the percentage of U.S. production of low-, medium-, and high-priced grapes produced within California were unavailable, so we assumed that 90% of the production of each of these categories occurs in California.

Price elasticities of demand were assumed to be −2.6, −5.2, and −9.5 in the low-, medium-, and high-price regions, respectively, as estimated by Fuller and Alston (Reference Fuller and Alston2012). Price elasticities of supply were not readily available for the regions we used. We constructed estimates of supply elasticities by first taking the production-weighted average of supply elasticities for eight major varieties of wine grapes in four regions of California that were estimated by Volpe et al. (Reference Volpe, Green, Heien and Howitt2010). The four regions used by Volpe et al. (Reference Volpe, Green, Heien and Howitt2010) were the North Coast, Central Coast, North Central Valley, and South Central Valley. The North Coast region is roughly comparable to our high-price region, and we assume that the production-weighted average supply elasticity from the North Coast region applies in the high-price region. Similarly, the South Central Valley is roughly comparable to our low-price region, and we assume that the same supply elasticity applies in both. Our medium-price region is roughly equivalent to the combined Central Coast and North Central Valley regions, and we assume the average of supply elasticities from these two smaller regions applies in our medium-price region. The resulting supply elasticities in the low, medium, and high-price regions were 0.21, 0.45, and 0.77, respectively.
To account for uncertainty associated with the data and parameter estimates, Monte Carlo simulations were used to calculate all results and examine how uncertainty about parameter estimates affects the results. With one exception, we assumed that each parameter follows a triangular distribution, with minimum and maximum values set at ±50% of the point estimates.Footnote 6 Because the point estimate of the fraction of production that occurs in California was 0.90, we assumed that it was triangular, distributed with minimum and maximum values set at ±10% of 0.90. Random draws from a triangular distribution were simulated by generating a random number on the uniform interval [0,1] and evaluating the inverse of the triangular cumulative distribution function at that number. Each iteration of a simulation consisted of random draw of each parameter and the full set of model results based on those parameter values. Six simulations were performed. In each of the three regions, the impact of the elimination of the threat of bird damage (Scenario 1) and the impact of the elimination of bird control (Scenario 2) were simulated. Each of these simulations consisted of 100,000 iterations to sufficiently characterize the mean results.
IV. Results
The current per-acre yield loss estimate implies that the elimination of the threat of damage would increase the per-acre yield of California producers by 1.77%, 1.95%, and 1.03% in the low-, medium-, and high-price regions, respectively. Control costs would also fall to zero. Table 5 presents the changes in price, production, and consumer and producer surplus that result from these changes. Because these are the effects of the elimination of the threat of bird damage, the negative of these values can be interpreted as the impacts of current bird damage. Thus, bird damage in California causes the price per ton to be $2.73 to $3.73 higher. Similarly, California and U.S. production are both lower by about 67,000 tons. Both consumers and California producers are considerably worse off because of bird damage. Unsurprisingly, bird damage that occurs in California benefits wine grape growers outside California because it lowers their relative marginal cost of production.
Changes That Would Result from the Elimination of both Damage and Control Costs in CA Wine Grape Production during 2012 (Scenario 1)

In Scenario 2, we modeled the hypothetical use of no control. Complete lack of control would have two effects on the supply curve. Control costs of $1.50 (low-price region), $17.59 (medium-price region), and $9.13 (high-price region) per acre would be eliminated, which would have a positive effect on supply. However, this effect is more than offset by the decline in per-acre yield that would result from additional damage. Based on survey results that indicate both current per-acre yield loss and potential loss without control, per-acre yield would decline by 3.36% (low-price region), 11.40% (medium-price region), and 7.83% (high-price region) from current levels.Footnote 7 The resulting estimates for price, production, and welfare impacts are presented in Table 6. These are the impacts that would be experienced if growers in California made no attempt to control bird damage. Conversely, the negative of these values is interpreted as the benefit of current control methods. That is, current use of bird management techniques in California wine grape production results in a market price that is $5 to $20 lower per ton and production levels that are over 266,000 tons higher. Consumers and California growers are considerably better off because of growers' management of bird damage, and it is interesting to note that in percentage terms consumers benefit relatively more than producers.
Impacts of Not Controlling Bird Damage in CA Wine Grape Production during 2012 (Scenario 2)
To characterize the relative impacts of uncertainty about each parameter, we calculated how far each particular draw and model result was from the mean draw and mean result in that simulation. Linear regressions were then used to examine how percentage deviations in parameters from their mean values affected percentage deviations of model results from their means. Estimated coefficients from the regressions indicate the extent to which model results are affected if a parameter estimate is inaccurate. We only consider the medium-price region because results from any region will be generally applicable to all regions because the same model was used for all three regions. Table 7 presents the results of four different regressions.
Sensitivity Analysis Based on Monte Carlo Simulation of Model Results for California Producer Surplus and U.S. Consumer Surplus in the Medium-price Region

Note: All variables measured as percentage deviations from simulation mean values. p-values of all coefficients were approximately zero.
As expected, all coefficients in all regressions were highly significant. Note that the regressions were specified without a constant because if no parameters deviate from their mean, the result will equal the result from the deterministic calculations. The results reveal that deviations in price elasticity of demand have larger impacts on consumer surplus results than deviations in price elasticity of supply. Additionally, one-percentage-point deviations in current equilibrium values, the change in yield per acre, and the fraction of output from growers in California cause approximately one-percentage-point deviations in model results. Finally, a given percentage-point deviation in the change in yield as a result of a change in damage has a much larger impact on the model results than the same percentage-point deviation in the change in the cost of pest control.
V. Conclusion
Our results indicate that the impact of bird damage on California wine grape production is significant. Although current control methods reduce damage substantially, without bird damage and the cost of control, the price of wine grapes would be 0.59%, 0.34%, and 0.10% lower in the low-, medium-, and high-price regions, respectively. The higher price that results from damage and control costs has significant negative impacts on consumers and California producers. U.S. consumers are harmed by about $12.3 million (3%) by current damage and control costs, while California producer surplus is about $34 million (1.3%) lower because of damage and the cost of control.
While the cost of current damage to both consumers and California producers is large, the impacts of a failure to control damage could be much larger. Based on survey responses, California producers believe that they could lose a substantial portion of their production if they made no effort to reduce bird damage. For example, growers in the medium-price region believe they could lose more than 11% of their crop to birds if they did not engage in control. Such a large loss of output would have significant impacts on grape prices and grower profitability. We estimate that, without bird control in California, the market price would be 1.12%, 1.88%, and 0.71% higher in the low-, medium-, and high-price regions, respectively. Despite the higher price, the lost production would reduce California producer surplus by $173 million (6.6%) and U.S. consumer surplus by $48 million (11.5%). These numbers can also be interpreted as the net benefits of the current use of bird control in California wine grape production.
Consumers of medium-price grapes and producers in the medium-price region suffer the most harm from bird damage in both absolute and percentage terms. This results from the fact that current yield loss is highest in the medium-price region, and growers in that region incur the largest costs from bird damage control. In percentage terms, wine grape consumers in all price categories bear more of the burden from bird damage than producers. This finding results from the highly elastic demand that characterizes this market. Although consumers and producers of medium-price grapes suffer the most from bird damage, they also benefit the most from bird damage control. Growers in the medium-price region expect that failure to control bird damage in the region would result in yield losses that approach 14%. Thus, while current damage may be highest in the medium-price region, the yield savings that result from bird damage control are also highest in the medium-price region. The fact that the largest net benefits of control accrue to the medium-price region implies that the yield savings of bird control outweigh the substantially higher control costs that are incurred by growers in that region. Finally, as in the case of current bird damage, consumers of grapes produced in all three regions benefit more than growers from bird damage control due to relatively elastic demand.
This analysis has several limitations. First, while the assumption of linear supply and demand may provide reasonable results, given a small change in marginal cost, it becomes increasingly problematic as the marginal cost shift increases in size. However, the assumption of linearity allows reliance on readily available data and makes the model considerably more tractable. Second, the survey provided a relatively small sample size, and it is unknown to what extent it is representative of all California growers. Future efforts should focus on collecting better data on damages and control costs. Survey responses are subject to bias from a number of sources, and the resulting damage and cost estimates are subject to nonresponse bias. There is additional uncertainty surrounding the estimates of damage without control because it is unclear on what level of experience growers are basing their perceptions. Future research could address these problems by incorporating data from field studies or by soliciting specific information from growers about their non-use of bird damage control. Lack of varietal data is also problematic because value and damage may vary by variety. We have used a Monte Carlo method-based sensitivity analysis to examine the impact of uncertainty in the parameters on the model's results. While this sensitivity analysis allows us to examine how different parameter values would affect the results, we are unable to construct confidence intervals for parameters or model results. It would also be valuable to have cost information on individual control methods rather than the combination used by a particular grower. This would enable examination of the net benefits of specific methods of control. Additionally, the model is simplified in the sense that it does not distinguish between wine makers and wine consumers. Thus, the changes in consumer surplus should be interpreted as the impacts on those who purchase wine grapes and all downstream market participants. Finally, the model does not consider international trade, although it would be straightforward to do this. We chose to focus solely on the domestic market because very few wine grapes are exported.
Despite these shortcomings, our results are valuable for several reasons. We have constructed a simple model that allows the estimation of welfare impacts that arise from both changes in yield and production costs. The model is based on a profit maximization problem that incorporates the use of pest control, allows production costs to vary by region, requires minimal data, and can easily be applied to examine other scenarios or crops. Our application to bird damage in California wine grape production indicates that the impacts of damage are considerable, but without control, the impacts could be much larger. This implies that considerable gains could be achieved by increasing the effectiveness of control, and considerable harm could be done if the effectiveness of control declines or the ability of growers to control bird pests is limited. Furthermore, the model results indicate that a substantial portion of the benefits or burden of changes in bird damage, control costs, or control effectiveness accrue to market participants other than the growers.



