


INTRODUCTION
The past 20–30 years has witnessed the tremendous growth of an empirical, quantitative literature that examines cross-national patterns of state repression (see, e.g., Apodaca Reference Apodaca2001; Bueno de Mesquita et al. Reference Bueno de Mesquita, Downs, Smith and Cherif2005; Cingranelli and Filippov Reference Cingranelli and Filippov2010; Cingranelli and Richards Reference Cingranelli and Richards1999; Conrad and Moore Reference Conrad and Moore2010; Davenport Reference Davenport1995, Reference Davenport1999, Reference Davenport2007a, Reference Davenport2007b; Davenport and Armstrong Reference Davenport and Armstrong2004; Fein Reference Fein1995; Hafner-Burton Reference Hafner-Burton2005a; Hafner-Burton and Tsutsui Reference Hafner-Burton and Tsutsui2005; Hathaway Reference Hathaway2002; Henderson Reference Henderson1991, Reference Henderson1993; Hibbs Jr Reference Hibbs1973; Keith Reference Keith1999, Reference Keith2002; Keith, Tate, and Poe Reference Keith, Tate and Poe2009; Mitchell and McCormick Reference Mitchell and McCormick1988; Park Reference Park1987; Poe and Tate Reference Poe and Tate1994; Poe, Tate, and Keith Reference Poe, Tate and Keith1999; Richards, Gelleny, and Sacko Reference Richards, Gelleny and Sacko2001; Stohl et al. Reference Stohl, Carleton, Lopez and Samuels1986). The general purpose of this literature is to discover a set of political, economic, and social conditions that are consistently associated with government violations of the most basic human rights.Footnote 1 In other words, this literature aims to answer why some governments violate basic human rights more than others. This is an enormously important question since it relates directly to one of the fundamental problems of politics, which is how an entity given the exclusive authority to enforce rules through physical coercion (the state) can be prevented from abusing that authority (see, e.g., Moore Reference Moore2010). This literature deals specifically with violent, egregious abuses of such authority, but also addresses this broader problem which has clear implications for questions about democratization and the emergence of genuine constraints on government behavior (e.g., North and Weingast Reference North and Weingast1989; Weingast Reference Weingast1997).
Though the basic research question explored by this literature is of tremendous intrinsic importance, the standards currently used to assess claims about the causes of state repression are inadequate for the goals of this research. Specifically, scholars nearly always employ null hypothesis tests of statistical significance to determine if a particular covariate is a meaningful determinant of state repression. Under this approach, covariates whose coefficients achieve a p-value smaller than some arbitrary threshold (usually 0.05) are declared important determinants of state repression. Using this criterion, the literature has uncovered a number of empirical findings with respect to state repression. Some concepts have been so consistently related to repression that researchers are now effectively obligated to include measures of them in their models.Footnote 2 This list of “usual suspects” now includes, at minimum, measures of GDP per capita, population size, civil and international war, and democratic political institutions. Beyond these relationships, the list of concepts that influence repression has been steadily expanded to include international factors such as INGO presence and behavior (Franklin Reference Franklin2008; Hafner-Burton and Tsutsui Reference Hafner-Burton and Tsutsui2005; Murdie and Davis Reference Murdie and Davis2012), a country’s position in the world economy (Hafner-Burton Reference Hafner-Burton2005a), and participation in international financial institutions (Abouharb and Cingranelli Reference Abouharb and Cingranelli2006, Reference Abouharb and Cingranelli2007), to name just a few. Other recent additions to the list include a host of domestic legal institutions such as constitutional provisions for basic rights (Cross Reference Cross1999; Keith, Tate, and Poe Reference Keith, Tate and Poe2009) and common law heritage (Mitchell, Ring, and Spellman Reference Mitchell, Ring and Spellman2013).
While the current approach has value we argue that, by itself, the standard analysis used in the literature is incomplete at best, and is possibly misleading. First, since variables that are statistically significant may not meaningfully increase the ability of a model to predict the outcome of interest (Ward, Greenhill, and Bakke Reference Ward, Greenhill and Bakke2010), the current approach effectively ignores the ability of a model to predict state repression. Second, since scholars routinely use all of the data to fit their models, they have no way of knowing if the patterns they uncover are the result of the peculiarities of a particular dataset or whether they are more general. That is, many of the results in the literature likely result from overfitting, meaning they reflect noise in the data rather than meaningful relationships. If indicators of theoretical concepts fail to produce relationships with state repression that generalize to other sets of data, or do not add predictive validity to a model of state repression, this calls into question the importance of these concepts in influencing repressive behavior. While tests for statistical significance have value, evaluating the ability of a model to predict state violence out-of-sample offers at least an additional, and perhaps a better, way of assessing the veracity of explanations for its occurrence (see, e.g. Beck, King, and Zeng Reference Beck, King and Zeng2000). That is, significance tests for coefficient(s) are certainly not the only option available, and they may not be the best. This is a point which has implications for empirical research in any area of political science which still uses statistical significance as the primary (or perhaps only) criterion for evaluating results.
This study remedies this deficiency in the literature through the use of cross-validation and random forests. Cross-validation is a well-developed and widely accepted method for assessing the relative predictive performance of statistical models (see, e.g., Efron Reference Efron1983; Geisser Reference Geisser1975; Hastie, Tibshirani, and Friedman Reference Hastie, Tibshirani and Friedman2008; Picard and Cook Reference Picard and Cook1984), though its use is relatively rare in political science.Footnote 3 The cross-validation analysis below assesses the ability of covariates which the literature identifies as important to increase the predictive power of a model of government repression beyond models that include minimal, baseline sets of “usual suspect” covariates. Random forests, which are ensembles of decision trees, are another useful technique for determining how much predictive power is gained by adding a particular covariate to a statistical model (Breiman Reference Breiman2001). Random forests allow us to examine the predictive power that each covariate adds to models that include various combinations of our other covariates, rather than what each covariate adds to the baseline model alone. Random forests are attractive for our purposes because they detect non-linear and interactive relationships that have not been prespecified. We find that some, but relatively few, of the concepts identified by the literature as important determinants of state repression are able to substantially improve the fit of statistical models predicting state repression. This means that researchers examining government violence have been drawing conclusions about the accuracy of theoretical explanations that are not necessarily supported by the data.
To foreshadow the results, out of all the covariates considered, civil conflict is the best predictor of most indicators of state repression. Indicators of democracy also perform well in the analysis, though they predict some types of repression much more accurately than others, which has gone unnoticed in this literature. These two results are strong and support the literature’s principal findings (see Davenport Reference Davenport2007a, 7–14), but their importance is tempered by measurement issues: the most commonly employed operational definition of repression overlaps to some extent with the operational definitions of democracy and civil war typically adopted in this literature. Thus indicators of civil war and democracy partly measure repression, a point on which we elaborate further below.
We also find that indicators of some concepts which have received relatively little attention in the literature, including domestic legal institutions, demographic youth bulges, and state reliance on natural resource rents, perform relatively well. The excellent performance of several aspects of domestic legal systems is anticipated by the comparative institutions literature, particularly arguments about the ability of constitutions and courts to constrain government behavior generally (e.g., Carey Reference Carey2000; Elkins, Ginsburg, and Melton Reference Elkins, Ginsburg and Melton2009; North and Weingast Reference North and Weingast1989; Ordeshook Reference Ordeshook1992; Vanberg Reference Vanberg2005; Weingast Reference Weingast1997). That literature has been largely ignored by scholars who study repression,Footnote 4 and we argue that it deserves more attention in the future.
Finally, indicators of some types of government violence are predicted well by a few of the covariates examined, which indicates that disaggregating measures of repression will be useful in future studies. We conclude by offering suggestions about how researchers can incorporate the insights of this study into future theoretical and empirical work on state repression.
A BRIEF TOUR OF THE LITERATURE
Cross-national, quantitative research on government repression, which began in earnest in the mid-1980s, was facilitated by the publication of annual, national reports on human rights conditions by Freedom House, Amnesty International (AI), and the US State Department (USSD).Footnote 5 Early work used cross-sections of these data to test hypotheses about the impact of various concepts on repression. The most seminal work in the field is due to Poe and Tate (Reference Poe and Tate1994), who presented the first analysis using data covering a relatively large time span and a relatively large number of countries. These data were coded from the annual reports of AI and the USSD and measure the practices of political imprisonment, torture, disappearance, and summary execution. Poe and Tate (Reference Poe and Tate1994) found that the coefficients associated with measures of democracy and GDP per capita were negative and statistically significant, and those associated with population size, the occurrence of international and civil wars, and lagged repression, were significant and positive. A measure of “leftist” regimes, too, was found to be positive and significant, though only using the data coded from State Department reports.Footnote 6 With the exception of democracy, which is the primary focus of much work on repression, most of the covariates listed above were simply adopted as standard “control” variables, particularly population size, GDP per capita, and international and civil war.
The general theoretical framework for most of this research could be described as an informal, decision-theoretic approach that focuses on conditions which make repressive tactics costlier/more beneficial to political leaders.Footnote 7 For example, the positive relationship between violent (civil and international) conflicts and repression is usually interpreted to mean that leaders perceive repression to be more useful as real or perceived threats to their position in power increase, which is consistent with the idea that repression is a response to internal or external political challenges (see, e.g., Davenport Reference Davenport1995; Gurr Reference Gurr, Stohl and Lopez1986, Reference Gurr1988; Tilly Reference Tilly1978, Reference Tilly and Skocpol1985). Indeed, empirical studies have so consistently found a relationship between dissent and repressionFootnote 8 that this constitutes one of the literature’s principal findings, and the reciprocal relationship between the two has become incorporated into more recent, formal, strategic models as an assumption (Ritter Reference RitterForthcoming).Footnote 9
In line with this general theoretical framework, many take the negative relationship between democracy and repression to indicate that institutional constraints in democracies create a higher expected cost for using repression.Footnote 10 As noted above, the relationship between repression and democracy uncovered by early work (Henderson Reference Henderson1991; Poe and Tate Reference Poe and Tate1994) has been explored in depth by a number of scholars, who have examined various topics such as how transitions to/from democracy affect repression (Davenport Reference Davenport1999), the functional form of the relationship between democracy and repression (Davenport and Armstrong Reference Davenport and Armstrong2004; Fein Reference Fein1995), and which aspects of democracy are most strongly related to repression (Bueno de Mesquita et al. Reference Bueno de Mesquita, Downs, Smith and Cherif2005; Conrad and Moore Reference Conrad and Moore2010; Davenport Reference Davenport2007b). The negative relationship between democracy and repression represents the literature’s other principal finding, but much research on democracy and repression is plagued by measurement problems. This is because governments that target political opposition with violence are less democratic by definition, given the way democracy is usually defined and operationalized in this literature.Footnote 11 The most commonly employed measure of democracy in studies of repression is the Polity index (Marshall and Jaggers Reference Marshall and Jaggers2009), which primarily measures the competition (or “opposition”) dimension of democracy discussed by Dahl (Reference Dahl1971), i.e., the extent to which the government tolerates competing policy preferences.Footnote 12 Since the definition of repression is the use of coercion against potential and actual opponents of the government, measures of repression will be related by construction to measures of democracy that include information about violence used to suppress political competition.Footnote 13 We discuss the implications of this problem in more detail below.
A recent and promising development is a body of work that examines the effects of various domestic legal institutions on state repression (Cross Reference Cross1999; Davenport Reference Davenport1996; Keith, Tate, and Poe Reference Keith, Tate and Poe2009; Mitchell, Ring, and Spellman Reference Mitchell, Ring and Spellman2013; Powell and Staton Reference Powell and Staton2009). We view these studies as a promising development because a large amount of theoretical work in comparative politics suggests there should be a meaningful relationship between legal institutions and repression. In particular, the comparative institutions literature views constitutions and courts as instrumental in helping citizens overcome the coordination problem they face when attempting to resist government encroachment on basic rights (Carey Reference Carey2000; Elkins, Ginsburg, and Melton Reference Elkins, Ginsburg and Melton2009; North and Weingast Reference North and Weingast1989; Ordeshook Reference Ordeshook1992; Vanberg Reference Vanberg2005; Weingast Reference Weingast1997). This suggests that constitutions and courts are useful for generating credible commitments on the part of the government to observe limits on its authority and refrain from encroaching on rights generally, including civil/political liberties as well as property rights. Arguments from the institutional literature on constitutions and courts have implications for empirical work on repression, though their connection to the repression literature is not widely appreciated.Footnote 14 Specifically, these arguments anticipate negative relationships between repression and (1) constitutional provisions which set explicit limits on government authority, and (2) judicial independence. Concerning empirical findings, Cross (Reference Cross1999), Davenport (Reference Davenport1996), and Keith, Tate, and Poe (Reference Keith, Tate and Poe2009) find negative relationships between repression and certain kinds of constitutional provisions, while Mitchell, Ring, and Spellman (Reference Mitchell, Ring and Spellman2013) find that common law legal systems are associated with less repression. Powell and Staton (Reference Powell and Staton2009) and Mitchell, Ring, and Spellman (Reference Mitchell, Ring and Spellman2013) report a negative relationship between de facto judicial independence and state violence. The claim that domestic legal institutions are good predictors of repressive behavior is strongly supported by the results we present below, and we discuss the implications of these findings in the Conclusion.
Two more recent studies have examined how other macro-level domestic factors influence the use of repression. One evaluates how state reliance on natural resource rents, rather than tax revenue, affects incentives for governments to use repression (DeMeritt and Young Reference DeMeritt and Young2013),Footnote 15 building on theoretical insights from the literature on natural resource revenue and civil war, and natural resource revenue and democratization. The other study analyzes the relationship between so-called youth bulges and cross-national levels of state violence, arguing that governments in countries with large youth populations use repression in anticipation of high levels of dissent and conflict (Nordås and Davenport Reference Nordås and Davenport2013).Footnote 16 We think this is also a promising development since it suggests a focus on macro-economic and demographic factors beyond per capita wealth and population size.
Alongside research that examines how domestic conditions (primarily dissent and democracy) affect a government’s use of repression, there has developed a large body of work examining the relationships between repression and a variety of international factors such as international human rights law and a state’s position in the global economy. In general, the findings in this literature are much less consistent than those in research on domestic political behavior/institutions and repression (Davenport Reference Davenport2007a; Hafner-Burton Reference Hafner-Burton2005a), which indicates that these influences may be more tenuous. Much of this work also adopts an essentially decision-theoretic approach, arguing that various international influences affect the costs/benefits to political leaders for using repression. For example, one branch of this research focuses on the impact of international economic factors such as exposure to trade and foreign investment, pitting classic Marxist arguments about the role of international capital in degrading human rights practices against arguments that expect trade and investment to improve human rights practices by virtue of their beneficial effects on the domestic economy. Arguments in favor of a positive relationship between foreign investment and repression typically claim that influxes of foreign capital harm the domestic economy as a whole (though they benefit political elites), which creates dissent, thus repression becomes net beneficial because it maintains regime stability and encourages further investment (see, e.g., Meyer Reference Meyer1996). In terms of empirical results, recent work on this topic has generally found a negative relationship between repression and openness to trade and investment (Apodaca Reference Apodaca2001; Hafner-Burton Reference Hafner-Burton2005a; Richards, Gelleny, and Sacko Reference Richards, Gelleny and Sacko2001).Footnote 17
Another international economic factor examined in this literature is participation in IMF and World Bank structural adjustment programs. Employing an argument similar to the one discussed above with respect to foreign investment and repression, Abouharb and Cingranelli (Reference Abouharb and Cingranelli2006, Reference Abouharb and Cingranelli2007) find a positive relationship between repression and participation in such programs. Hafner-Burton (Reference Hafner-Burton2005b) focuses on human rights clauses in preferential trade agreements, arguing that explicitly tying human rights practices to trade policy makes repression costlier, and finds a negative relationship between such agreements and state repression.Footnote 18
Another line of research examines the impact of global civil society broadly, and human rights NGO/INGO and Western media activity specifically, on human rights practices (Franklin Reference Franklin2008; Hafner-Burton Reference Hafner-Burton2008; Hafner-Burton and Tsutsui Reference Hafner-Burton and Tsutsui2005; Murdie and Davis Reference Murdie and Davis2012). The impact of NGO/INGO presence on repression has been found to be negative, while results concerning the effects of “naming and shaming” are more mixed.Footnote 19
Beyond the international economy and global civil society, there is also a large literature on the effect of international legal agreements on human rights practices (Conrad and Ritter Reference Conrad and Ritter2013; Fariss Reference Fariss2014; Hathaway Reference Hathaway2002; Hill Reference Hill2010; Keith Reference Keith1999; Lupu Reference Lupu2013; Neumayer Reference Neumayer2005; Powell and Staton Reference Powell and Staton2009; Simmons Reference Simmons2009). Much research examining the impact of international law focuses on UN treaties and has found no relationship, or even a positive relationship, between treaty ratification and repression (Hathaway Reference Hathaway2002; Hill Reference Hill2010; Keith Reference Keith1999),Footnote 20 while other studies have found negative relationships conditional on domestic factors such as democratic political institutions (Neumayer Reference Neumayer2005; Simmons Reference Simmons2009),Footnote 21 strong domestic courts/rule of law (Simmons Reference Simmons2009), a large NGO presence (Neumayer Reference Neumayer2005), the expected tenure of political leaders (Conrad and Ritter Reference Conrad and Ritter2013), and legal standards of proof for particular rights violations (Lupu Reference Lupu2013).
For our purposes we do not need to exhaustively review all of the theoretical arguments presented in the studies cited above. Our goal is to evaluate the empirical implications of existing theoretical arguments using predictive validity as a criterion for inference. We are not interested in prediction for its own sake, but rather for empirically sorting through the many hypotheses advanced in this literature. Our goal is essentially the same as Poe and Tate (Reference Poe and Tate1994): to determine which of the many posited causes of repression receive the strongest support in the available data. To make this determination we examine whether (1) the statistical relationships discovered by this broad literature are generalizable beyond the particular datasets which produced these relationships, and (2) indicators of the concepts identified as important determinants of state repression improve the predictive power of statistical models of state repression. In the next section we discuss the methods and data used to accomplish these goals.
EVALUATING MODELS OF STATE REPRESSION
As discussed above, the standard criterion for assessing the veracity of a potential explanation for state repression is a null hypothesis significance test for one or more covariates which measure theoretically relevant concepts. The shortcomings of this criterion for social science research are well documented (see, e.g., Gill Reference Gill1999), and we do not discuss all of them here. Our concern is that the use of this criterion alone has hindered the development of generalizable and accurate explanations for repression. For one, strict adherence to null hypothesis significance tests alone ignores the ability of a model to predict instances of state repression. This means that a variable which is a statistically significant predictor of repression may not actually improve our ability to correctly classify governments as more or less repressive. Recent work on civil war has shown that statistical significance and predictive validity can actually be at odds with one another, i.e., covariates with statistically significant coefficients can actually impair a model’s predictive performance (Ward, Greenhill, and Bakke Reference Ward, Greenhill and Bakke2010). This means that attention to statistical significance alone is misleading researchers about what are, and what are not, important determinants of state repression.Footnote 22 Rather than evaluating statistical significance alone, researchers should evaluate the fit of their model to the data. If a theoretically informed statistical model of state repression is offered as evidence that one has discovered an important cause of repression, then the model should be able to produce reasonably accurate predictions, i.e., predicted values that closely match observed values. Until now this literature has given little attention to predictive validity,Footnote 23 so it is not even obvious what “reasonably accurate” means. We provide some indication of which theoretically motivated variables add the most accuracy to models using the most commonly analyzed data on state repression. By doing this we hope to establish a baseline for future work, and provide a better way to adjudicate between existing theoretical explanations for repression.
Second, since scholars typically use all of the data available to estimate their models, there is a significant danger of overfitting. This means that researchers may be discovering a relationship that is the result of the unusual features of a particular dataset rather than a meaningful, generalizable relationship between repression and a concept of interest. It has been demonstrated elsewhere that selecting sets of covariates based on p-values can result in models with significant (at the 0.05 level) coefficients for variables whose relationship with some response variable is truly random (Freedman Reference Freedman1983). This is potentially a serious problem for cross-national research on state repression since the purpose of this literature is to uncover general empirical regularities between repression and concepts of interest. Examining the fit of a model does not necessarily circumvent this problem, because any model will almost certainly provide a better fit to the data used for its estimation than any other set of data (see, e.g., Picard and Cook Reference Picard and Cook1984). This is why some have proposed the use of out-of-sample fit as a heuristic for evaluating model performance in conflict studies (Beck, King, and Zeng Reference Beck, King and Zeng2000; Ward, Greenhill, and Bakke Reference Ward, Greenhill and Bakke2010). Such an analysis avoids drawing conclusions based on idiosyncratic results: if a model has not produced a generalizable result, then it will produce poor predictions in a set of data which was not used for its estimation.
As a final point, models of state repression with predictive validity will be of much more interest to policymakers than models with statistically significant coefficients. If covariates with significant coefficients do not provide any leverage in predicting when and where government violence will occur, then they will not be of much value for making policy decisions. These are important points that have been largely ignored in the quantitative literature on state repression. Cross-validation techniques and random forests, which we discuss below, can address these omissions.
Cross-Validation
The purpose of cross-validation is to examine the out-of-sample predictive power of a statistical model. The cross-validation procedure we use below proceeds as follows: the analyst divides the data into k subsets, estimates a model using k − 1 of the subsets (the “training” set), uses these estimates to generate predictions for the remaining subset (the “test” set), and calculates some measure of prediction error in the test set. The data are “rotated” k times so that each of the k folds is eventually used as the test set, and the prediction error is summarized based on all test sets. This is often called k-fold cross-validation. Typically the data are divided up a number of times in this fashion to ensure that results are not dependent on dividing the data in a particular way. For the analysis below we perform 10-fold cross-validation.Footnote 24 We randomly divide the data into 10 folds, estimate the model, and calculate the prediction error across all folds 1,000 times for each model. Resampling this many times allows us to approximate the uncertainty around the median prediction error for each model, which is useful for comparing performance across models. We describe the statistics used to evaluate predictive performance below.
Random Forests
We also estimate a set of random forests to assess each covariate’s predictive power. Random forests, and their constituent decision trees, are a class of supervised machine learning algorithms that are commonly used for prediction as well as assessing which variables are the most important predictors of the outcome of interest (Breiman Reference Breiman2001).Footnote 25 There are several advantages to this nonparametric approach. For one, it allows us to consider the predictive power of all the covariates, rather than comparing the fit of a model with a particular covariate in addition to a base model, as in the cross-validation analysis. Random forests also allow for nonlinear functional forms and complex interactions among the covariates, without the analyst having to prespecify a particular functional form or interaction term.Footnote 26 Decision trees, or base learners, the constituent parts of a random forest, find an optimal partition of the covariate space (the space spanned by all of the predictor variables) through recursive partitioning, or “growing” the tree. In brief, the recursive partitioning algorithm we use (a single decision tree in an ensemble) works byFootnote 27
-
1. selecting a set of observations (by subsampling from the full set of data);
-
2. selecting a subset of covariates;
-
3. finding the variable in the selected subset that is most strongly related to the dependent variable;
-
4. finding the point in the selected variable that optimally classifies the dependent variable;
-
5. repeating steps 2 through 5 on the resulting partitions (daughter nodes) until a stopping criterion is met.
For a random forest, this process is repeated a large number of times, resulting in a forest of decision trees. Each tree is grown with a randomly sampled set of data taken from the full set of data and each node may have different predictors randomly selected. The predicted value for an observation is the most commonly predicted value for that observation across all the terminal nodes (the node at which the stopping criteria is met) in each decision tree in the forest. A nonlinear relationship between a particular covariate and the outcome can be detected because the partitioning algorithm can make multiple splits on the same variable within a single decision tree in addition to making different splits (i.e., at different points in the variable) across trees in the forest (see Biau, Devroye, and Lugosi Reference Biau, Devroye and Lugosi2008). The detection of interactions between covariates works similarly. A more in-depth explanation of decision trees and random forests can be found in Strobl, Malley, and Tutz (Reference Strobl, Malley and Tutz2009).
As an example consider a model of political imprisonment as measured by the political imprisonment component of the CIRI scale. The political imprisonment variable is an ordered categorical variable that ranges from 0 to 2, with higher values indicating less political imprisonment. Suppose we wished to predict what level of political imprisonment would be observed in a particular set of country-years using the measure of civil war from the UCDP/PRIO data (Themnér and Wallensteen Reference Themnér and Wallensteen2012) and the measure of youth bulges from Urdal (Reference Urdal2006) used by Nordås and Davenport (Reference Nordås and Davenport2013). These are thought to capture incentives to repress based on current, and prospective, levels of dissident activity. Figure 1 shows the result from a decision tree using a set of 500 randomly selected observations (the first step in the algorithm described above) along with the two aforementioned variables.Footnote 28 At the first node the youth bulges variable is selected because, at least in the 500 observations that were randomly selected, it was most strongly related to the CIRI measure of political imprisonment. After the youth bulges variable is selected, an optimal partition of the variable is found, whereby the dependent variable is best classified. This results in two more partitions, on each side of the split. Each of these daughter nodes is then partitioned further using the civil war variable, which is most strongly related to the dependent variable at nodes 2 and 7. Node 2 undergoes one more split using the youth bulges variable, resulting in a set of terminal nodes (the row along the bottom of Figure 1). At these nodes the stopping criterion is reached: the increase in classification performance from further partitioning is low at this point. The terminal nodes are used to classify observations by using the most common class in each node. If this were a random forest instead of a decision tree (i.e., an ensemble of decision trees), the variables included in each node in the tree (and thus available for selection) would be randomly selected, and the predicted class of each observation would be the most commonly predicted class across the predictions made by each tree.Footnote 29
Results of Using a Decision Tree to Predict the Level of Political Imprisonment using 500 Randomly Sampled Observations and Two Covariates, Civil War and Youth Bulges

There are a variety of implementations of random forests, some of which have more or less desirable statistical properties (Siroky et al. Reference Siroky2009; Strobl, Malley, and Tutz Reference Strobl, Malley and Tutz2009). We utilize the unbiased decision tree algorithm (referred to as a conditional inference tree) developed by Hothorn, Hornik, and Zeileis (Reference Hothorn, Hornik and Zeileis2006). These trees first test the global null hypothesis of no relation between the covariates in the partition (a particular node) P, XP j (the variables in that node) where j indexes each covariate, and the dependent variable. If this global null hypothesis can be rejected at a prespecified level of confidence α, then the covariate with the smallest p-value is selected, and an optimal split in the selected covariate is found. If the null hypothesis cannot be rejected, then partitioning stops. This stopping criteria avoids the established bias towards variables with many possible partitions that occurs in many other random forest implementations, allowing for unbiased variable selection (Hothorn, Hornik, and Zeileis Reference Hothorn, Hornik and Zeileis2006; Strobl et al. Reference Strobl, Boulesteix, Zeileis and Hothorn2007). It also prevents overfitting since it does not optimize global information, as is common in other decision tree implementations.
Data and Model Evaluation
Most of the empirical research on repression uses either the indicator used by Poe and Tate (Reference Poe and Tate1994), known as the “Political Terror Scale” (PTS) (Gibney, Cornett and Wood Reference Gibney, Cornett and Wood2009), or an indicator known as the “Physical Integrity Index” from the Cingranelli-Richards (CIRI) human rights project (Cingranelli and Richards Reference Cingranelli and Richards2010b). While there are some differences between the two,Footnote 30 both of these are ordinal indicators coded from annual AI and USSD reprorts, and both measure instances of political imprisonment, torture, kidnapping, and summary executions. The most important difference between these two indicators is that the CIRI physical integrity rights index can be disaggregated into components that measure each of these abusive practices separately. Though disaggregation of the CIRI index is possible, it is not common practice; few studies theorize about the use of any of the four specific practices measured by CIRI, and those that do typically focus on torture (see, e.g., Conrad Reference Conrad2012; Conrad and Moore Reference Conrad and Moore2010; Conrad and Ritter Reference Conrad and Ritter2013; Hathaway Reference Hathaway and Levinson2004; Rejali Reference Rejali2007).Footnote 31 The analysis below employs each of the CIRI components in addition to the PTS and the aggregated CIRI index.Footnote 32 This allows us to evaluate whether theoretically informed covariates are better at predicting some repressive practices than others. Our results reveal important differences between the individual components, a point to which we return below.Footnote 33 In addition to CIRI and PTS we employ a new measure from Fariss (Reference Fariss2014), which is created using a Bayesian measurement modelFootnote 34 and incorporates the indicators mentioned above in addition to data from many other sources.Footnote 35
For models using the PTS, the aggregate CIRI index, and the variable created by Fariss (Reference Fariss2014) we estimate linear models, fit using ordinary least squares, which is common practice in the literature. We estimate ordinal logit models for the CIRI component scales, and an additional ordinal logit model for the PTS.Footnote 36 For the linear models, root-mean-squared error provides a straightforward way of assessing predictive performance.Footnote 37 For ordinal logit models the choice of a fit statistic is not as obvious. We use Somer’s D, a rank correlation coefficient (Somers Reference Somers1962), as our discrepancy statistic for the ordinal logit models. Somer’s D is closely related to Goodman and Kruskal’s γ and Kendall’s τ, differing only in the denominator.Footnote 38 Somer’s D makes a distinction between the independent and dependent variable in a bivariate distribution, correcting for ties within the independent variable. With Y being treated as the independent variable it is denoted Dxy . Specifically,
 $$
D_{xy} = \frac{P - Q}{P + Q + X_0},
$$
where P is the number of concordant pairs, Q is the number discordant pairs, and X 0 is the number of ties in X. This is simply a measure of association for ordinal variables, so our approach is essentially to calculate the correlation between predicted and observed values. Like all correlation coefficients, the D statistic lies in the interval [ − 1, 1], with values closer to 1 indicating more rank agreement and values closer to − 1 indicated less rank agreement, so values closer to 0 indicate more prediction error. In the results section below we discuss how we use these performance measures to judge whether covariates add substantially to a model’s predictive ability.
For the random forests, variable importance is assessed using an unscaled permutation test which measures the mean decrease in classification performance (proportion of cases classified correctly) after permuting each element of the set of predictors Xj , where j indexes each covariate, over all trees in the forest. Permuting important variables will result in a systematic decrease in classification accuracy, whereas permuting unimportant variables will result in a random decrease, or no decrease, in classification accuracy. The variable importance scores do not measure the importance of the variable conditional on the importance of the other predictors (they measure marginal importance), thus scores can be spurious. Although it is possible in principle to conduct a conditional permutation test, such a test is computationally infeasible given the large number of predictors in this study. A correlation matrix of all the predictors used in this study is available in the online Appendix. Although there are some highly correlated pairs, the covariates are not so highly correlated as to make this comparison uninformative. Notable are the correlations between Polity and its components, as well as those between the media coverage covariates from Ron, Ramos, and Rodgers (Reference Ron, Ramos and Rodgers2005). Youth bulges are negatively correlated with Polity and its components, and the INGO measure is positively correlated with Polity. To deal with the possible inflation of the importance scores of possibly unimportant covariates we set the number of variables selected at each node to 10 (the default is 5) and increase the total number of trees in the forest. Additionally, we bootstrap the permutation importance scores by taking samples from the full set of data (with replacement and of the same size as the full data), refitting the random forest, and recalculating the permutation importance scores 100 times. In our discussion of the results we present summary statistics of the bootstrapped sampling distribution for the permutation importance scores. Additionally, we estimate the concordance of ranked permutation importance across different values of the aforementioned tuning parameters in the online Appendix.
Our explanatory variables are drawn from the literature. We use indicators of concepts that are “usual suspect” covariates (i.e., standard control variables) as well as indicators for concepts whose relationships with repression are less well established. Table 1 lists the measures used below and the sources from which they were obtained. Full descriptions of these data can be found in the Appendix. In our cross-validation analysis we assess the increase in predictive validity which results from adding each variable to three different baseline models: one that includes only (the natural logs of) GDP per capita and population size, another that includes both of these variables and an indicator of civil war from the UCDP/PRIO armed conflict dataset (Themnér and Wallensteen Reference Themnér and Wallensteen2012),Footnote 39 and another that includes GDP per capita, population, and a lagged dependent variable. We employ the last of these specifications because, partly as a result of a significant coefficient for a lagged dependent variable in Poe and Tate (Reference Poe and Tate1994), it has become standard to include a lagged dependent variable in models of repression. There is also a theoretical argument which suggests that bureaucratic inertia and elite habituation to the use of violence creates strong patterns of temporal dependence in state repression (e.g., Davenport Reference Davenport2007b; Gurr Reference Gurr1988). To save space we present the cross-validation results from our third baseline specification in the Appendix, but these largely confirm our findings from the first two baseline models.
Measures and Sources

Several points about the variables used in the analysis are worth mentioning. First, for several of the concepts listed in Table 1 we use multiple measures. These include our measure of democracy, the Polity IV scale (Marshall and Jaggers Reference Marshall and Jaggers2009), for which we employ both the commonly used “democracy minus autocracy” scale, as well as each of the democracy scale components. One study analyzing the Polity data found that the aggregated scale primarily reflects the executive constraints component (Gleditsch and Ward Reference Gleditsch and Ward1997),Footnote 40 and studies of repression have found that the competition component of Polity is more strongly related to measures of repression than the other subcomponents (Bueno de Mesquita et al. Reference Bueno de Mesquita, Downs, Smith and Cherif2005; Keith Reference Keith2002). We obtain a similar result, which we discuss in more detail below.
We also employ multiple measures of INGO shaming. Three of these come from Ron, Ramos, and Rodgers (Reference Ron, Ramos and Rodgers2005) and were employed by Hafner-Burton (Reference Hafner-Burton2008). These are counts of the number of AI press releases and background reports issued about a particular country during a given year. These variables are all lagged by one year. Our other measure of INGO shaming comes from Murdie and Davis (Reference Murdie and Davis2012). This measure is based on events data and is a count of the annual number of conflictual actions sent by human rights organizations (beyond AI alone) towards a particular government. The constitutional protection data from Keith, Tate, and Poe (Reference Keith, Tate and Poe2009) also includes multiple measures, all found to be statistically significant in regressions using the PTS: provisions for a fair trial, provisions for a public trial, provisions stating that the decisions of high/constitutional courts are final, and provisions which require legislative approval to suspend constitutional liberties.
Second, as mentioned above, past results for some of the indicators in Table 1 are slightly mixed. These are the measures of shaming by INGO/HROs and Western media, and measures of ratification for two core UN human rights conventions: the International Covenant on Civil and Political Rights (ICCPR), and the Convention Against Torture (CAT). Hafner-Burton (Reference Hafner-Burton2008) finds that shaming by Amnesty International (AI) is actually positively associated with repression, but shaming by Western media bears no relationship to repression. Murdie and Davis (Reference Murdie and Davis2012) find a negative relationship between NGO shaming and repression conditional on NGO presence and shaming by other actors (such as governments), and Franklin (Reference Franklin2008) finds a similar relationship conditional on dependency on foreign aid and investment. Results using human rights treaties data have also been mixed, and we employ these indicators because of unexpected, statistically significant findings in the literature, and because we believe the volume of recent work on this topic justifies the inclusion of human rights treaty ratification.
Finally, many of the variables we use have substantial missingness. First, we restrict our analysis to the period 1981–1999, which is well covered by most of the variables we consider. Since the assumption that these data are missing at random is implausible, we use model-based imputation of the missing values prior to cross-validation.Footnote 41 We perform five imputations of the missing values, cross-validate our models on each imputed dataset, combine our discrepancy statistics across them, and then compute summary statistics. We now turn to the results from our analysis.
Results
For our cross-validation analysis, we adopted the following rule to determine whether a covariate is an important predictor of state repression: if the lower bound (the .025 quantile) of the prediction error for the model including that covariate is above the upper bound (the .975 quantile) of the prediction error for the baseline model, then the covariate is marginally important.Footnote 42 This is a rather strict rule, but it is justified since we are evaluating the performance of models which include the covariate in question against models that are stripped down relative to those common in the literature. In the interest of space we limit most of our discussion to the handful of variables that add the most predictive power and perform well across most of the models.Footnote 43 Figures 2–5 display the median prediction error (shown as dots) as well as the .975 and .025 quantiles of the sampling distribution of the error statistic (shown as lines) for each model we estimate.Footnote 44 In each figure a dashed line is placed at the .975 quantile (or .025 quantile, depending on the discrepancy statistic) of the error for the baseline model. The gray, horizontal bands in each figure highlight the baseline models.
Results from Cross-validation of Error from Linear (OLS) Models of Repression using (the natural logs of) GDP per Capita and Population as a Base Specification

Results from Cross-validation of Error from Ordinal Logistic Regression Models of State Repression using (the natural logs of) GDP per Capita and Population as a Base Specification

Cross-validation of Error from Linear Models (OLS) of the Same Form as Figure 2, but with a Base Specification which Consists of (the natural logs of) GDP per Capita and Population as well as Civil War

Cross-validation of Error from Ordinal Logistic Regressions of the Same Form as Figure 3, but with a Base Specification which Consists of (the natural logs of) GDP per Capita and Population as well as Civil War

The first two figures (Figures 2 and 3) show the consequences of adding different covariates to a model that includes only the natural logs of GDP per capita and population. A passing glance at these figures immediately conveys that civil conflict, for most measures of repression, adds much more predictive power to this baseline model than any other covariate examined here. This is consistent with one of the literature’s two principal findings, a phenomenon that has been labeled the “law of coercive response” (Davenport Reference Davenport2007a). The fact that this relationship is labeled a “law” gives some indication of its regularity. Though this result is strong, indicators of civil war overlap empirically with indicators of state repression: indicators of repression include information about noncombatant casualties during violent conflicts, and these casualties also contribute to a conflict reaching the death threshold necessary to classify it as a civil war. We return to this result in the discussion section below.
Clearly civil war predicts repression better than nearly all of the other covariates, but there are exceptions to this pattern. For the political imprisonment component of the CIRI physical integrity index, civil war is outperformed by the aggregated Polity scale, the CIRI judicial independence measure, and three of the components of the Polity democracy scale, most notably the political competition component. This latter result is consistent with previous studies (Bueno de Mesquita et al. Reference Bueno de Mesquita, Downs, Smith and Cherif2005; Keith Reference Keith2002), though no study we are aware of has noted that the Polity measure of democracy predicts political imprisonment more accurately than it does other kinds of government violence. While the performance of Polity and its democracy components is impressive, the ability of the aggregated scale, and the political competition component, to predict political imprisonment is driven by the problem noted above: the way Polity defines and operationalizes democracy makes any relationship between Polity and political imprisonment tautological, i.e., governments who engage in political imprisonment must be considered less democratic given the operational definition. Political imprisonment is the only component of CIRI that considers only violence directed at political opposition,Footnote 45 so it is necessarily related to the component of Polity that measures restrictions on political competition, and the aggregate Polity scale (which includes this component). And of course, since both the aggregate CIRI index and PTS include information about political imprisonment, Polity and the competition component are necessarily related to these measures as well. This is less of a problem with the other Polity components, especially the executive constraints component. We return to this point below after discussing our other results.
The other measure of government violence for which civil war adds less predictive power than other covariates is the torture component of the CIRI scale. For this indicator the CIRI measure of judicial independence and a measure of youth population from Urdal (Reference Urdal2006) employed by Nordås and Davenport (Reference Nordås and Davenport2013)Footnote 46 both add more predictive power to the baseline model than civil conflict. This is notable because the concepts measured by the these covariates have received relatively little attention in the literature. The results for judicial independence lends plausibility to the theoretical connection between strong courts/legal systems and violations of basic rights (e.g., North and Weingast Reference North and Weingast1989), while the result for youth bulges lends credence to the theory advanced in Nordås and Davenport (Reference Nordås and Davenport2013) that leaders apply repression in anticipation of dissent/conflict.
Figures 4 and 5 display results from cross-validation analyses in which the baseline model now includes civil war in addition to the natural logs of GDP per capita and population. Using the latent variable constructed by Fariss (Reference Fariss2014), the most predictive power is added by the measure of political competition from Polity, followed by youth bulges and the CIRI judicial independence indicator. Common law, oil rents, constitutional provisions for fair trials, and PTAs with human rights clauses also do well. For the aggregated CIRI scale, the CIRI measure of de facto judicial independence adds the most predictive power to the baseline model, followed by the measure of youth bulges and Polity’s executive constraints and competition scales. Fair trial provisions, oil rents, and common law legal systems, concepts which have only recently received attention in the literature, also perform very well in this model. For the linear model using the PTS,Footnote 47 youth bulges, political competition, judicial independence, common law legal systems, executive constraints, and fair trial provisions perform best. The impressive performances of constitutional provisions for fair trials and common law legal heritage, in addition to judicial independence, justify a stronger focus on legal institutions in future studies of repression, and lend further support to theoretical insights from the comparative institutions literature. This is another point to which we return below.
Turning to results from the individual CIRI components, the political imprisonment models are largely consistent with those above: the Polity scale and its democracy components perform best, particularly the competition scale. Judicial independence, fair trial provisions, and oil rents also add a substantial amount of predictive power. The results pertaining to torture are also consistent with the analysis above, with judicial independence and youth bulges adding the most predictive power to the baseline model.
The other two CIRI components, which measure disappearance and extrajudicial killing, behave much differently than the other indicators used in this study. Precious few of the covariates included in the analysis add much predictive power to the baseline model. Strict adherence to the decision rule mentioned above leads to the conclusion that only judicial independence, oil rents, and youth bulges increase the predictive power of the second baseline model for disappearance. For extrajudicial killing, only youth bulges, judicial independence, and one of the (lagged) NGO shaming indicators (Western media reports) improve the performance of the baseline model. The relatively poor performance of the covariates in these models is partly due to the fact that killings and disappearances simply occur with less frequency than political imprisonment and torture.Footnote 48 But the analysis does suggest that there are important differences between the separate components of the physical integrity scale that are ignored when one uses the aggregate scale. One potentially important difference between these two components and the political imprisonment/torture scales is that disappearances and extrajudicial killings occur, by definition, outside of the legal system. This is perhaps another reason why, with the exception of judicial independence, the features of legal systems that do well in predicting political imprisonment and torture do not add much predictive power to models of disappearances and killings. More fundamentally, this suggests that theories of repression need greater refinement. We return to this point also in our conclusion.
Figures displaying results for our third baseline specification, which includes a lagged dependent variable in addition to GDP per capita and population, can be found in the Appendix. These results are largely consistent with the results presented from the first two specifications. Not surprisingly, the third baseline model provides a better fit than the first two: inclusion of a lagged dependent variable markedly improves predictive validity, which lends support to theories which suggest that governments can become habituated to the use of violence to resolve political conflict (Gurr Reference Gurr1988). This improvement dampens the predictive power that other covariates add to the model, with the result being that even fewer covariates perform well in the cross-validation analysis. Civil war still improves the fit of all the models. For linear models using the aggregate scales judicial independence, youth bulges, and Polity’s political competition scale still do well. For the disappearance and killing components of the CIRI scale only civil war improves out-of-sample fit. The results for the political imprisonment scale are consistent with the other two baseline models: Polity and its components do very well, as do the measures of judicial independence, oil rents, and fair trial provisions. For the CIRI torture scale judicial independence and youth bulges also improve model fit.
Ten of the 31 covariates included in the analysis failed to add predictive power to any of the baseline models. These are military regime, British colonial status, two of the three variables measuring participation in IMF and World Bank structural adjustment programs (World Bank structural adjustment program participation measured alone marginally improves the fit of some models), constitutional provisions stating that high court decisions are final, constitutional provisions giving the legislature authority over declaration of states of emergency, the measure of HRO shaming used by Murdie and Davis (Reference Murdie and Davis2012), foreign direct investment, ratification of the ICCPR, and international war. That British colonial status and international war fail to improve the fit of our baseline models is surprising given that these are often included as standard control variables. This underscores that statistical significance is not the best criterion to use for variable selection. A number of variables only marginally improve model fit, despite being technically important according to our decision rule.
For the most part features of domestic politics, rather than international politics, are adding the most explanatory power to these models. This is consistent with previous empirical findings in the literature: analyses of international determinants of human rights practices such as international economic standing (Hafner-Burton Reference Hafner-Burton2005a), international law (Conrad and Ritter Reference Conrad and Ritter2013; Hathaway Reference Hathaway2002; Hill Reference Hill2010; Keith Reference Keith1999; Lupu Reference Lupu2013; Neumayer Reference Neumayer2005; Powell and Staton Reference Powell and Staton2009; Simmons Reference Simmons2009), and NGO shaming (Franklin Reference Franklin2008; Hafner-Burton Reference Hafner-Burton2008; Murdie and Davis Reference Murdie and Davis2012) tend to produce inconsistent results. The contrast between results for domestic/international factors suggests that the institutional (political and legal) constraints that exist at the domestic level are more important for the decision to repress than are any international constraints arising from treaties, NGO activity, or a state’s situation in the global economy. However, as we discuss below, the relationships between international political factors and repression may be more complex than the cross-validation analysis allows for. But this analysis suggests that international political factors are, in general, not as useful for predicting the level of repression as domestic factors.
We next turn to the permutation importance measures from the random forests, which are depicted in Figures 6 and 7. These figures show each covariate’s importance score from the permutation test described above. For the most part the results of this analysis echo those from the cross-validation: across most dependent variables, civil war, youth bulges, and judicial independence remain among the most important predictors. As above, Polityand its various components, particularly the competition component, do extremely well in the political imprisonment model. Constitutional provisions for fair trials and common law legal systems do not do as well in this analysis, though fair trial provisions is an important predictor of political imprisonment. The most notable contrasts with the cross-validation results discussed above are the performances of trade openness and INGO presence. While neither of these performed especially well in the cross-validation analysis,Footnote 49 they score relatively high on our variable importance measure; trade openness is judged to be among the most important predictors of the CIRI killing scale, the CIRI torture scale, the dynamic latent variable from Fariss (Reference Fariss2014), the aggregated CIRI scale, and the PTS, which gives further credence to theories which posit some relationship between general economic openness and repression. The measure of INGO presence does well relative to other variables for both the CIRI torture scale and the PTS. This suggests that these variables may have an interactive or nonlinear relationship with measures of repression, which suggests that international factors broadly may be related to state violence in complex ways. The impact of trade openness and INGO presence may be conditional on other variables, for instance.
The Marginal Permutation Importance of Independent Variables Estimated Using Random Forests, with the CIRI Components as Dependent Variables

The Marginal Permutation Importance, as Described in Figure 6, with the CIRI Physical Integrity Index, the PTS, and the Dynamic Latent Score Estimated by Fariss (Reference Fariss2014) as the Dependent Variables

As a more general point, it is worth noting that statistical significance does not perfectly correlate with variable importance. There is certainly a positive correlation between the two, but statistical significance is neither necessary nor sufficient for predictive validity. To illustrate that statistical significance is not sufficient for predictive validity, consider Figure 8, which displays coefficient estimates and 95% confidence intervals for all variables from linear models using the aggregate repression scales as dependent variables. These models are fit using all of the available data and include GDP per capital and population size as control variables.Footnote 50 Notable in each panel of Figure 8 is the coefficient estimate for international war, which is larger than any other coefficient save that for civil war. Contrast this with Figure 2, which indicates that international war adds no predictive power to either model. International war is a very rare event and thus in this instance, where the distribution of values in the dependent variable is much more balanced, it will be unable to improve predictive validity markedly. Additionally, the precision of the coefficient estimate is likely misleading due to the inflated statistical power that results from assuming the observations are independent. The larger point about predictive power versus significance is in line with the findings of at least one previous study (Ward, Greenhill, and Bakke Reference Ward, Greenhill and Bakke2010), but bears mentioning as it is not widely appreciated.
Coefficient Estimates from Linear (OLS) Models of the Dependent Variable

DISCUSSION/CONCLUSION
What do these results tell us about the state of the empirical literature on repression? The two concepts most widely recognized in the literature as important have predictive power and exhibit relationships with repressive violence that generalize beyond particular sets of data: civil war and democracy. However, the importance of these results is tempered by the problems we note above. The first of these results strongly suggests, in line with previous studies, that when government/dissident military violence produces a large number of deaths, governments often target noncombatants with violence. But again, this result is tainted by measurement problems. Indicators of civil war record only battle-related deaths, but will still pick up a subset of the violations recorded by PTS and CIRI. Many government-inflicted casualties in civil conflicts will be noncombatants and thus are likely to be picked up in measures of state repression, at least those that measure deadly uses of force (i.e., not the political imprisonment scale). Of obvious interest is the reciprocal relationship between dissident and government violence which results in conflicts escalating to the point where they are classified as civil wars,Footnote 51 but it is not reasonable to expect to capture these dynamics in annual, country-level data. Given that indicators of civil war tend to dampen the predictive power of many of the other covariates considered here, and will overlap empirically with the most widely available measures of repression, we would urge researchers to consider excluding them from their models.Footnote 52
The relationship between democracy and repression is also general, but suffers from similar problems. To measure democracy we employed the Polity data, which contains the most commonly used measures in the literature. Results were particularly strong with respect to the “competitiveness of participation” component, and this component along with the other components and the aggregated scale added a tremendous amount of predictive power to the political imprisonment models. Part of this result is due to the fact that a government that imprisons their political competitors cannot be considered “fully” democratic, given the way democracy is usually operationalized in this literature. This point is further underscored by the Polity codebook (Marshall and Jaggers Reference Marshall and Jaggers2009, p. 26), which makes it clear that the competition component in particular partly measures repression. The lowest category, called “repressed,” is defined as follows:
No significant oppositional activity is permitted outside the ranks of the regime and ruling party. Totalitarian party systems, authoritarian military dictatorships, and despotic monarchies are typically coded here. However, the mere existence of these structures is not sufficient for a “Repressed” coding. The regime’s institutional structure must also be matched by its demonstrated ability to repress oppositional competition (emphasis added).
Examples of activities that may justify coding a state in the bottom three categories of this scale are the following:
Systematic harassment of political opposition (leaders killed, jailed, or sent into exile; candidates regularly ruled off ballots; opposition media banned, etc.) (emphasis added).
Thus the fact that Polity predicts very well the imprisonment of political opponents and the aggregated repression scales, which both include information about political imprisonment, should not be surprising. This means that one of the strongest results in the literature is partially the result of estimating what are essentially tautological statistical models.
This is not to say that the predictive power of indicators of democracy is entirely meaningless. Notably, the executive constraints component of Polity does well in most of the models,Footnote 53 and this component does not suffer from the measurement issues that plague the competition component. But researchers who wish to employ the PTS or CIRI data should avoid using the aggregated Polity scale as well as the competition component. For the PTS this problem is especially bad since the scale cannot be disaggregated to exclude political imprisonment. Unfortunately this is also a problem for the CIRI scale to the extent that governments are repressing political opposition through the use of torture, kidnapping, and summary execution. This is because targeting political opponents with these tactics also reduces a government’s level of democracy as defined/measured by the Polity scale. For future work, correcting this problem entails removing government violence that explicitly targets political opponents from the study’s dependent variable, if one wishes to employ the aggregate Polity scale or the political competition scale as a covariate. Or, one could model violence against political opposition but remove Polity/political competition from the list of covariates included in the model.
Future theoretical work on repression should also take this point seriously, which entails developing arguments about why governments would have incentives to repress political opponents that do not use political competition as an explanatory concept. One possibility is suggested by the results for oil rents, which DeMeritt and Young (Reference DeMeritt and Young2013) theorize as related to repression because of the lack of incentives to protect human rights that results from increasing nonreliance on citizen-generated revenue. They note that this is consistent with arguments from the literature on democratization (e.g., Bueno de Mesquita and Smith Reference Bueno de Mesquita2009; Huntington Reference Huntington1991). This is a nice theoretical insight, since explanations for why governments would stop violently suppressing political competition are, in some sense, explanations for the emergence of democracy. Future work would benefit from incorporating more insights from the democratization literature about how other economic conditions, for example asset mobility and inequality, affect leaders’ incentives to repress political opposition (see, e.g., Acemoglu and Robinson Reference Acemoglu and Robinson2005; Boix Reference Boix2003; Clark, Golder, and Golder Reference Clark, Golder and Golder2013). This might help to further understand the relationship between per capita wealth and repression, which is empirically well established but very rarely discussed in theoretical terms.
Other promising results here are those for certain features of domestic legal systems, including judicial independence, constitutional guarantees for fair trials, and common law heritage. Judicial independence in particular performed well in both analyses, outperforming even civil war in predicting political imprisonment and torture. As discussed above, these results are consistent with the comparative literature on institutional constraints on government behavior, which views an independent judiciary as crucial in limiting government encroachment on basic rights (see especially North and Weingast Reference North and Weingast1989; Vanberg Reference Vanberg2005; Weingast Reference Weingast1997). This also suggests that insights from theories of judicial behavior and the construction of judicial power may be useful for future work on repression (See Carrubba Reference Carrubba2009; Staton Reference Staton2006; Staton and Moore Reference Staton and Moore2011; Vanberg Reference Vanberg2005).
There is a nascent literature on domestic courts and human rights violations, but most of this literature examines the interplay between domestic courts and international legal obligations (Conrad Reference Conrad2012; Conrad and Ritter Reference Conrad and Ritter2013; Hathaway Reference Hathaway2007; Powell and Staton Reference Powell and Staton2009; Simmons Reference Simmons2009). The results here strongly suggest that the relationship between domestic courts and repression is general and does not depend on a government’s ratification status for various international human rights treaties, so studying the impact of domestic courts themselves on repression would be useful.Footnote 54
Regarding constitutional rights protections, the results for fair trial provisions suggest that formal legal protection of basic rights may be more than a “parchment barrier” (See Keith, Tate, and Poe Reference Keith, Tate and Poe2009), and justify more attention to the law itself, including criminal trial procedures, in future studies.Footnote 55 The performance of the common law heritage measure used by Mitchell, Ring, and Spellman (Reference Mitchell, Ring and Spellman2013) also suggests that trial procedures and judicial behavior are relevant to research on state repression; the theoretical argument connecting common law systems to respect for rights focuses on the trial procedures typical of common law systems (adversarial trials, oral argumentation) and the principle of stare decisis, i.e., that legal precedent constrains subsequent interpretation. Overall, legal institutions have received far less attention in the literature than democratic political institutions, and the performance of these three legal institutions merits further research. Further, since these measures of legal institutions are not tautologically related to commonly used measures of repression they represent a more fruitful path for future research than additional studies examining the relationship between the Polity scale and PTS/CIRI.
Another promising result was the excellent performance of the youth bulges measure used by Nordås and Davenport (Reference Nordås and Davenport2013). The theoretical reason for the relationship between a large per capita youth population and repression is preemptive action, on the part of the government, to prevent large-scale rebellion. The strength of this result suggests that demographic factors beyond mere population size should be more closely examined in the future.
While indicators of potential international influences on repression did not perform as well as features of domestic politics, trade openness in INGO presence performed well in our random forest analysis, which allows for more complex relationships (nonlinear/interactive) than the cross-validation analysis. This suggests that some of the inconsistent results in this literature may be due to complicated relationships between international political factors and repression that commonly used models will fail to detect. Thus rather than downplay the importance of these factors for future research, we would suggest that the complex nature of these relationships is something that deserves more attention.
Another notable finding was that the performance for most covariates was uneven across indicators of repression. Most of the covariates that perform well do so for the aggregate scales and the CIRI political imprisonment and torture scales, but not the disappearance or killing scales. This means that theoretically motivated models of repression are often explaining only part of what they are supposed to explain. As noted above, this is partly due to the relative rarity of disappearances and summary executions. Still, most analyses examine all of these practices together, treating them as homogenous, and the results above suggest that the different repressive acts measured by PTS/CIRI may be driven by different processes. Thus researchers would do well to not simply assume a priori that their covariates are related to each practice identically, i.e., they should disaggregate these indicators if possible.Footnote 56
In short, our analysis suggests that there are many potential, fruitful paths for future research on state repression. It is not our intention to treat these results as the final, definitive statement about what are the “most important” causes of repression. Rather, we have shown that some of the hypotheses advanced in the literature receive much stronger support than others, offered an appraisal of existing explanations for repression in light of these results, and suggested how the patterns our analysis reveals can usefully inform future theoretical and empirical research on this topic.
The broader problem we outline with respect to the repression literature, i.e., attention to statistical significance alone, is one that is common in many areas of political science research. Researchers in all subfields should supplement their usual analysis with some examination of model fit (as measured by various statistics such as RMSE, area under the ROC curve (for binary response models), likelihood-based statistics like AIC, etc.) and in particular an examination of whether including covariates that their theory suggests are important improves the fit of the model. Just as important, some effort should be made to assess whether the inferences drawn from a model generalize to other sets of data. Cross-validation addresses both of these problems, is easy to understand, and fits comfortably with the regression analyses that political scientists often conduct, so we would urge researchers to familiarize themselves with these techniques.Footnote 57
A final point is that prediction per se was not our goal. If it was, there are several ways we could improve the accuracy of the regression models used in the cross-validation analysis. We mention above the improved accuracy that results from the inclusion of a lagged dependent variable. More complicated strategies for modeling temporal dynamics may also be helpful,Footnote 58 though data on repression are usually collected at a high level of temporal aggregation. Mixture models, such as “zero-inflated” models, offer another promising approach (see, e.g., Bagozzi Reference Bagozzi2013; Bagozzi et al. Reference Bagozzi, Hill, Moore and MukherjeeForthcoming). As a related point, the estimators we use treat these observations as independent, which is standard practice in the literature, but using a model that more realistically accounts for the structure of the data would undoubtedly result in better predictions.Footnote 59 Most importantly, we wish to stress that predictive validity should be used more often to evaluate the accuracy of theoretical explanations for repressive government violence.
Online materials
To view online material for this article, please visit http://zmjones.com/static/papers/eeesr_appendix.pdf
APPENDICES
A Data Descriptions
Data on population and trade come from Gleditsch (Reference Gleditsch2002). These are data from the Penn World Tables (Summers and Heston Reference Summers and Heston1991) with missing values imputed using information from the CIA World Factbook and procedures described fully in Gleditsch (Reference Gleditsch2002).
The measure of youth bulges used above comes from Urdal (Reference Urdal2006), who uses demographic data from the UN to construct a measure of the proportion of the adult population (older than 15) that is younger than 25.
The indicator of oil rents is due to Ross (Reference Ross2006), and measures the total value of oil and natural gas production, accounting for extraction costs. This figure is divided by mid-year population.
Data on civil and interstate war come from the UCDP/PRIO armed conflict data set (Themnér and Wallensteen Reference Themnér and Wallensteen2012). The civil war variable is equal to 1 for all years in which a country experienced conflict between the government and rebel groups resulting in at least 1,000 battle-related deaths. The interstate war variable is equal to one for years in which a country’s government was involved in a militarized conflict with another government resulting in at least 1,000 battle deaths.
All of our measures of democracy come from the Polity IV regime characteristics data (Marshall and Jaggers Reference Marshall and Jaggers2009). The democracy component of Polity is comprised of four components which measure competitiveness of executive recruitment, openness of executive recruitment, executive constraints, and the competitiveness of participation. We use each of these individual components in the analysis. The most commonly used indicator of democracy results from subtracting the aggregated autocracy scale (which measures the four characteristics above in addition to the regulation of participation) from the aggregated democracy scale. We also use this measure in the analysis.
Information on military regimes and leftist regimes comes from the Database of Political Institutions (Beck et al. Reference Beck, Clarke, Groff, Keefer and Walsh2001). The military regime variable is coded 1 if the chief executive is a military officer or an officer who has not formally retired from the military before assuming office. The leftist regime variable is coded 1 for chief executives identified as communist, socialist, social democratic, or left-wing based on their economic policies.
Data on constitutional provisions come from Keith, Tate, and Poe (Reference Keith, Tate and Poe2009). These are all binary and are created by coding the text of national constitutions. The variables we use indicate the presence of provisions for a fair trial, provisions for a public trial, provisions stating that the decisions of high/constitutional courts are final, and provisions which require legislative approval to suspend constitutional liberties.
The measure of common law legal systems comes from Powell and Mitchell (Reference Powell and Mitchell2007). This is a binary variable coded 1 if a country’s legal system has primarily features of a common law system. Other possible categories are civil law, Islamic law, and mixed legal system.
Measures of trade openness and foreign direct investment both come from the World Bank’s World Development Indicators (Bank Reference Bank2012). These measure trade as a percentage of GDP and FDI net inflows as a percentage of GDP.
Indicators for participation in IMF and World Bank structural adjustment programs come from Abouharb and Cingranelli (Reference Abouharb and Cingranelli2007). We use three binary indicators, one which is coded 1 if a government is currently participating in an IMF structural adjustment program, another which is equal to 1 if a government is participating in a World Bank structural adjustment program, and another which is coded 1 if a government is participating in structural adjustment programs with both the World Bank and the IMF.
Data on preferential trade agreements (PTAs) with human rights clauses comes from Spilker and Bohmelt (Reference Spilker and Bohmelt2013). This variable is coded 1 for all years a government is a member of at least one PTA with a “hard” human rights clause. A hard clause is defined as one that explicitly mentions human rights principles and also declares that the benefits of the agreement are conditional on observing those principles.
B Additional Cross-Validation Results
Cross-validation of Error from Linear Models (OLS) of the Same Form as Figure 2, but with a Base Specification which Consists of (the natural logs of) GDP per Capita and Population as well as a Lagged Dependent Variable

Cross-validation of Error from Ordinal Logistic Regressions of the Same Form as Figure 3, but with a Base Specification which Consists of (the natural logs of) GDP per Capita and Population as well as a Lagged Dependent Variable


C Coefficient Estimates
Our measure of INGO presence comes from Hafner-Burton and Tsutsui (Reference Hafner-Burton and Tsutsui2005), and is a count of the number of INGOs of which a government’s citizens are members. Two of our three INGO shaming measures come from Ron, Ramos, and Rodgers (Reference Ron, Ramos and Rodgers2005). These are counts of the annual number of press releases and background reports issued by Amnesty International about a particular country. From Murdie and Davis (Reference Murdie and Davis2012) we use an events data-based measure which is a count of the annual number of conflictual actions human rights organizations send to a particular government. As a fourth shaming measure we use another variable from Ron, Ramos, and Rodgers (Reference Ron, Ramos and Rodgers2005) which measures the annual, average number of stories about a particular country published in Western media outlets (Newsweek and The Economist) which mention human rights practices.
Finally, our measures of UN treaty ratification status are taken from the UN website via the untreaties utility.Footnote 60 We use two indicators, one coded 1 for every year a country has ratified the Convention Against Torture, and another indicating ratification status for the International Covenant on Civil and Political Rights.
Coefficient Estimates of the Same form as Figure 8, with the Base Specification being the Natural Logs of GDP per Capita and Population in Addition to Civil War

Coefficient Estimates of the Same form as Figure 8, with the Base Specification being the Natural Logs of GDP per Capita and Population in Addition to a Lagged Dependent Variable

Coefficient Estimates from Ordinal Logistic Regression Models of the Dependent Variable

Coefficient Estimates of the Same Form as Figure 15, with the Base Specification being the Natural Logs of GDP per Capita and Population in Addition to Civil War

Coefficient Estimates of the Same Form as Figure 15, with the Base Specification being the Natural Logs of GDP per Capita and Population in Addition to a Lagged Dependent Variable


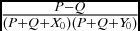

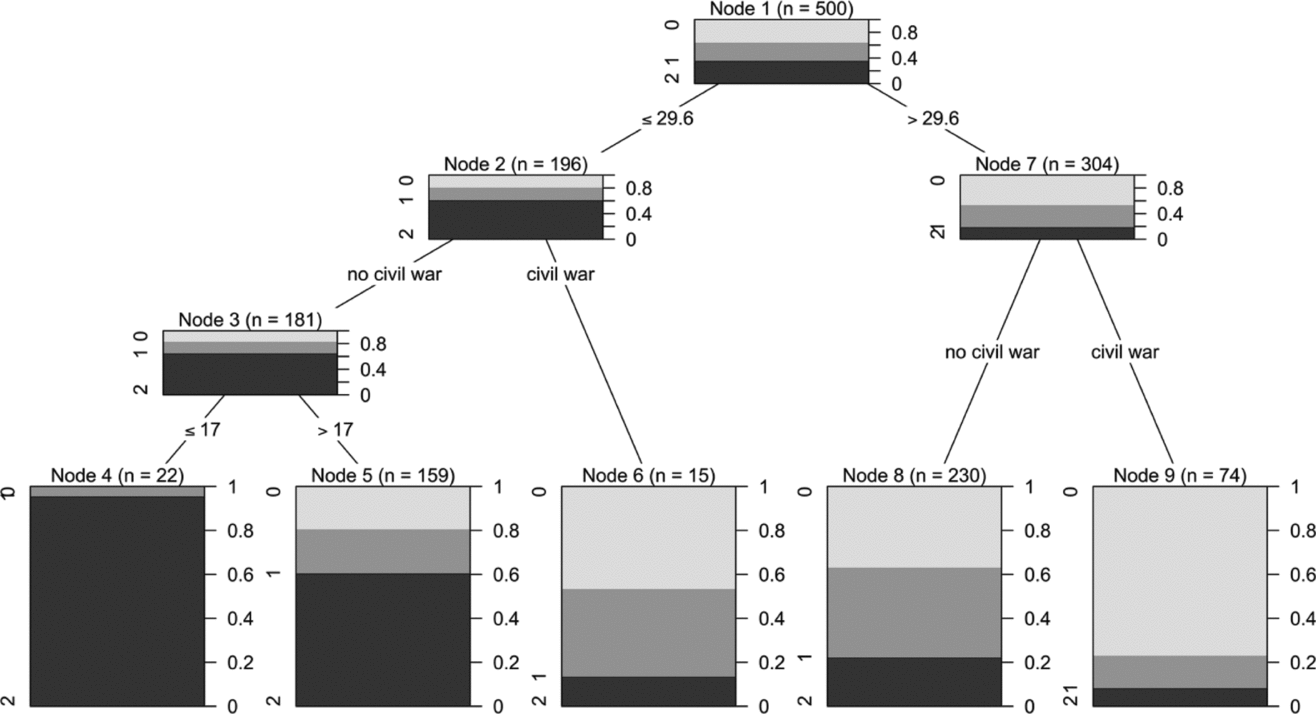
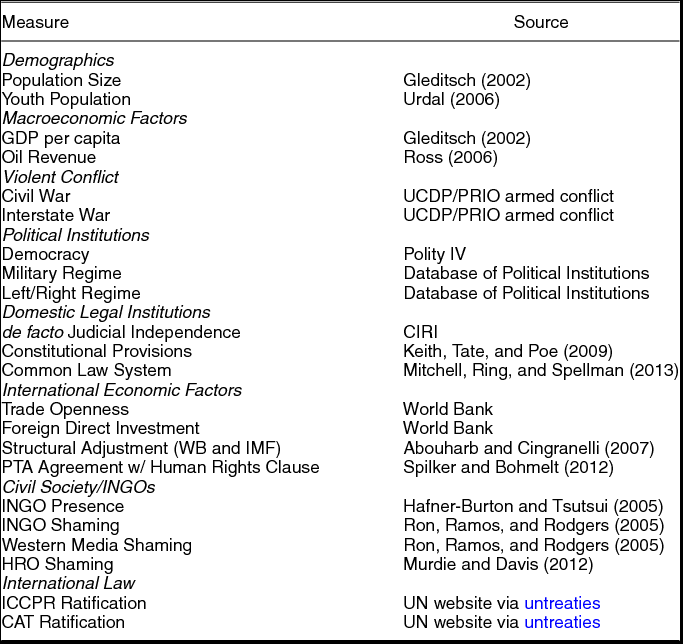
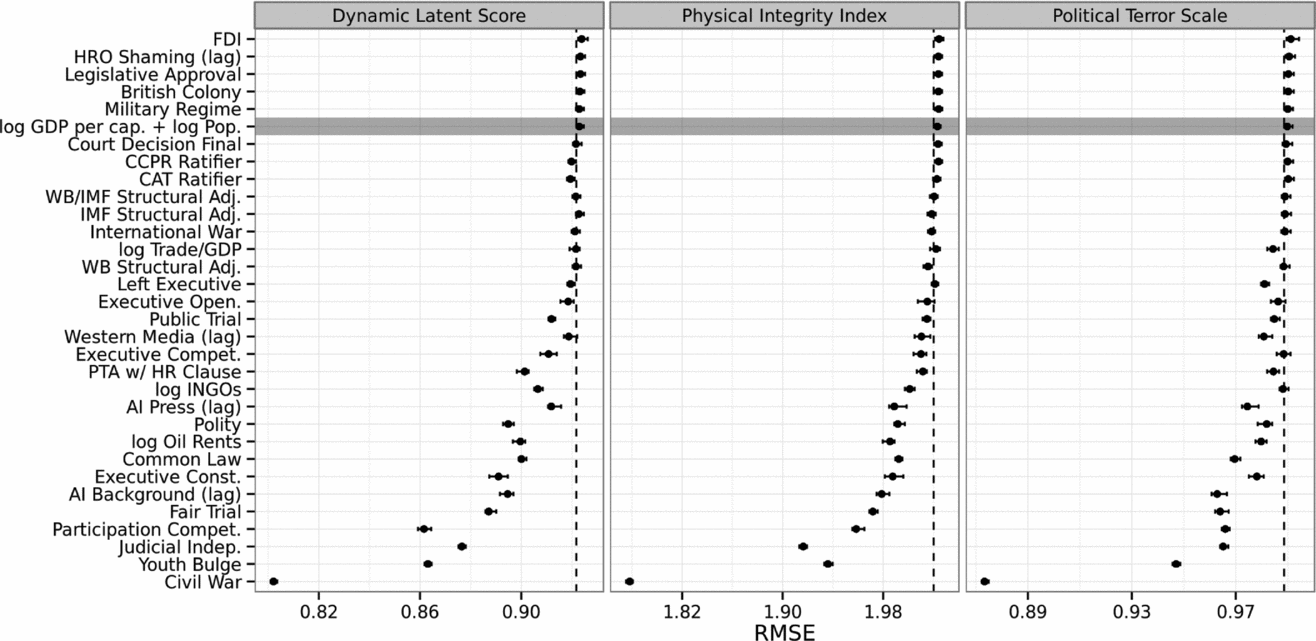
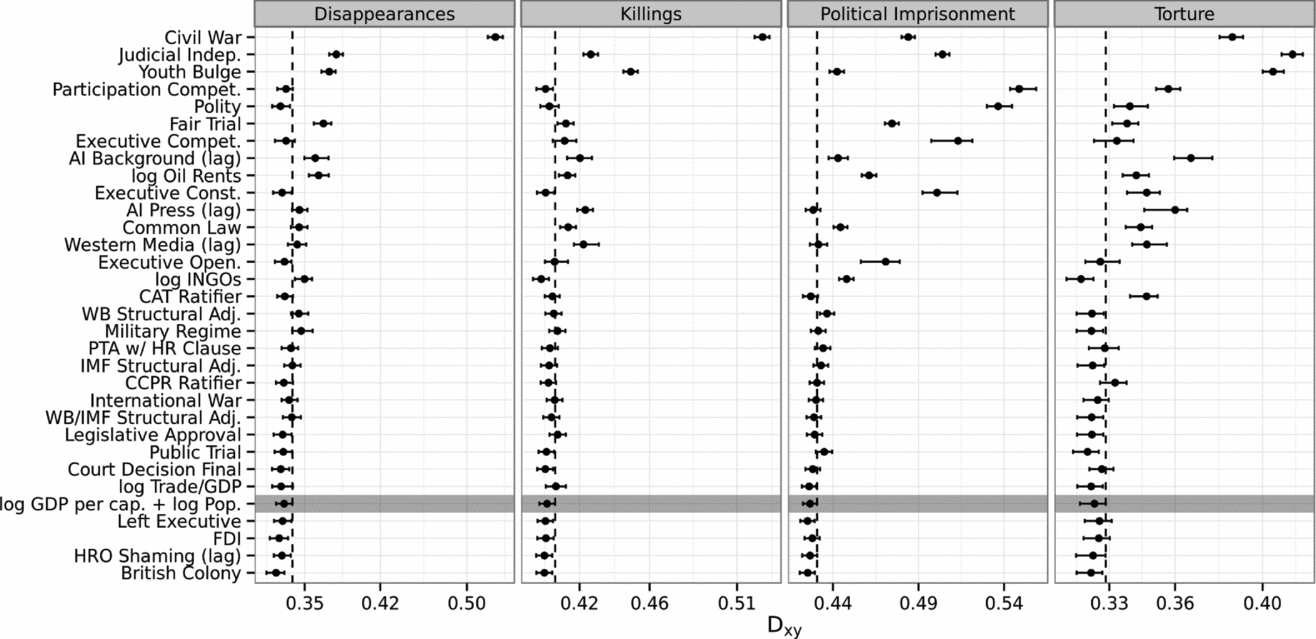
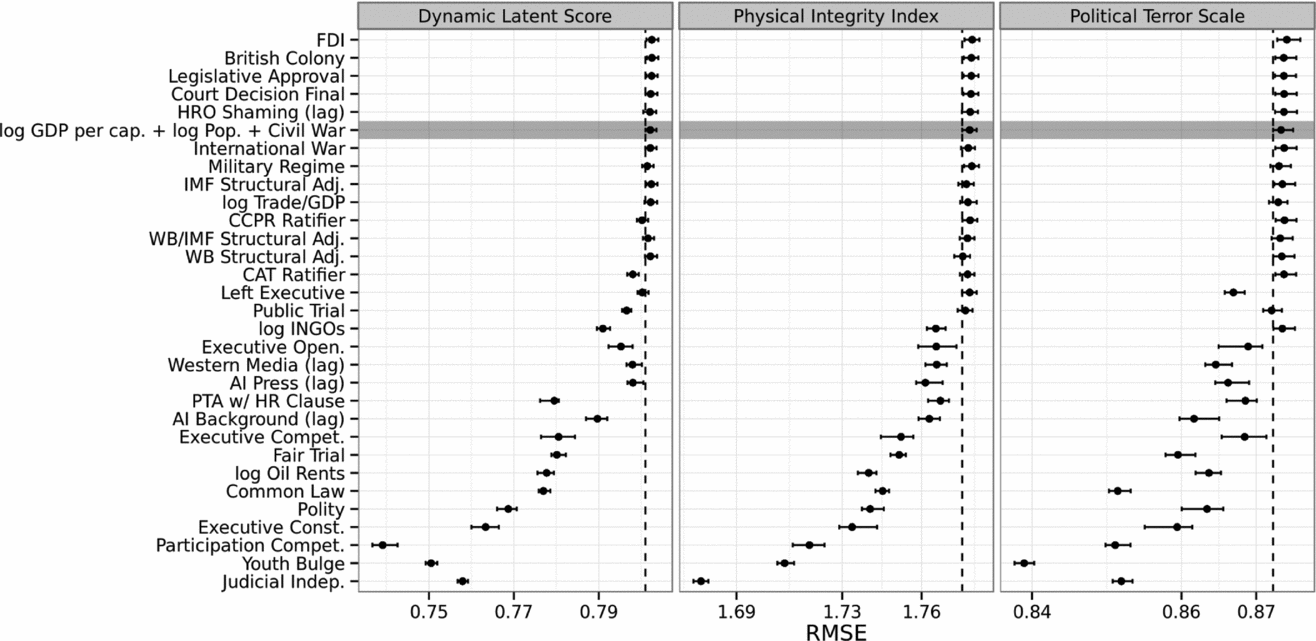
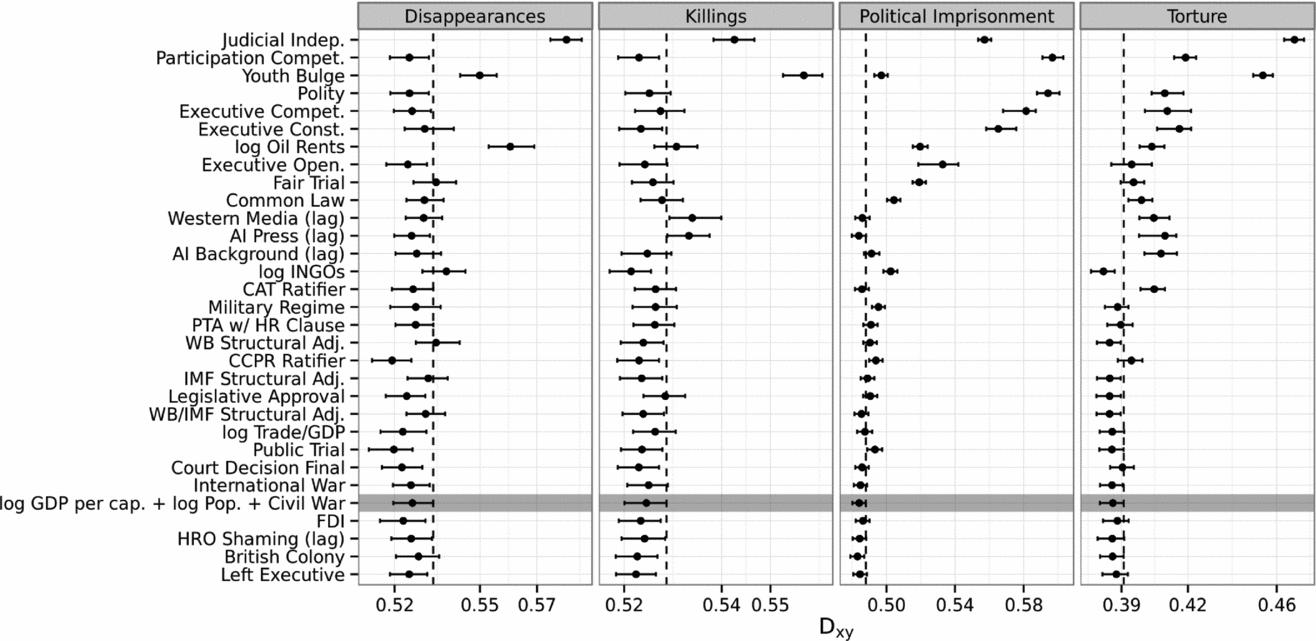
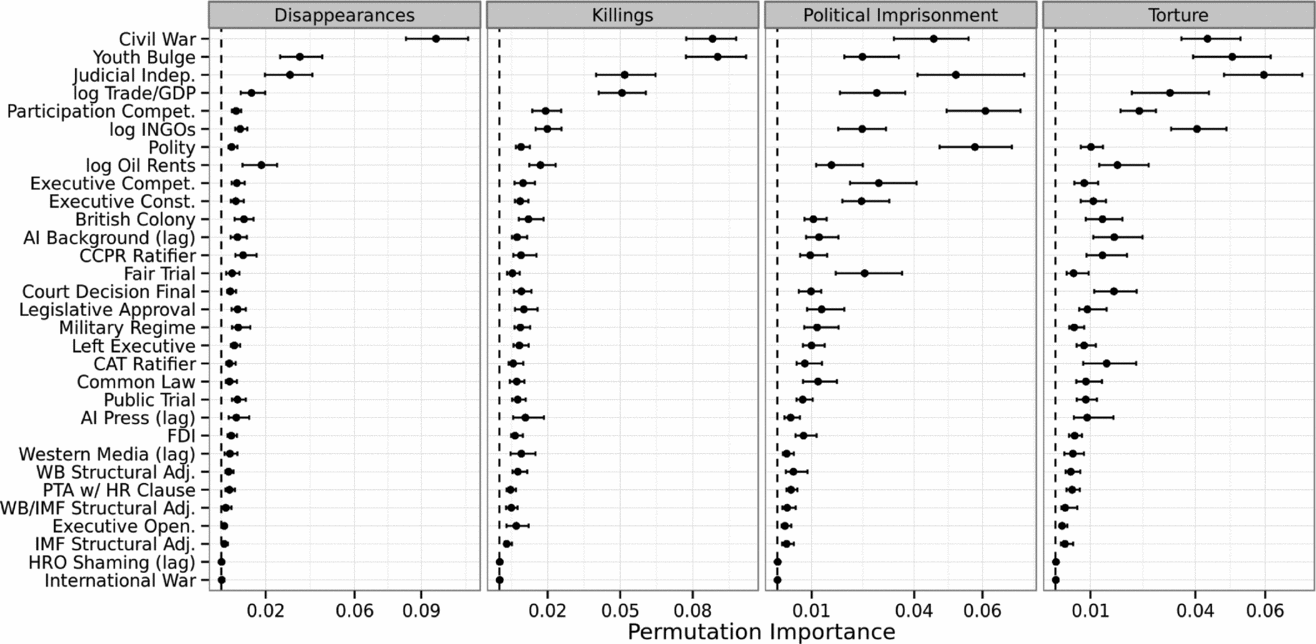
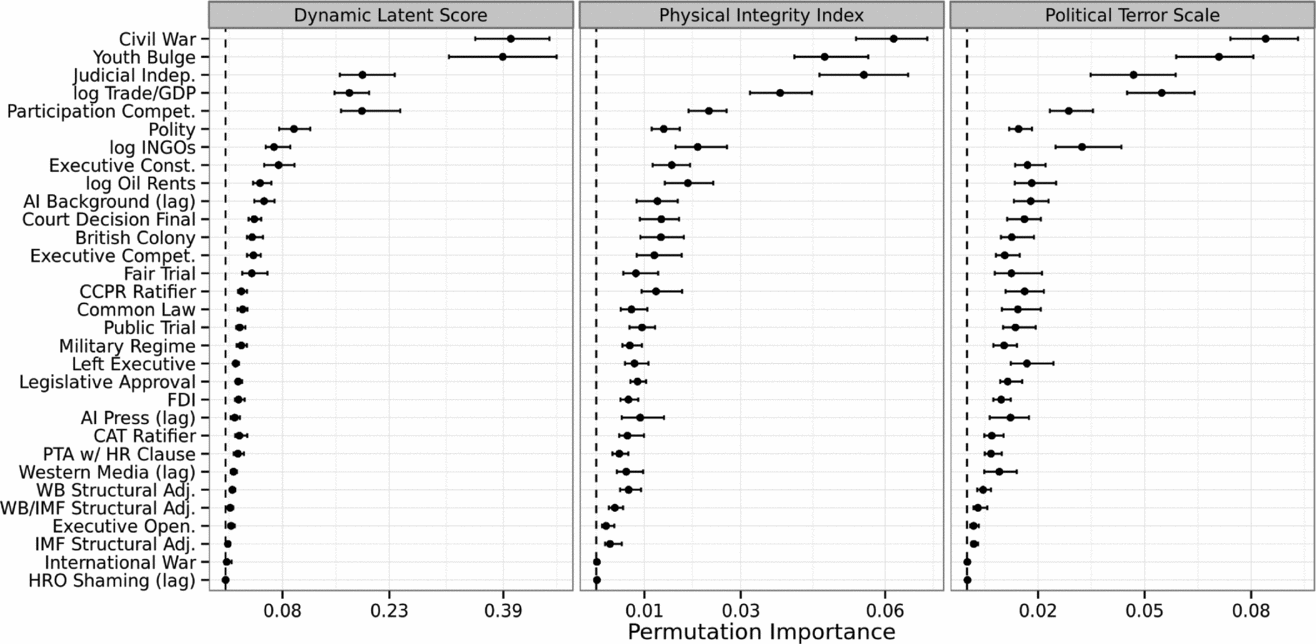
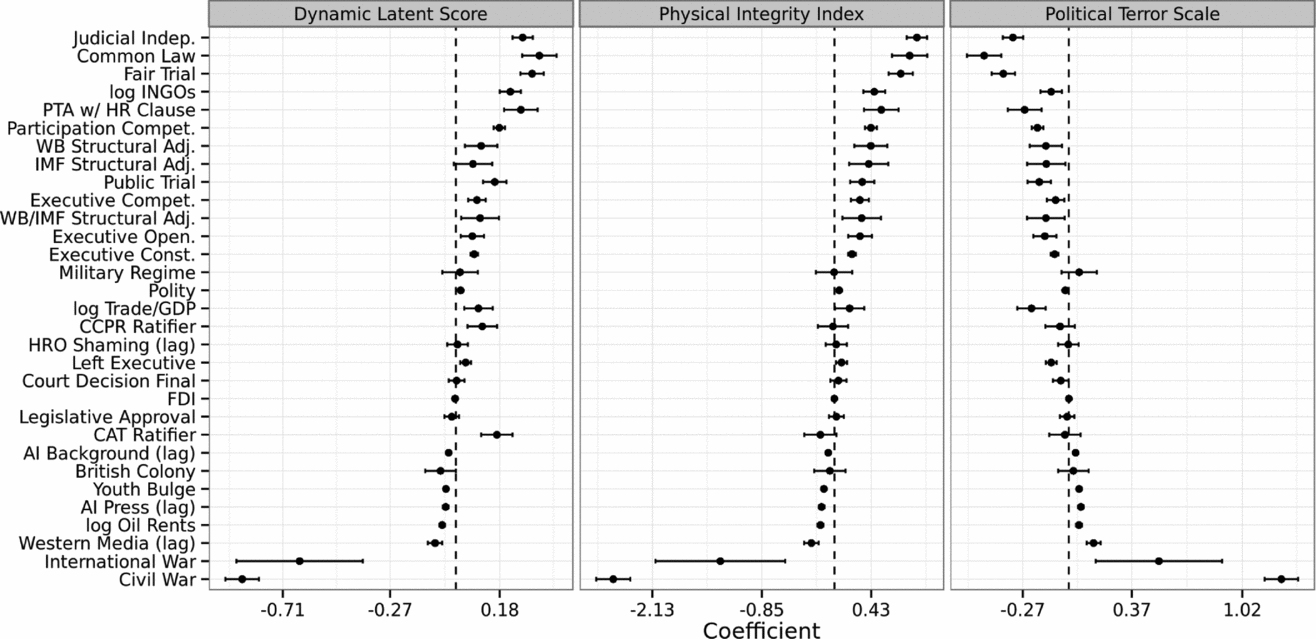
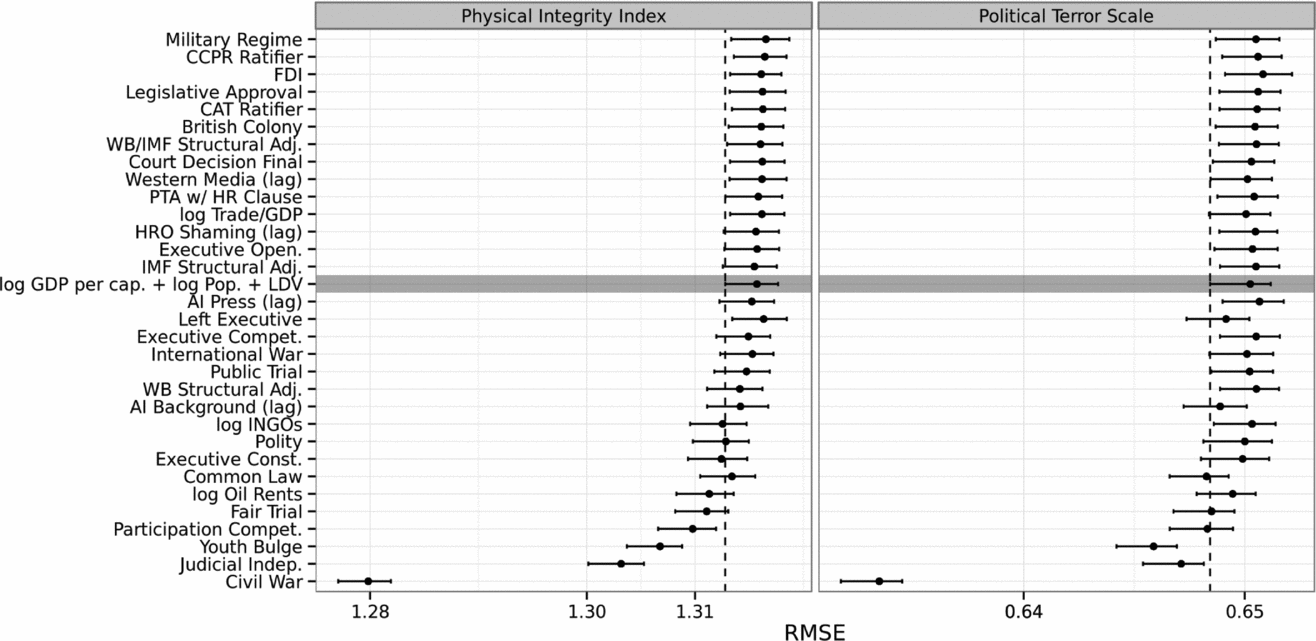
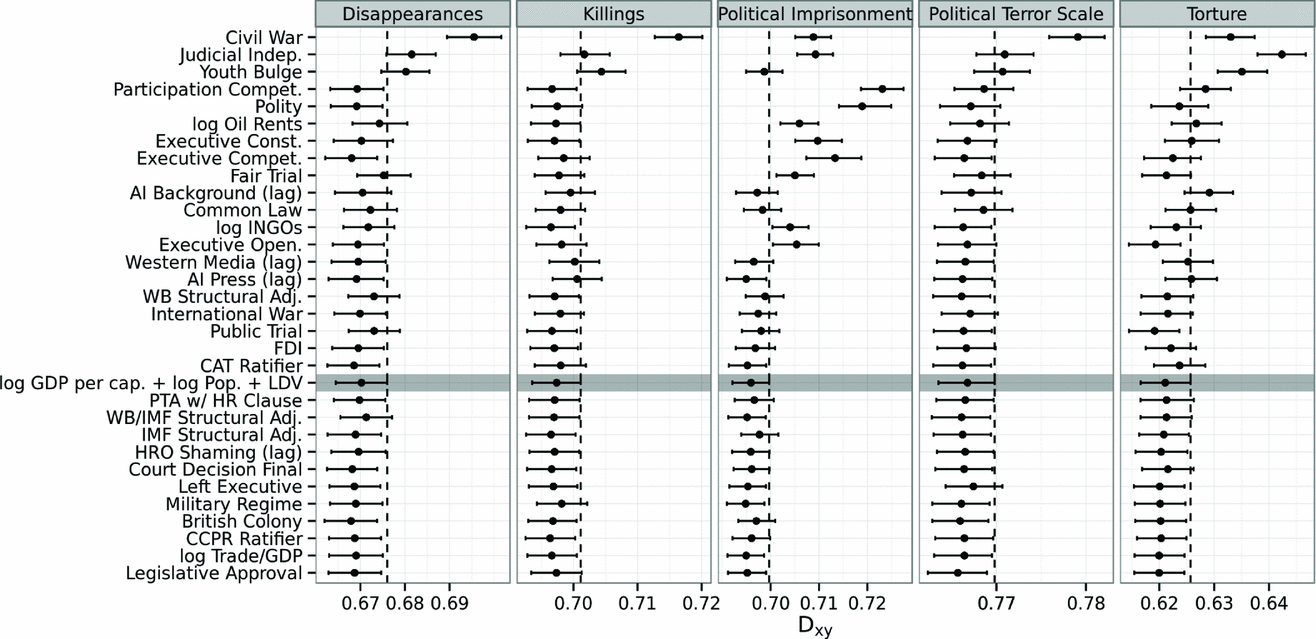
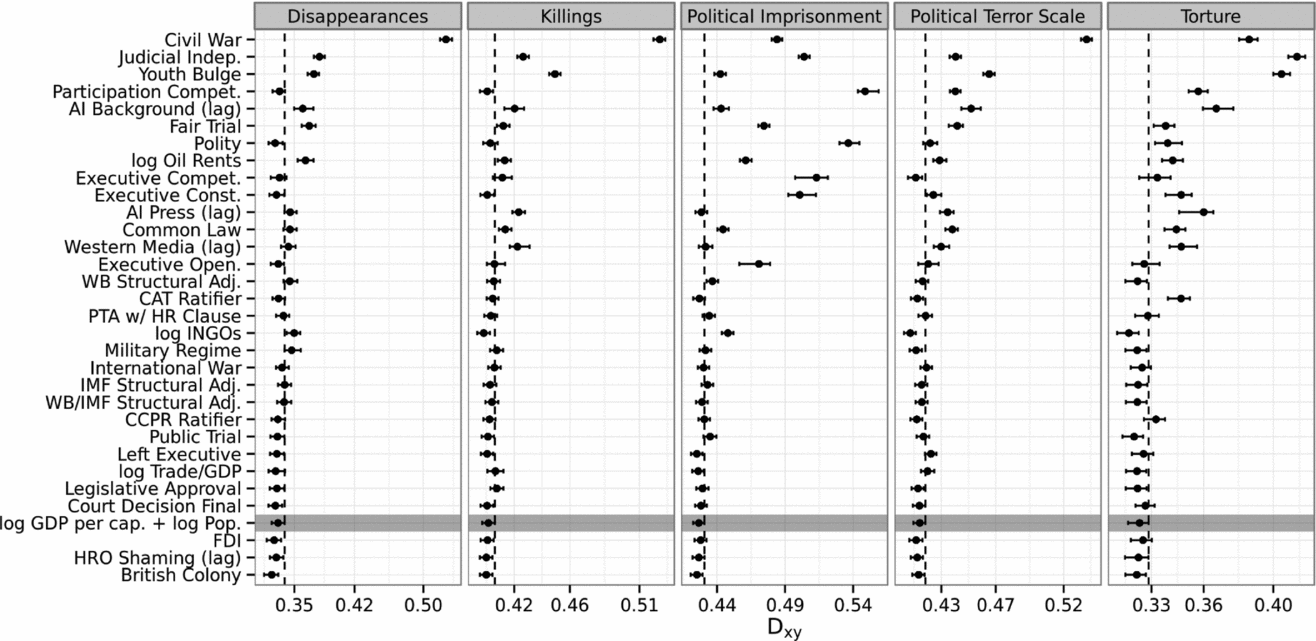
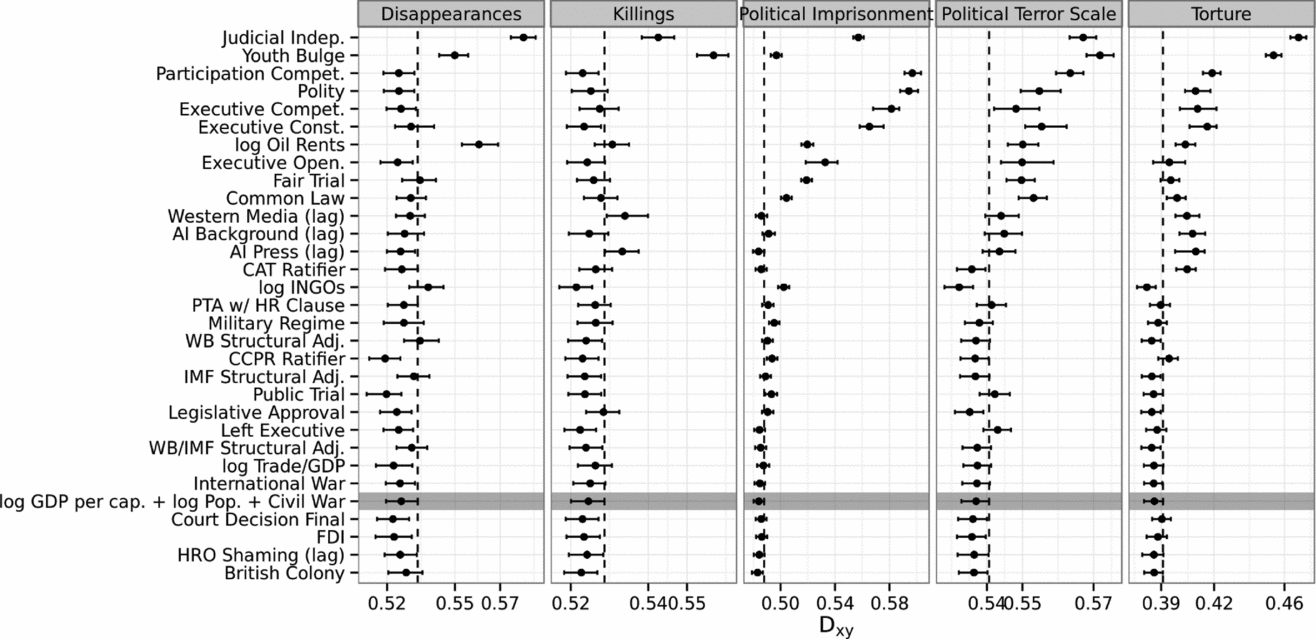
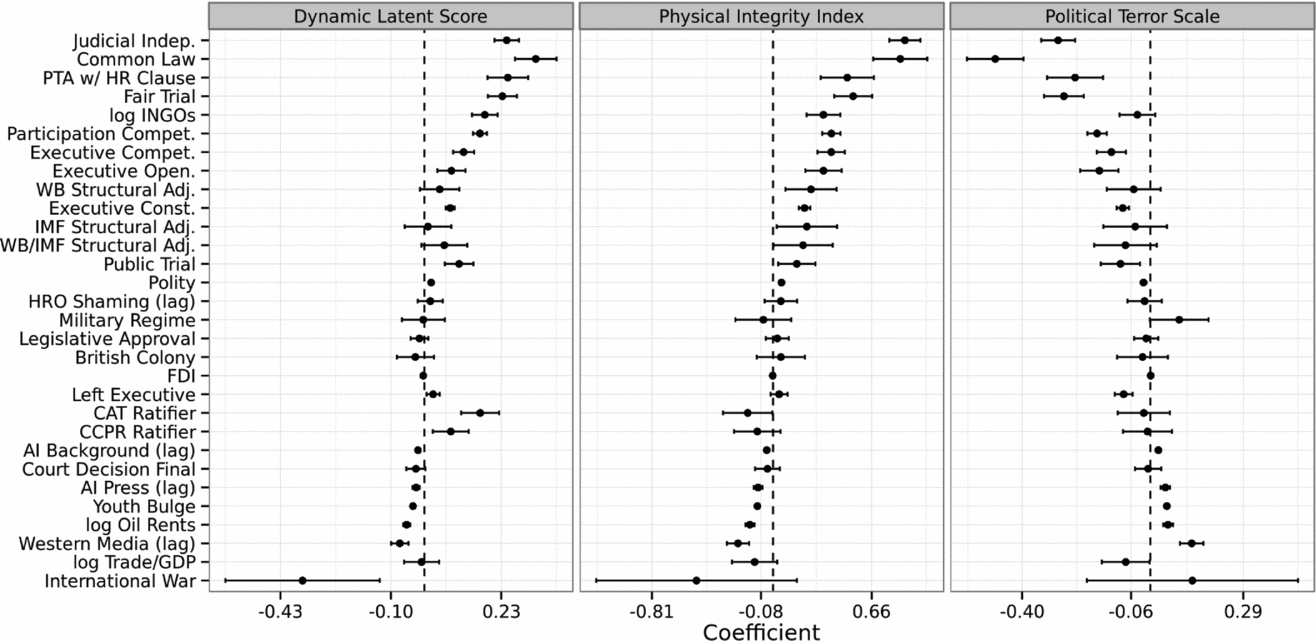
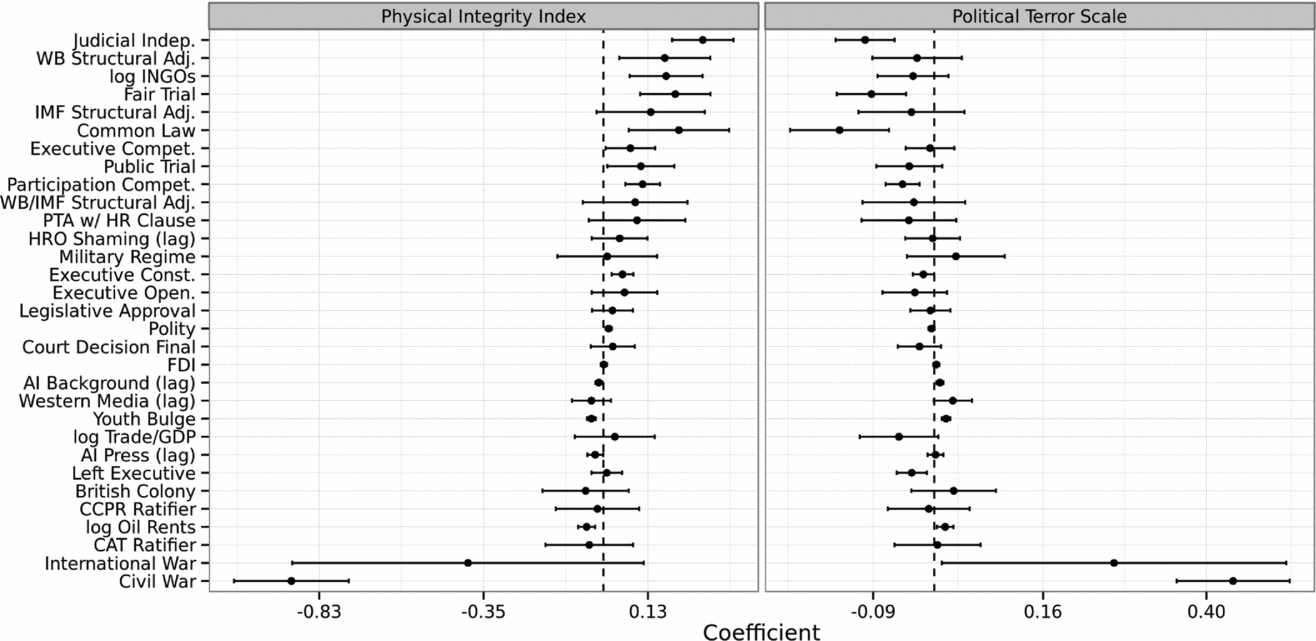
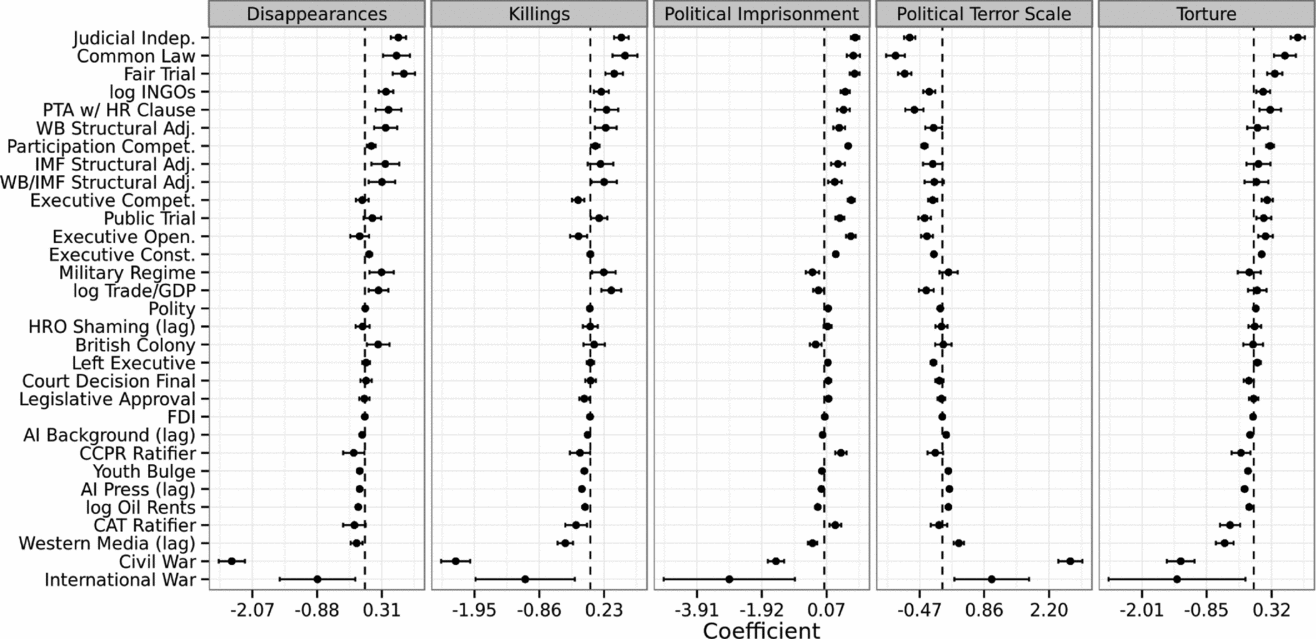
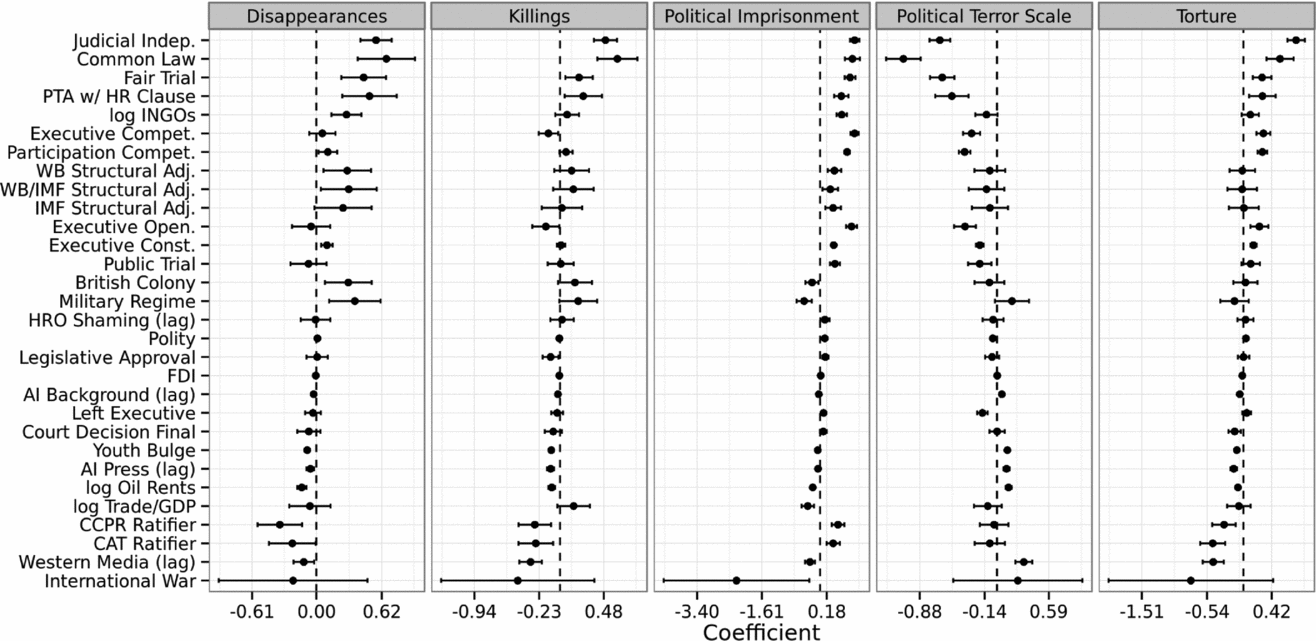
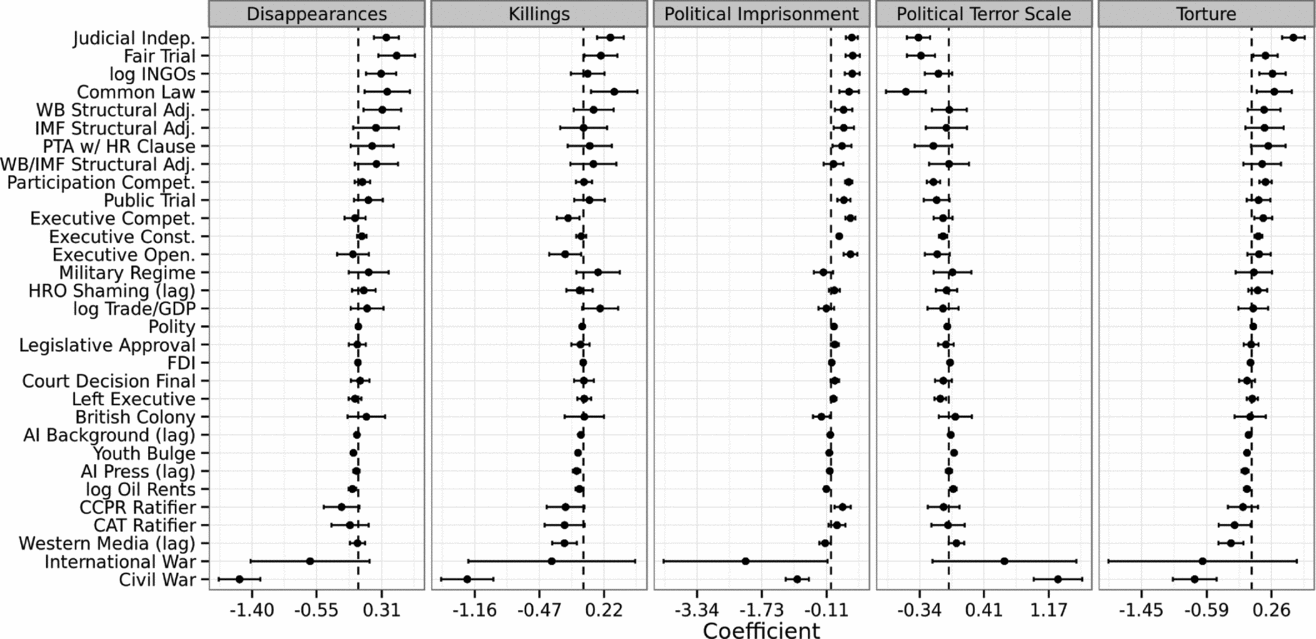



Comments
No Comments have been published for this article.