I. INTRODUCTION
In the last decade, many researchers emphasized in hydrogen storage in different media to solve the storing problem because the main barrier for the common usage of hydrogen is suitable and convenient uptake in materials. Hence, to uptake hydrogen more efficiently, physical adsorption, in other words, physisorption, is being used. As is understood from the term, hydrogen is being stored in media by weak van der Waals interactions by physisorption.Reference Nijkamp, Raaymakers, van Dillen and Jong1 One of the most known media that uptakes hydrogen physically is metal organic framework (MOF) structured materials that work in extremely low temperatures. MOFs are being used for many advanced applications in science, for instance, catalyst, sensors, gas separation, heavy metal removal, gas storage even CO2, methane, and others.Reference Cirujano, Xamena and Corma2–Reference Wu, Zhou and Yildirim8 Pioneer in MOF research, Rosi et al.Reference Rosi, Eckert, Eddaoudi, Vodak, Kim, O’Keeffe and Yaghi9 have published the most famous MOF structured compounds MOF-5, which has the Zn4O(BDC)3 (BDC = 1,4-benzenedicarboxylate) composition with a cubic three-dimensional structure uptaking 4.5 wt% hydrogen in 78 K and 20 bars pressure. To store more hydrogen efficiently, novel MOF structured materials are being investigated worldwide by researchers experimentally or theoretically. [Cu2(PDEB)H2O)2]·xS [PDEB = 5,5′-(1,4-phenylenedi-2,1-ethynediyl)bis(1,3-benzenecarbozylic acid)] formulated MOF-505 was synthesized by Zheng et al.,Reference Zheng, Yun, Bai, Lu, Du and Li10 which was constructed by the special ligand PDEB. It is reported that MOF-505 uptakes 6.27 wt% hydrogen at 77 K and 20 bars with 3038 m2/g Brunauer-Emmett-Teller (BET) surface area. Calculations for theoretical results are being used also for hydrogen storage in materials.Reference Singh and Yakobson11 Another novel material Be-BTB (BTB = benzene tribenzoate) was investigated theoretically for the hydrogen storage capacity. By using the numerical atomistic simulation topologically integrated mathematical thermodynamic adsorption model, hydrogen adsorption within Be-BTB was predicted by Lim et al. The value was approximately 9 wt% hydrogen stored in materials at 77 K and 100 bars.Reference Lim, Thornton, Hill, Cox, Hill and Hill12 Yang and ZhongReference Yang and Zhong13 published some early investigation of theoretical adsorption/desorption of hydrogen in MOF structured materials at another research in which the theoretical hydrogen uptake was approximately 1.4 wt% at 77 K and 0.1 MPa pressure in IRMOF-1. They used the all-atom optimized potentials for liquid simulations (OPLS) force field, which was established by Jorgensen et al.Reference Jorgensen, Maxwell and Tirado-Rives14
It is clear that to improve the storage property ofmaterials, new ligands as building blocks in MOF structured materials are being used. Another possible ligand to develop novel materials for efficient hydrogen storage was orotic acid, which was known as vitamin B13 (then it is proved that it is not). Many of its compounds exist with some other applications as Lencioni et al.Reference Lencioni, Pellerito, Fiore, Giuliani, Pellerito, Cambria and Mansueto15 did but not for hydrogen storage. They investigated spectroscopic and in vivo applications of organometallic dialkyltin(IV) and trialkyltin(IV) orotate complexes. Another one was about spectroscopic and crystallographic investigation of bis(triphenylphosphine) and copper(I) complex of orotate.Reference Darensbourg, Larkins and Reibenspies16
The main aim of this research was determining the differences for the hydrogen storage between mono- and dianionic complexes. For this aim, monoanionic (monodentate) and dianionic (bidentate) complexes of orotic acid and Co(II) were synthesized, characterized, and then experimentally and theoretically investigated for hydrogen storage applications. Melting point (MP), elemental analysis (EA), magnetic susceptibility, UV-vis spectral analysis, IR analysis, and thermal analysis were the characterization analyses. Single XRD analysis data were collected to determine the crystallographic structure. After characterization, hydrogen storage capacities were measured and calculated by volumetric measurement and molecular dynamic simulations software Materials Studio, respectively.
II. EXPERIMENTAL
All chemicals are purchased from Sigma Aldrich (St. Louis, MO) and used without any purification.
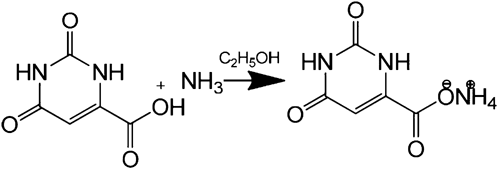
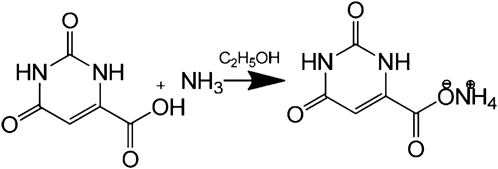
To make orotic acid soluble in water, it was converted to ammonia salt by solving it in ammonia/alcohol (1:1) at 323 K and waited for a week for crystallization, and then water-soluble NH4H2Or was collected and dried for subsequent steps (Fig. 1).
A. Synthesis of monoanionic (monodentate) Co(II) orotate complex (I)
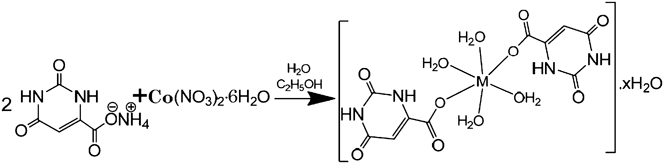
In our previous work, by using the room temperature synthesis technique, 3.45 g (0.02 mol) of NH4H2Or was solved in water and then mixed with 2.90 g (0.01 mol) of Co(NO3)2·6H2O solution in water. The mixture was stirred for 3 h under reflux at 353 K and then kept for 2 weeks at room temperature for crystallization. At last, the monoanionic orotate complex of Co was filtered and then washed with water and methanol, then dried at 353 K, under 10−6 Torr vacuum for a week (Fig. 2).Reference Kose, Zumreoglu, Sahin and Buyukgungor17
B. Synthesis of dianionic (bidentate) Co(II) orotate complex (II)
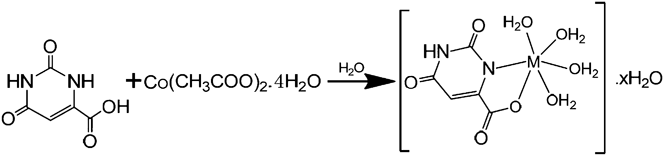
2.5 g of (CH3COO)2Co·4H2O in solid form was added to 1.55 g (0.01 mol) of orotic acid solution in water at 363 K. The metal was added in solid form to prevent crystallization of orotic acid back. The mixture was stirred for 10 h at 363 K and then kept at room temperature or 2 weeks for crystallization. At last, dianionic orotate complex of Co was filtered and then washed with water and methanol, dried at 353 K, under 10−6 Torr vacuum for a week (Fig. 3).Reference Sahin, Buyukgungor, Kose, Zumreoglu and Necefoglu18
C. Characterization
To characterize the complexes, the MP was determined by using a capillary tube with a MP instrument (Thermo Scientific, Waltham, MA); EA was realized for C, H, and N atoms with an EA instrument (Thermo Scientific Flash 2000); magnetic susceptibility balance was measured (Sherwood Scientific MK1, Cambridge, UK); UV-vis spectra were collected in a UV spectrophotometer (Thermo Scientific Perkin Elmer Lambda 850); infrared spectra were collected in a Fourier transform infra-red (FTIR) instrument in the range of 400–4000 cm−1 by using KBr pellets (Perkin Elmer Spectrum One, Waltham, MA); DTA, TGA, and DrTGA as thermal decomposition curves were collected in instruments simultaneously at the temperatures up to 1273 K under nitrogen atmosphere (Shimadzu DTG 60H, Nakagyo-ku, Kyoto, Japan). To determine the crystal structures of materials, x-ray diffraction data were collected from single crystals, which were mounted on a glass fiber, by using graphite Cu Kα radiation at 296 K (STOE IPDS II). Volumetric hydrogen storage capacity was measured in a volumetric analyzer at 77 K with different pressure steps up to approximately 90 bars after degassing under vacuum for 10 h (Micromeritics HPVA-100, Norcross, GA). At last, molecular dynamic simulation calculations were carried out with the Materials Studio 5.5 (MS) sorption module. Structures were created by using single crystal XRD data, then condensed-phase optimized molecular potentials for atomistic simulation studies force field with current charge was used for calculations. With ultrafine calculation quality, 10 fugacity steps calculated from 0 to 10,000 kPa pressures and 77 K. In addition, theoretical PXRD patterns are simulated by using both Materials Studio and PLATON. BET surface area and pore size distributions analyzed by using PLATON and Materials Studio theoretically, Autosorp iQ (Quantachrome, Boynton Beach, FL) experimentally. Experimental surface area and pore size distributions measured at 77 K with N2 for 10 h after 15 h of degassing at 378 K.
III. RESULTS AND DISCUSSION
MP, magnetic susceptibility, and EA results are given in Table I as analytical data of complexes with other specific properties.
Analytical data of I and II.

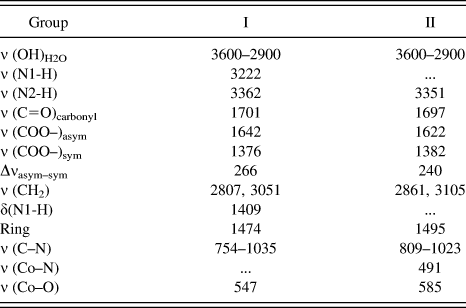
Important FTIR peaks for complexes.
According to UV-NIR-vis spectra of I at 15,886 and 20,365 cm−1 areas, d–d transitions are related to (4T1g → 4T2g)(F) and (4T1g → 4T1g)(P) transitions. For I, these transitions indicate octahedral geometry. In a similar fashion, transitions for II at 16,129 and 20,984 cm−1 areas, (4T1g → 4T2g)(F) and (4T1g → 4T1g)(P) transitions were shown, also indicating octahedral geometry.
Monoanionic interaction for I was easily understood from spectra (see supporting information), and also the value of Δνasym–sym being bigger than 200 proves that the carboxylic group interacted with the metal by monodentate. The water ingredient for both complexes was understood from the peaks in the range of 3600–2900 cm−1. Stretching and torsion peak existence for N1-H at sample I prove that there is no interaction via this atom with others. For II, in the range of 1400–1410 cm−1, the absence of the peak proves the interaction for the second dentate, which means the bidentate complex. For both complexes, peaks present in 547 cm−1 for I and 585 cm−1 for II prove the metal–ligand interactions.
Decomposition steps are determined in detail, which are given in the supplementary information section (Table S1, Figs. S2 and S3). According to thermal decomposition curves, it is seen that I was stable up to 377 °C after two-step dehydration and II was stable up to 378 °C after one-step dehydration with the same final decomposition product CoO. The only difference between I and II was decomposition steps. While compound I has two dehydration and two withdrawn orotate groups, it was only one aqua and one orotate group for II (Table II).
Crystal data and structural analysis of I and II are given in supplementary information in detail in Tables S2 and S3, respectively. It is seen that by using the same building blocks, two different complexes are prepared. Especially, their space groups and empirical formulas prove that the compounds are different. Both compounds have similar lattice parameters beside the approximately two times bigger molecular weight of I compared to II.
After collecting crystal data as crystal information file, they were processed in Materials Studio 5.5 materials simulation and calculation software. Interestingly, while in the COB plane, both crystals have the zigzag orientation shown in Figs. S4 and S5; in another plane BOA, helix (II) and reticular (I) structured complexes are in sight, which is also shown in Fig. 4. Especially, II comes to the forefront with its helix geometry resulting in holes in the crystal. According to the perspective view of self-assembled crystals, empty spaces for compounds exist near to the lattice borders and the centers of helixes for I and II respectively (Fig. 5). ORTEP molecular structure view and PLUTON single cell view of compounds are shown in Figs. S8 and S9 in the supporting information section, respectively.
Reaction of ammonium orotate.
Synthesize reaction of I (x = 2–7 in equation).
Synthesis reaction of II (x = 2–7 in equation).
Perspective ball and stick view of a single cell of (a) compound I and (b) compound II.
Perspective view of empty spaces: (a) compound I and (b) compound II.
BET surface area and pore size distribution analysis shows that compounds have different sized surfaces with small pores. The pore size distribution of compound II is given Table S4 in detail. According to experimental measurements, total BET surface area of compound II is 16.245 m2/g for first measurement and 17.022 m2/g for the second measurement. Total pore volumes are 0.073 and 0.075 cc/g for the first and second measurements. Surface areas of compounds are also investigated by using PLATON and Materials Studio software theoretically. Some small surfaces exist according to Materials Studio simulations; the free surfaces of compounds are shown in Fig. 6 for supercell, which was assembled with 16 cells. Also the yellow dotted surfaces which are shown in Fig. 6 are the possible places for hydrogen molecules. The calculation results show that compound II has a bigger surface area than compound I. Another point is molecular weights of compounds. Compounds have 477.21 and 294.60 g/mol molecular weights, respectively for I and II. It proves why compound II stores more hydrogen than compound I. According to Connolly surface calculations, it is found that compound I has 816.27 Å3 occupied volume, 40.90 Å3 free volume, and 137.02 Å2 surface area per cell. It is equal to 16.88 m2/g surface area for the compound I. Compound II has 1467.20 Å3 occupied volume, 83.67 Å3 free volume, and 305.83 Å2 surface area per cell, the values of which are calculated by using MS. The calculated surface area could be converted to 17.20 m2/g for compound II. This value was 16.245 m2/g for compound II, which was measured experimentally at 77 K.
Free surfaces of compounds simulated by using Materials Studio; yellow dots represent free surfaces for (a) compound I and (b) compound II.
According to PLATON calculations, it is found that no residual solvent surface exists for both compounds. The reason for the absence of the residual solvent surface area was the construction of crystal data without activation. The activation process enables extra surfaces such as the residual solvent surface. In addition to residual solvent surfaces, existing surfaces could be used for hydrogen storage. So the compounds I and II are used to store hydrogen without the activation process in such a way that researchers could choose the measured hydrogen storage performances without activation.Reference Kaye, Dailly, Yaghi and Long19 It is possible to show crystallinity by theoretical PXRD analysis for compounds used for hydrogen storage. For this purpose, theoretical PXRD patterns are simulated by using PLATON and Materials Studio for both compounds that the patterns are given in the supporting information section (Figs. S10 and S11).
Hydrogen storage properties of materials are determined by measuring volumetric hydrogen adsorption values after 10 h degassing under vacuum within 10 different adsorption/desorption pressure steps, which are up to approximately 90 bars of hydrogen. At low pressures from the beginning up to approximately 40 bars in the pressure concentration temperature (PCT) diagram, which is given in Fig. 7, adsorption/desorption curves for 77 K show small differences between adsorption and desorption values. If these small differences are ignored, curves represent the Type II adsorption isotherm, which is classified by IUPAC.Reference Rouquerol, Avnir, Fairbridge, Everett, Haynes, Pernicone, Ramsay, Sing and Unger20 It is clearly seen by volume@STP versus the relative pressure (P/P 0) diagram given in Fig. S12. The Type II adsorption isotherm describes adsorption on nonporous or microporous materials with weak adsorbate and adsorbent interactions. It has also been proved by PLATON calculations that the compounds have no residual solvent surface area. However, I and II uptake hydrogen with weak van der Waals interactions, in other words, hydrogen is stored in I and II by physisorption. With the pressures above 60 bars, compounds store hydrogen more reversibly because fewer differences exist between adsorption and desorption. Finally, I uptakes 0.80 wt% hydrogen at approximately 80 bars pressure at maximum. This number increases 1.15 wt% hydrogen for the same pressures which is an effect of bigger and convenient lattice spaces of II that the perspective view of both compounds are shown in Figs. 5 and 6.
PCT diagram of compounds I and II, which is calculated and determined experimentally.
Hydrogen storage performance calculations of compounds I and II were calculated by using the Materials Studio software sorption module with COMPASS 27 force field, ultrafine quality calculations were used. It means that 1 million equilibration steps with 10 million production steps are calculated at different temperatures from 77 K to over 298 K within 10 fugacity steps from 10 to 10,000 kPa. Hydrogen uptake values of compounds are calculated also at 77 K in addition to other temperatures to compare theoretical and experimental results. The calculated maximum hydrogen uptake values of compounds I and II were 1.34 and 1.25 wt% respectively at 77 K and 100 bars. Hydrogen uptake values decrease to 1.03 and 1.16 wt% at 77 K and 80 bars, whereas the experimentally measured numbers were 0.80 and 1.15 wt% at 77 K and approximately 80 bars for I and II, respectively. The hydrogen uptake values are decreased by increasing temperatures up to approximately 300 K due to the weakening of van der Waals interactions by temperature. As it is expected, the hydrogen uptake value decreases approximately 10 times while the temperature increases from 77 to 323 K. This can be seen in PCT diagrams (Figs. S6 and S7). In experimental data, compound I has a higher uptake below 40 bars; in contrast, above 40 bars, compound II uptakes more hydrogen. However, in calculated data, it is seen that in any pressure step, compound I has better performance. The differences between experimental measurements and theoretical calculations exist because of the low hydrogen uptake values. Similarly, Assfour et al.Reference Assfour, Leoni, Yurchenko and Seifert21 calculated different values compared to the measurement. In addition, in the same research, researchers proved that using different models—forcefields—results in hydrogen storage performance calculation differences for the same structures. It is found that the main differences between the compounds for hydrogen storage comes to the forefront above 50 bars, and II shows better performance according to experimental measurements. Similarly, calculations have differences for the hydrogen uptakes.
IV. CONCLUSION
In conclusion, self-assembled MOF structured organometallic monoanionic and dianionic orotate complexes of Co(II) were synthesized, by using same building blocks. Then, their analytical and physical characteristics are determined and the crystal parameters are obtained. At last both compounds are used as hydrogen storage materials. Hydrogen storage performances are measured experimentally and calculated theoretically. It is found that compound II stores 42% more hydrogen than I in 80 bars according to experimental data. Compound I has 13% better performance under the same conditions experimentally. Below 50 bars, I has better performance both experimentally and theoretically. Compound I uptakes 20% more hydrogen in 40 bars according to measurements, and this number increases to 32% for calculations. Either way, calculated or measured hydrogen uptake values show differences, and it means that the different crystal form and porosity results in different hydrogen storage performances. In addition, the differences between experimental and theoretical hydrogen storage performances of both compounds were due to the use of most known forcefields, not the modified ones.
Supplementary Material
To view supplementary material for this article, please visit http://dx.doi.org/jmr.2013.357
ACKNOWLEDGMENTS
This research was funded by TUBITAK with 111T608 project number. We also acknowledge UNIDO-ICHET for their support and serving their laboratory.