Nomenclature
Abbreviation
- CFD
-
computational fluid dynamics
- CVP
-
counter rotating vortex pair
- CCVP
-
cavity counter rotating vortex pair
- FJVP
-
fuel jet vortex pair
- HLLC
-
Harten-Lax-van Leer contact
- SFJVP
-
secondary fuel jet vortex pair
- ROI
-
region of interest
- A
-
Area of cross-section,
 ${{\rm{m}}^2}$
-
${C_p}$
-
Specific heat at constant pressure, J/kgK
- d
-
Fuel injector diameter, m
- D
-
Cavity depth, m
- L
-
Cavity length, m
- MW
-
Molecular weight, g/mol
- P
-
Static pressure, N/
${{\rm{m}}^2}$
-
${P_r}$
-
Prandtl number
- R
-
universal gas constant, J/kmol.K
- Sc
-
Schmidt number
- T
-
static temperature, K
- U
-
streamwise velocity, m/s
-
${Y_k}$
-
mass fraction
- x,y,z
-
Cartesian coordinates


Greek Symbol
-
${\eta _c}$
-
combustion efficiency
-
$\Lambda $
-
total pressure loss
-
$\lambda $
-
thermal conductivity, W/mK
-
${\unicode{x03C1}} $
-
density, kg/
${{\rm{m}}^3}$
- µ
-
viscosity, kg/ms


1.0 Introduction
The primary goal of a scramjet engine is to enhance thrust for hypersonic flights by raising the specific enthalpy of the fluid and converting it into kinetic energy. The magnitude of thrust produced relies heavily on the heat release within the combustor. To achieve this, optimising three key factors, namely mixing, ignition and flame holding, is essential in supersonic combustion. The high flow velocity in the combustor due to supersonic/hypersonic flight conditions results in limited residence time for adequate fuel and air mixing, posing challenges for continuous heat release or flameholding. Thus, researchers have explored various fuel injection and flameholding strategies over the years, utilising concepts such as wall-based injection and in-stream injection to enhance mixing and combustion performance [Reference Bogdanoff3, Reference Fang, Shen, Sun, Wang and Wang12, Reference Freeborn, King and Gruber15, Reference Gerlinger, Stoll, Kindler, Schneider and Aigner17, Reference Masuya, Tomoyuki, Murakami, Shinozaki, Nakamura, Murayamall and Ohwaki35, Reference Oamjee and Sadanandan38, Reference Rasmussen, Dhanuka and Driscoll45, Reference Tian, Han, Yang, Zhong and Le51, Reference Ukai, Zare-Behtash, Lo, Kontis and Obayashi54]. The objective of both of these approaches is to create recirculation zones with low velocity within the combustor. This, in turn, leads to a prolonged residence time for the mixing of fuel and air and promotes stable combustion [Reference Bogdanoff3–Reference Cantu, Gallo, Cutler, Danehy, Johansen, Rockwell and McDaniel5, Reference Fang, Shen, Sun, Wang and Wang12, Reference Micka and Driscoll37, Reference Wang and Song58].
When using in-stream or strut injectors, there is a higher overall pressure loss compared to wall-based injectors. However, research indicates that strut-based injectors offer improved mixing at the combustor core by creating instream vortices [Reference Masuya, Tomoyuki, Murakami, Shinozaki, Nakamura, Murayamall and Ohwaki35]. Numerous studies have delved into the impact of streamwise vortices on enhancing mixing through the use of hypermixers and lobed strut injectors [Reference Bogdanoff3, Reference Doster11, Reference Fang, Shen, Sun, Wang and Wang12, Reference Gerlinger, Stoll, Kindler, Schneider and Aigner17, Reference Kodera, Sunami and Itoh29, Reference Maddalena, Vergine and Crisanti34, Reference Qin, Agarwal and Zhang44, Reference Scheuermann, Chun and Von Wolfersdorf49, Reference Vergine and Maddalena55]. However, it is essential to assess the negative effects on drag, the level of complexity, and the expenses related to cooling or thermal protection needs before implementing strut-based injection approaches. Injectors that are mounted on walls are attractive because they have low levels of complexity in their manufacturing process and cooling needs. Several approaches, including swept ramp injection, angled injection, aerodynamic ramp injection [Reference Fulton, Edwards, Cutler, McDaniel and Goyne16, Reference Jacobsen, Gallimore, Schetz, O’Brien and Goss27] and pylon injection [Reference Gruenig, Avrashkov and Mayinger23, Reference Gruenig, Avrashkov and Mayinger24], have been proposed to enhance the efficiency of fuel jet mixing. Out of these solutions, pylon-aided injection is notable for its capability to promote effective mixing in the immediate vicinity and allow the fuel jet to penetrate the supersonic crossflow with minimal disruption to the flow path of the combustorr [Reference Gruber, Carter, Montes, Haubelt, Kings and Hs20]. The streamwise vortices generated by the pylon edges are crucial for enhancing the mixing process. The reduced effective blockage area of the pylon minimises the total pressure loss. However, the flameholding capability remains a challenge. To overcome this, different wall-based flameholder configurations like backward-facing step [Reference Kuratani, Ikeda, Nakajima, Tomioka and Mitani31, Reference Tihon, Pěnkavová and Pantzali53] and cavities [Reference Ruan, Domingo and Ribert48, Reference Vikramaditya and Kurian56, Reference Zang, Tempel, Yu and Buckley61], along with the wall-based injectors, are studied to combine the fuel injection and flameholding capabilities. Including cavities in the main flow helps extend the time available for mixing and chemical reactions [Reference Micka and Driscoll37]. This makes cavities a reliable component for maintaining a stable flame, ensuring a continuous supply of radicals for combustion. Consequently, researchers are actively investigating the use of wall-based cavity flameholders for scramjet engines [Reference Ben-Yakar and Hanson2, Reference Chandra and Chakravarthy8, Reference Gruber, Donbar, Carter and Hsu21, Reference Gruber, Mathur and Hsu22, Reference Jacobsen, Carter and Dwenger28, Reference Panigrahi, Vaidyanathan and Nair41, Reference Potturi and Edwards43, Reference Vikramaditya and Kurian56, Reference Yu, Wilson and Schadow60, Reference Zhang, Rona and Edwards64].
In a thorough study conducted by Freeborn [Reference Freeborn, King and Gruber15], the impact of adding a pylon geometry to the leading edge of a cavity flameholder was investigated. The results revealed a significant improvement in mass flow transfer between the cavity flameholder and the main flow stream. Several other studies have also highlighted the mixing capabilities of pylon-cavity configurations in supersonic flows. The pylon positioned at the front of the cavity plays a crucial role in facilitating the entry of the fuel jet into the core of the combustor. Additionally, the pylon edges undergo supersonic expansion, leading to a pressure decrease behind the pylon. This pressure differential between the cavity floor and pylon wake serves to boost the penetration of fuel into the combustor core. This results in an upward movement of the flow within the cavity, which improves the exchange of mass between the cavity flow and the crossflowr [Reference Freeborn, King and Gruber14]. In addition, the counter-rotating vortex pairs created by the edges of the pylon have a more significant interaction with the flow in the cavity, leading to improved mixing. Previous demonstrations have shown that injecting fuel ahead of the step flameholders on the pylon can help maintain combustion. The increased mass exchange resulting from the flow induced by the pylon should contribute to a more stable flow. This is because the mass can exit the cavity behind the pylon at a consistent rate rather than through the shear layer oscillating up and down at the back of the cavity. Introducing a pylon ahead of the cavity can significantly reduce pressure fluctuations within the cavity, although the frequencies of oscillation remain unaffected.
In addition, the pylon’s shock waves can increase the mixing in the shear layer as they reflect off the duct walls and pass over the cavity. The interplay between pylon waves and reflections from the cavity generates an intricate three-dimensional flow pattern downstream of the pylon, hence intensifying the mixing process. Presently, there is insufficient data regarding the specific mixing mechanisms that contribute to flame stabilisation within the pylon-cavity flameholder. Hence, the primary objective of this study is to comprehensively examine the underlying mixing and flameholding mechanisms that occur between the vortex structures created by the pylon-cavity and the fuel jet, as well as to investigate techniques for improving these mechanisms. The study will largely investigate the mechanics of near-field and far-field mixing, as well as the flow dynamics that affect flame stabilisation.
2.0 Methodology
In the current study, authors employ a steady RANS-based numerical method using CFD++ (version 14.1.1). Previous investigations have demonstrated the accuracy of the solver in hypersonic aerodynamic and aero-thermodynamic scenarios. Although it’s been shown that large eddy simulation (LES) and hybrid
Reynolds-averaged Navier–Stokes equations (RANS)/LES deliver more precise predictions than RANS simulations, the latter is more computationally efficient. The higher expenses associated with LES often limit its practical application. Consequently, there is a continuing high demand for improvements to the RANS-based approach, particularly in turbulent scalar transport models. The RANS method frequently utilises two-equation turbulence models to simulate supersonic combustion flows. For general turbulence problems, the RANS-based approach remains suitable for investigating steady flow structures and can provide an economical solution for complex flow simulations [Reference Chakravarthy, Peroomian, Goldberg and Palaniswamy7, Reference Freeborn, King and Gruber15, Reference Goldberg18, Reference Goldberg, Peroomian, Chakravarthy and Sekar19, Reference Lorrain, Brieschenk, Capra and Boyce32].
When considering pylon-cavity configuration in supersonic flows, one can anticipate increased unsteadiness in different locations, which might be problematic for simulations based on RANS [Reference Baurle1]. Given the very short residence time in supersonic flows, even a minor error in calculating mixing rates can lead to substantial variations in the forecast of reactant generation and, subsequently, the identification of the site where the flame is stabilised. Prior research has demonstrated that the unsteadiness is significantly diminished for pylon-cavity configurations with angled aft wallsr [Reference Freeborn13]. While a steady RANS approach may effectively resolve the subsonic region in the wake of the pylon-cavity, the authors recognise that RANS is insufficient for accurately resolving regions with significant velocity gradients that produce smaller vortex shedding and eddies due to Kelvin-Helmholtz instability. In the context of the present investigations, two critical areas in a pylon cavity flameholder setup are (i) the region where the supersonic crossflow interacts with the fuel jet above the cavity and (ii) the outside edge of the under-expanded fuel jet inside the cavity. These regions are likely to experience some uncertainty in the evaluations of mixing performance due to the considerations mentioned above. However, the current study based on steady-state RANS models can still provide valuable information as the primary focus is on parametric investigations where each case is compared based on the trend in variations observed rather than the absolute values. Here, the focus is on the primary vortex structures that participate in the mixing and flameholding mechanisms, which are strong and steady at various locations. The presence of pylon and cavity creates a subsonic region with large, steady vortex structures, which predominantly influence the mixing process. Studies by Freeborn et al. show that a combination of experimental and RANS-based numerical investigations can be used in such cases to reveal valuable information about the fundamental mixing processes involvedr [Reference Freeborn, King and Gruber15]. That being said, the reader is reminded that the regions with highly turbulent unsteady flow structures, as mentioned above, will cause uncertainties in accurately predicting the mixing performance when using steady-state simulations.
Schematic of the baseline pylon-cavity flameholder (top) and different pylon geometries (bottom) P0 (baseline), P1 and P2 used for the study.

The performance parameters used for the current investigation are combustion efficiency
 $\;{{\unicode{x03B7}}_{\rm{c}}}$
, total pressure loss Λ, and flammable plume area fraction
 ${\rm{F}}{{\rm{P}}_{\rm{f}}}$
. A detailed definition for these parameters can be found in Ref. [Reference Oamjee and Sadanandan39, Reference Oamjee and Sadanandan40].
2.1 Test conditions and pylon-cavity configurations
During the investigation, authors used an inflow Mach number of 2.2, along with a stagnation pressure of 4 bar and a temperature of 1771.2 K. Throughout the study, a transverse sonic injection of
 ${{\rm{H}}_2}$
from a 1 mm injector diameter (d) hole located 2 mm downstream of the cavity leading edge (see Fig. 1) is maintained, with an overall equivalence ratio of 0.03. Though the overall fuel-air or equivalence ratio is lean, there exist localised regions with rich fuel-air ratios within the subsonic region of pylon-cavity flameholder. This occurs because the fuel jet mixes with the incoming airflow, creating a complex, non-uniform distribution of fuel and air within the combustor. The fuel-air ratio at these specific points within the combustor can vary significantly based on the injection and mixing processes. These fuel-rich zones within the flameholder aid the ignition and flame stabilisation. Different articles in the literature with similar operating conditions and flameholder geometries reported lean global fuel air ratios [Reference Tian, Yang, Le, Su, Yue, Zhong and Tian52, Reference Wu, Zhang, Yao and Fan59].
The pylon-cavity baseline configuration utilised for this study comprises a pyramidal-shaped pylon (referred to as P0 in Fig. 1 and termed as the baseline) positioned at the leading edge of the cavity. The selection of P0 is based on prior parametric studies conducted by Gruberr [Reference Gruber, Carter, Montes, Haubelt, Kings and Hs20], and Pohlman [Reference Pohlman42]. The pyramidal-shaped pylon has demonstrated enhanced mixing performance with minimal total pressure loss and reduced complexity. Gruber’s study explored three pyramidal-shaped pylon configurations with variations in geometrical parametersr [Reference Gruber, Carter, Montes, Haubelt, Kings and Hs20]. It revealed that the wider pylon offered the best overall mixing performance among all pylon configurations, while the taller pylon exhibited superior fuel jet penetration capability. Extensive parametric studies on the pyramidal-shaped pylon conducted by Pohlman indicate that broader pylons with a width exceeding three diameters (fuel injector orifice diameter) produce larger fuel plumes [Reference Pohlman42]. Upon raising the height of the pylons, a rise in overall penetration, flammable fuel plume area, and fuel core penetration is noticed. Additionally, it is observed that the angle of the leading-edge wedge has minimal effect on mixing performance. Considering these findings and the dimensions of the test section, it was decided to opt for a pylon width of 5 mm and lengths and heights of 10 mm each, with a leading-edge angle of 45°. An L/D ratio of 3 has been chosen for the cavity of the investigated flameholder to minimise cavity pressure drag.
The other two pylon geometries, P1 and P2 (refer to Fig. 1), are determined based on the goal of reducing the effective blockage area compared to P0 and aid in generating additional streamwise vortices for mixing enhancement. The geometrical alterations in the pylon surfaces of P1 and P2 are made in the form of grooves. To investigate the effect of high-velocity crossflow on generating streamwise vortex structures with a reduced total pressure loss, two wider parallel grooves of 2 mm separated by a 1 mm groove are provided on P1. This will also give a comparison to facilitate understanding the impact of streamwise vortices generated by the inclined surface of the pyramidal-shaped pylon P0. The depth of the grooves is defined such that the pylon base width of 2.4 mm is maintained for ease of manufacturing.
Similarly, to investigate the influence of a slanted groove on mixing enhancement, P2 has an angled groove at the top with a maximum thickness of 2.39 mm at the pylon rear face with an angle of
 ${24^\circ }$
to the base. Since the grooves in P2 are angled (and not parallel as in P1), the trajectory followed by the vortex tube generated from these grooves will interact differently with the fuel jet (and, therefore, the reactant formation) compared to P1. This variation in interaction provides valuable insight into the impact of these vortex structures on localised fuel/air mixing and maintaining flame stability.
2.2 Numerical scheme
For the present study, the authors employed a coupled, implicit, second-order upwind solver to solve the steady-state RANS equations. The cell fluxes are resolved using the Harten-Lax-van Leer contact (HLLC) scheme implemented in CFD++. Following transport equations in three-dimensional Cartesian coordinates [Reference Kuo30] are solved for simulating the current multi-species problem where the dependent variables are time-averaged quantities
-
a.) Mass conservation
(1)
\begin{align}\frac{{\partial {\unicode{x03C1}}}}{{\partial {\rm{t}}}} + \frac{{\partial \!\left( {{\unicode{x03C1}}{{\rm{u}}_{\rm{i}}}} \right)}}{{\partial {{\rm{x}}_{\rm{i}}}}} = {\;}0{\;}\end{align}
-
b.) Momentum conservation
(2)where the molecular viscous stress tensor is,
\begin{align}\frac{{\partial \!\left( {{\unicode{x03C1}}{{\rm{u}}_{\rm{i}}}} \right)}}{{\partial {\rm{t}}}} + \frac{{\partial \!\left( {{\unicode{x03C1}}{{\rm{u}}_{\rm{i}}}{{\rm{u}}_{\rm{j}}}} \right)}}{{\partial {{\rm{x}}_{\rm{j}}}}} = {\;} - \frac{{\partial {\rm{p}}}}{{\partial {{\rm{x}}_{\rm{i}}}}} + \frac{{\partial {{\unicode{x03C4}}_{\rm{i}}}_{\rm{j}}}}{{\partial {{\rm{x}}_{\rm{j}}}}} - \frac{{\partial \!\left( {{\unicode{x03C1}}\overline {{{\rm{u}}_{\rm{i}}}{\rm{'}}{{\rm{u}}_{\rm{j}}}'} } \right)}}{{\partial {{\rm{x}}_{\rm{j}}}}}\end{align}
\begin{align*}{{\unicode{x03C4}}_{{\rm{ij}}}}{\;} = {\unicode{x03BC}}\left( {\frac{{\partial {{\rm{u}}_{\rm{i}}}}}{{\partial {{\rm{x}}_{\rm{j}}}}} + \frac{{\partial {{\rm{u}}_{\rm{j}}}}}{{\partial {{\rm{x}}_{\rm{i}}}}} - {\;}\left( {\frac{2}{3}} \right){{\unicode{x03B4}}_{{\rm{ij}}}}{\;}\frac{{\partial {{\rm{u}}_{\rm{k}}}}}{{\partial {{\rm{x}}_{\rm{k}}}}}} \right)\end{align*}
The Reynolds stress tensor (
$ - {\unicode{x03C1}}\overline {{{\rm{u}}_{\rm{i}}}{\rm{'}}{{\rm{u}}_{\rm{j}}}'} )\;$
is modelled using the Boussinesq approximation:(2a)with the eddy viscosity
\begin{align} - {\unicode{x03C1}}\overline {{{\rm{u}}_{\rm{i}}}{\rm{'}}{{\rm{u}}_{\rm{j}}}'} {\;} = {\;}2{{\unicode{x03BC}}_{\rm{t}}}{{\rm{S}}_{{\rm{ij}}}}{\;} - {\;}\left( {\frac{2}{3}} \right){{{\unicode{x03C1}} k}}{{\unicode{x03B4}}_{{\rm{ij}}}},{\rm{\;\;\;}}{{\rm{S}}_{{\rm{ij}}}}{\;} = {\;}0.5\left( {\frac{{\partial {{\rm{u}}_{\rm{i}}}}}{{\partial {{\rm{x}}_{\rm{j}}}}} + \frac{{\partial {{\rm{u}}_{\rm{j}}}}}{{\partial {{\rm{x}}_{\rm{i}}}}}} \right)\end{align}
$\mu_{\textrm{t}}$
provided by the Menter’s sheer stress transport (SST) k-ω turbulence model as(2b)
\begin{align}{{\unicode{x03BC}}_{\rm{t}}} = {\unicode{x03C1}}{{\unicode{x03BD}}_{\rm{t}}},{\rm{\;\;\;}}{{\unicode{x03BD}}_{\rm{t}}} = \left( {{{\rm{a}}_1}{\rm{k}}} \right)\!/{\rm{max}}\left( {{{\rm{a}}_1}{\unicode{x03C9}},{\rm{\;S\;}}{{\rm{F}}_2}} \right),{\rm{\;\;\;S\;}} = {\;}\sqrt {2{\;}{{\rm{S}}_{{\rm{ij}}}}{\;}{{\rm{S}}_{{\rm{ij}}}}} \end{align}
-
c.) Energy conservation
(3)where
\begin{align}&\frac{{\partial \!\left( {{{{\unicode{x03C1}} e}}} \right)}}{{\partial {\rm{t}}}} + \frac{{\partial \!\left( {{\unicode{x03C1}}{{\rm{u}}_{\rm{i}}}{\rm{e}}} \right)}}{{\partial {{\rm{x}}_{\rm{i}}}}}\nonumber \\&\quad = - \frac{{\partial \!\left( {{\rm{p}}{{\rm{u}}_{\rm{i}}}} \right)}}{{\partial {{\rm{x}}_{\rm{i}}}}} + \frac{\partial }{{\partial {{\rm{x}}_{\rm{i}}}}}\left[ {\left( {\frac{{\unicode{x03BC}}}{{{\rm{Pr}}}} + {\;}\frac{{{{\unicode{x03BC}}_{\rm{t}}}}}{{{\rm{P}}{{\rm{r}}_{\rm{t}}}}}} \right)\frac{{\partial {\rm{e}}}}{{\partial {{\rm{x}}_{\rm{i}}}}} + \left( {{\unicode{x03BC}}\left( {\frac{1}{{{\rm{S}}{{\rm{c}}_{\rm{k}}}}}{\;} - \frac{1}{{{\rm{Pr}}}}} \right) + {\;}{{\unicode{x03BC}}_{\rm{t}}}\left( {\frac{1}{{{\rm{S}}{{\rm{c}}_{\rm{t}}}}} - \frac{1}{{{\rm{P}}{{\rm{r}}_{\rm{t}}}}}} \right)} \right){{{\unicode{x03C3}} \;}}{{\rm{e}}_{\rm{k}}}{\;}\frac{{\partial {{\rm{Y}}_{\rm{k}}}}}{{\partial {{\rm{x}}_{\rm{i}}}}}} \right]\end{align}
$e_{\textrm{k}}$
is the specific enthalpy of species k,
$Y_{\textrm{k}}$
is the mass fraction of species k, and Pr, Sc
$_{\textrm{k}}$
are the molecular Prandtl and Schmidt numbers. Turbulent heat and species fluxes are modelled using constant turbulent Prandtl and Schmidt numbers, with Pr
$_{\textrm{t}}$
= 0.707 and Sc
$_{\textrm{t}}$
= 0.7.
-
d.) Species transport
(4)where D
\begin{align}{{\partial \!\left( {{\unicode{x03C1}}{{\rm{Y}}_{\rm{k}}}} \right)} \over {\partial {\rm{t}}}} + {{\partial \!\left( {{\unicode{x03C1}}{{\rm{u}}_{\rm{i}}}{{\rm{Y}}_{\rm{k}}}} \right)} \over {\partial {{\rm{x}}_{\rm{i}}}}} = {\partial \over {\partial {{\rm{x}}_{\rm{i}}}}}\left[ {{\unicode{x03C1}}\left( {{{\rm{D}}_{\rm{k}}}{\;} + {\;}{{\rm{D}}_{\rm{t}}}} \right){{\partial {{\rm{Y}}_{\rm{k}}}} \over {\partial {{\rm{x}}_{\rm{i}}}}}} \right]\end{align}
${k}$
is the molecular diffusion coefficient of species k and D
$_{\textrm{t}}$
= μ
$_{\textrm{t}}$
/(ρSc
$_{\textrm{t}}$
) is the turbulent diffusivity.
-
e.) Turbulence model (Menter SST)
Equations [1–4] describe mass, momentum, energy and species transport including turbulent fluxes. Equations [5–6] are the SST turbulence model equations that provide k, ω, and hence the eddy viscosity μ
$_{\textrm{t}}$
, which is used in the closures [2a], [3], and [4].Turbulence kinetic energy transport equation is,
(5)and turbulence inverse time-scale transport equation is,
\begin{align}{{\partial {{{\unicode{x03C1}} {\unicode{x03BA}} }}} \over {\partial {\rm{t}}}} + {\partial \over {\partial {{\rm{x}}_{\rm{i}}}}}\left( {{{\rm{u}}_{\rm{i}}}{{{\unicode{x03C1}} {\unicode{x03BA}} }}} \right) = {{\tilde{\rm P}}_{{{\unicode{x03BA}} }}} - {{{{\unicode{x03B2}} }}^{\rm{*}}}{{{\unicode{x03C1}} {\unicode{x03BA}} {\unicode{x03C9}} }} + {\partial \over {\partial {{\rm{x}}_{\rm{i}}}}}\left[ {\left( {{\unicode{x03BC}} + {{{{\unicode{x03C3}} }}_{{{\unicode{x03BA}} }}}{{\unicode{x03BC}}_{\rm{t}}}} \right){{\partial {{{\unicode{x03BA}} }}} \over {\partial {{\rm{x}}_{\rm{i}}}}}} \right]\end{align}
\begin{align*}\frac{{\partial {{{\unicode{x03C1}} {\unicode{x03C9}} }}}}{{\partial {\rm{t}}}} + \frac{\partial }{{\partial {{\rm{x}}_{\rm{i}}}}}\left( {{{\rm{u}}_{\rm{i}}}{{{\unicode{x03C1}} {\unicode{x03C9}} }}} \right) = {{{\unicode{x03B3}} {\unicode{x03C1}} }}{{\rm{S}}^2} - {{{\unicode{x03B2}} {\unicode{x03C1}} }}{{\unicode{x03C9}}^2} + \frac{\partial }{{\partial {{\rm{x}}_{\rm{i}}}}}\left[ {\left( {{\unicode{x03BC}} + {{{{\unicode{x03C3}} }}_{\unicode{x03C9}}}{{\unicode{x03BC}}_{\rm{t}}}} \right)\frac{{\partial {\unicode{x03C9}}}}{{\partial {{\rm{x}}_{\rm{i}}}}}} \right]\end{align*}
(6)where, closure coefficients are
\begin{align} + {\;}2\left( {1 - {{\rm{F}}_1}} \right)\frac{{{\unicode{x03C1}}{{{{\unicode{x03C3}} }}_{{\unicode{x03C9}}2}}}}{{\unicode{x03C9}}}\frac{{\partial {{{\unicode{x03BA}} }}}}{{\partial {{\rm{x}}_{\rm{i}}}}}\frac{{\partial {\unicode{x03C9}}}}{{\partial {{\rm{x}}_{\rm{i}}}}}\end{align}
${{{{\unicode{x03C3}} }}_{{\rm{k}}1}}$
= 0.85,
${{{{\unicode{x03C3}} }}_{{\unicode{x03C9}}1}}$
= 0.5, β = 0.075 for κ-ω and
${{{{\unicode{x03C3}} }}_{{\rm{k}}2}}$
= 1.0,
${{{{\unicode{x03C3}} }}_{{\unicode{x03C9}}2}}$
= 0.856, β = 0.0828 for κ-ε.
${{\unicode{x03BC}}_{\rm{t}}}$
is the turbulent eddy viscosity,
${{\rm{F}}_1}$
is the blending function, S is the invariant measure of the strain rate and
${{\tilde{\rm P}}_{\rm{k}}}$
is the production limiter used in the SST model. More in-depth details regarding the transport equations for solving the turbulent kinetic energy κ and turbulence inverse time-scale ω can be located in the earlier conducted studies [Reference Oamjee and Sadanandan40].


The present formulation, using the Boussinesq approximation with constant turbulent Prandtl and Schmidt numbers in conjunction with the SST model, follows established practice in turbulence modelling [Reference Menter36] and has been successfully applied in scramjet combustion studies, including pylon/cavity based configurations [Reference Dharavath, Manna and Chakraborty10].
Based on previous findings [Reference Oamjee and Sadanandan40], authors have adopted the well-established Jachimowski chemical reaction scheme in the current research [Reference Jachimowski25]. The Jachimowski scheme is widely used and well-suited for scramjet applications because it accurately captures the complex chemical processes and thermodynamics involved in supersonic combustion [Reference Gerlinger, Stoll, Kindler, Schneider and Aigner17, Reference Jachimowski26]. It is particularly favoured for hydrogen/air combustion in scramjets due to its detailed description of the relevant species and reactions. The Jachimowski scheme includes 13 species and 33 reactions, providing a comprehensive model of the chemical reactions occurring in scramjet combustion. This detail is crucial for accurately predicting combustion behaviour, especially at high speeds. It has been validated against experimental results for a range of scramjet combustion conditions, demonstrating its ability to reproduce experimental findings. For supersonic flows, the Jachimowski scheme gives more accurate predictions than the other schemes due to the well-optimised rate constants and chemical kinetics data [Reference Gerlinger, Stoll, Kindler, Schneider and Aigner17].
While the full Jachimowski scheme is detailed, reduced versions are also used to balance accuracy with computational efficiency. In the current study, an already proven Jachimowski scheme with eight species (H2, O2, H, O, OH, H2O, HO2, H2O2) and 18 step reaction for H2–air as reactants is used. A complex elementary reaction system in it sustains the H2–O2 combustion process. These reactions are classified into initiation, branching and recombination cycles. Over the years various researchers have established different fundamental elementary reactions associated with these cycles [Reference Jachimowski25, Reference Maas and Warnatz33, Reference Rogers and Schexnayder46]. In this simplified chemical reaction scheme, the time-averaged reaction rate source terms are calculated by assuming that the reaction is equilibrium. This simplification allows for a more manageable mathematical representation of the reactions, making it easier to analyse and predict the behaviour of the system while reducing the computational complexity.
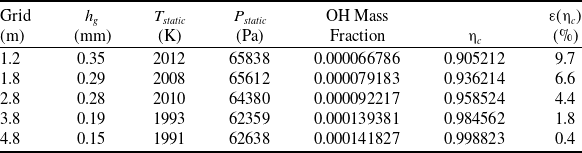
The details regarding the computational domain and grid resolutions associated with the current investigation are reported in the earlier studies conductedr [Reference Oamjee and Sadanandan38, Reference Oamjee and Sadanandan39]. In the current study, the grid independence is tested using five different meshes with varying densities. Initially, the computational domain is divided into 1.2 m cells, which are further refined to achieve a total of 4.8 m cells with a wall spacing of 0.001 mm. This grid resolution helped maintain a y+ of 1, making it the optimum choice for the current purposes. The grid refinement is carried out to ensure that the injection port’s jet is accurately resolved in order to capture the smaller counter-rotating flow structures created by the interaction of the fuel jet and surrounding flow. The spatial convergence accuracy of the simulation is quantified using Richardson’s extrapolation method [Reference Celik and Karatekin6, Reference Roy47]. Table 1 show the results from the grid independence study, where
 ${{\rm{h}}_{\rm{g}}}$
and
 ${{{{\unicode{x025B}} }}_{{{\unicode{x03B7}}_{\rm{c}}}}}$
represent the grid spacing and spatial discretisation error with respect to combustion efficiency
 ${\;}{{\unicode{x03B7}}_{\rm{c}}}$
, respectively.
 ${{\unicode{x03B7}}_{\rm{c}}}$
is defined as the ratio of the amount of
 ${{\rm{H}}_2}$
reacted to the amount of
 ${{\rm{H}}_2}$
supplied. After examining the differences between local and global variables, it is observed that using a computational domain of 4.8 m cells with a wall spacing of 0.001 mm yields satisfactory results. Additionally, it is noted that the convergence rate of the spatial discretisation error aligns with the applied numerical scheme of order 2 in the simulations.
Grid independent study

2.3 Numerical scheme validation
In this study, authors validated the numerical schemes for reactive flow simulations by comparing them with experimental data for the Cheng burnerr [Reference Cheng, Wehrmeyer, Pitz, Jarrett and Northam9] and DLR scramjet [Reference Waidmann, Alff, Brummund, Bohm, Clauss and Oschwald57] benchmark problems from the literature (see Fig. 2). The Cheng burner problem involves analysing the mixing of a sonic jet of
 ${{\rm{H}}_2}$
with a Mach 2 annular jet of vitiated air at a temperature and pressure of 1250 K and 107 kPa, respectively, at the burner exit. Detailed information about the Cheng burner validation for temperature and
 ${{\rm{H}}_2}$
O mole fractions at various x/d locations can be found in the previous studyr [Reference Oamjee and Sadanandan40]. The DLR
 ${{\rm{H}}_2}$
-fuelled strut-based scramjet case serves is a well-established benchmark problem for numerical code development in supersonic combustion.
a) Schematic of Cheng burner [Reference Cheng, Wehrmeyer, Pitz, Jarrett and Northam9] and b) DLR scramjet combustion chamber [Reference Waidmann, Alff, Brummund, Bohm, Clauss and Oschwald57]. c) Temperature validation for Cheng burner at x/d = 10.8 [Reference Oamjee and Sadanandan40] and d) steady wall pressure data validation for DLR scramjet.

Figure 2(c) shows that the Jachimowski scheme provides a close prediction of the temperature, making it suitable for the current investigations. DLR scramjet data validation demonstrates a good match between experimental and numerical steady wall pressure data (refer to Fig. 2(d)). The minor deviation between computational and experimental values can be attributed to two factors. First, the computational domain does not include the preceding Laval nozzle section, which is present in the experiments to ensure uniform inlet airflow. Consequently, numerical simulations cannot capture the transition from laminar to turbulent flows. Secondly, the limitations of RANS simulation prevent the resolution of the combustor wall shock boundary layer interaction when predicting wall pressure data.
3.0 Results and discussions
3.1 Dominant flow features and large scale mixing
Non-reactive studies conducted earlier in identical pylon-cavity flameholder (baseline) have highlighted the dominant flow structures in the mixing process [Reference Oamjee and Sadanandan38, Reference Oamjee and Sadanandan39]. It was found that the type of flow structures remains the same for reacting flows. Figure 3 shows the pylon-cavity-induced vortex structures and various fuel jet vortex pairs associated with the baseline (P0) configuration.
x-vorticity contour lines depicted over YZ plane at different x/d locations for P0 configuration highlighting the different pylon-cavity induced vortex structures.

The flow structures can be divided into two main categories. Firstly, there are pylon-cavity geometry-induced vortex structures (referred to as II, III and IV), and secondly, there are fuel jet vortex pairs (FJVP and SFJVP). When the pylon obstructs the crossflow, it creates an adverse pressure gradient that separates the crossflow boundary layer. This causes the formation of a horseshoe vortex (II) on each side of the pylon along the shear layers at the cavity leading edge. The impingement of the shear layers on the cavity aft wall also induces the formation of cavity counter-rotating vortex pairs (CCVP) III, thereby enhancing the cavity mass entrainment. Additionally, the counter-rotating vortex pair (CVP) IV on the wake side of the pylon is formed due to the supersonic expansion at the slanting pylon edges. The interaction between the supersonic fuel jet and the surrounding subsonic CCVP III results in the formation of fuel jet vortex pairs, aided by the Taylor–Goertler instabilities induced by the interaction [Reference Zapryagaev, Kiselev and Pavlov62, Reference Zapryagaev, Pickalov, Kiselev and Nepomnyashchiy63].
The development of these flow features is illustrated in the schematic shown in Fig. 4. The earlier non-reactive flow studies suggest that they influence the evolution of the local reactant mixture, thereby determining the flameholding capability of the pylon-cavity flameholder. The varying level of interaction between pylon-cavity geometry-induced vortex structures and FJVP will determine the reactant mixture concentration at different spatial locations. The mixing process observed at the supersonic underexpanded fuel jet region within the cavity results from the T-G instabilities within the mixing layer. The lateral distribution of reactant mixtures within the cavity occurs due to the interaction between FJVP and vortex structures II and III. FJVP and CCVP III interaction inside the cavity leads to a dispersive mixing mechanism where shearing and breaking up of fuel species occurs [Reference Oamjee and Sadanandan39]. Further away from the cavity floor, the interaction of FJVP with the vortex structure IV takes place. The higher velocity gradient at the fuel jet periphery induces the K-H instabilities (see Fig. 4), enhancing the local mixing process. The reactant mixture formation here is due to the dispersive mixing mechanism between FJVP, SFJVP and CCVP III.
Schematic of dominant flow structures within the pylon-cavity flameholder configuration. Flow structures marked green and blue represent the fuel jet vortex pairs and pylon-cavity geometry induced vortex structures, respectively.

Figure 5 shows the vortex structures associated with the pylon configuration P1. It can be seen that most of the vortex structures are the same as those of the P0 configuration. Since there are no grooves present over the slanted surface of P0, there is only a single vortex pair (IV) formed behind the pylon due to the supersonic expansion at the pylon edge, whereas, in P1, the three parallel grooves on the slanted surface form respective vortex pairs named as IV.1, IV.2 and IV.3. The interaction of FJVP with these vortex pairs are called FJVP.1, FJVP.2 and FJVP.3, respectively.
x-vorticity contour lines depicted over YZ plane at different x/d locations for P1 configuration highlighting the different pylon-cavity induced vortex structures.

On the other hand, since P2 geometry consists of an angled groove over the slanted surface, two vortex structures named IV.1 and IV.2 are formed (see Fig. 6). These interact with the FJVP to form FJVP.1 and FJVP.2, respectively. All other vortex structures are induced due to similar geometrical features, as seen in P0 and P1 configurations. Since the type of flow structures in P1 and P2 are the same as in P0, the dominant mixing mechanisms remain the same, as shown in Fig. 4.
x-vorticity contour lines depicted over YZ plane at different x/d locations for P2 configuration highlighting the different pylon-cavity induced vortex structures.

3.2 Reactant mixture formation in P0, P1 and P2
The flow features described above and their interactions will act as a precursor for the fine-scale mixing in P0, P1 and P2 configurations. Figure 7 shows the reactant mixture formation within the P0 configuration. It is evident that the fuel mass fractions within the flammability limits (φ = 0.14 – 2.54) are formed due to the shearing between pylon-cavity-induced vortices (II, III and IV) and FJVPs. The YZ plane at x/d = 25 shows the interaction of cavity vortex III with FJVP in forming the reactant mixture around the underexpanded fuel jet core within the cavity. At regions above the cavity, the interaction between the vortex structures IV and FJVP primarily causes the fuel dispersion behind the pylon. Besides, from the schematic shown in Fig. 8, it can be seen that the vortex pair II, which is associated with the shear layers on either side of P0, interacts with FJVP and aids in the lateral transport of the reactant mixture within the cavity. Further downstream from the pylon rear face, the vortex structure SFJVP takes part in the mixing process by interacting with the vortex structures FJVP, III and IV at x/d = 30 and also with II at x/d = 40.
x-vorticity lines shown in Fig. 3 overlapped with
 ${{\rm{H}}_2}$
mass fraction contour over YZ plane at different x/d locations for P0 configuration. The orange line marks the upper and lower flammability limit
 ${{\rm{H}}_2}$
mass fractions.

Schematic of the interaction between the vortex structures II and FJVPs over YZ plane at x/d = 27 for different pylon-cavity configurations. The dashed green and black boxes (marked X) represent the regions with and without shear layer interactions, respectively.

Figure 9 shows the reactant mixture formation within the P1 configuration. As observed in P0, here also, the reactant mixture formation within P1 is due to the interaction between pylon-cavity-induced vortex structures and FJVPs (see Fig. 5). The notable difference in the mixing process between P0 and P1 configurations is the involvement of the vortex pair II in fuel dispersion and mixing within the cavity. Since all grooves on the slanted surface of P1 are parallel to the freestream flow direction, the interaction between the vortex pair II and FJVPs here is minimal (see Fig. 8). This restricts the fuel dispersion into the cavity, unlike in P0. As a result, the reactant mixture is formed mainly at regions above the cavity, whereas the only area within the cavity where the reactant mixture is formed is around the underexpanded fuel jet vortex core.
x-vorticity lines shown in Fig. 5 overlapped with
 ${{\rm{H}}_2}$
mass fraction contour over YZ plane at different x/d locations for P1 configuration. The orange line marks the upper and lower flammability limit
 ${{\rm{H}}_2}$
mass fractions.

The fuel dispersion within P2 is shown in Fig. 10. In this case, the reactant mixture formed behind the pylon rear face and above the cavity is primarily due to the interaction of IV.1 and IV.2 vortex structures with the respective FJVPs. The mixing mechanism within the cavity surrounding the underexpanded fuel jet remains the same as in P0 and P1. By comparing Fig. 8 and Fig. 10, it is observed that the fuel dispersion in the lateral direction is enhanced in P2 due to the stretching of FJVP.2 into the cavity. This is reflected on the lines marking the flammability limits (orange lines), which get extended towards the cavity walls in Fig. 10. The FJVP.2 vortices are stretched into the low-pressure region within the cavity, allowing it to interact more with the vortex pair II at either side of the rear pylon face (see Fig. 8). The increase in contact surface area between these two vortex pairs, when compared to other flameholder configurations, helps form a more distributed reactant mixture within the cavity. Further downstream from the pylon rear face, the interaction between SFJVP and the surrounding vortex pairs remains the same as observed in P0 and P1.
x-vorticity lines shown in Fig. 6 overlapped with
 ${{\rm{H}}_2}$
mass fraction contour over YZ plane at different x/d locations for P2 configuration. The orange line marks the upper and lower flammability limit
 ${{\rm{H}}_2}$
mass fractions.

3.3 Flame stabilisation locations and mechanisms
Figures 11 and 12 show the 2D heat release rate per unit volume (HRR) for the different configurations investigated. Four different regions of high HRR are identified and marked as L1, L2, L3 and L4. Here the heat release rate (
 $\dot{\rm{Q}}$
) is calculated as
 ${{\dot{\textrm{Q}}}}$
=
 $\mathop \sum \nolimits_{{\rm{i}} = 1}^{\rm{N}} {{{\dot {\unicode{x03C9}} }}_{\rm{i}}}{\rm{h}}_{{\rm{f}},{\rm{i}}}^0$
where i, N,
 ${{{\dot {\unicode{x03C9}} }}_{\rm{i}}}$
, and
 ${\rm{h}}_{{\rm{f}},{\rm{i}}}^0$
represent the species, number of species that take part in the oxidation of fuel, rate of reaction and standard enthalpy of formation, respectively. It can be seen that the regions where heat release outbreak occurs closely overlap with the thin flammable areas observed before in Figs. 7-10. The stoichiometric
 ${{\rm{H}}_2}$
mass fraction contour in blue overlaps with the peak HRR and adiabatic flame temperature resulting in a higher concentration of combustion products like
 ${{\rm{H}}_2}$
O and OH. It is found that P0 and P2 include all four heat release zones, whereas, in P1, the region L3 does not exist due to the absence of an ignitable mixture. A closer look at the four HRR regions is done in the following sections.
A comparison of HRR (normalised) over YZ half-plane at x/d = 25 for P0, P1 and P2 configurations. The blue line represents the stoichiometric
 ${{\rm{H}}_2}$
mass fraction.

The HRR depicted over ZX plane at y/d = 0 and XY plane at z/d = 0 & 9 for P0 configuration. The dashed green line is used to extract the data to evaluate the flameholding mechanisms. The black lines with arrow heads at z/d = 0 represent the streamlines.

3.3.1 L1 location
Additional impressions of the region L1 along the axial plane and from the top are shown in Figs. 12 and 13 for the P0 configuration. It is observed that L1 is located outside the wake region of the pylon where supersonic crossflow interacts with the fuel jet through the vortex structures IV and FJVPs (see Fig. 7). Due to the high-velocity gradient present in this region, the KH-instability-induced vortex shedding is observed at L1. These localised recirculation regions help increase the residence time for the fuel to get mixed with the air, producing a continuous flammable reactant mixture. As a result, localised areas of high HRR are observed within the vortices at L1, as evident in Fig. 13. For a detailed understanding of the flame stabilisation mechanism at L1, different combustion parameters are extracted along the dashed green line in Fig. 12 at x/d = 34 and are shown in Fig. 14. Here, the vertical span of the cavity and pylon is in the range from z/d = 0–9 and 9–19, respectively. The horizontal grey dashed line at z/d = 11.5, and 21.5 marks the mass fractions 0.001 and 0.0226, respectively, where a rise in local HRR is observed, whereas the red dashed line at z/d = 15 and 21 represents the stoichiometric value (0.0285). As seen in Fig. 11, location L1 possesses higher HRR and temperature, coinciding approximately with the stoichiometric
 ${{\rm{H}}_2}$
mass fraction closer to the rear pylon surface. This shows that the magnitude of HRR at L1 mainly depends on the fuel-air mixing performance. A similar mechanism at L1 is observed for the other configurations as well.
Zoomed view of flame stabilisation location L1 over ZX (at y/d = 0) plane for P0 configuration used to visualise HRR (normalised), and T (K). The blue line represents the stoichiometric
 ${{\rm{H}}_2}$
mass fraction.

Comparison of HRR (normalised), temperature, OH,
 ${{\rm{H}}_2}$
O,
 ${{\rm{H}}_2}$
mass fractions and velocity magnitude along the dashed green line in Fig. 12 for P0 configuration at y/d = 0. The dashed grey and red lines represent the
 ${{\rm{H}}_2}$
mass fractions at peak HRR and stoichiometry, respectively.

3.3.2 L2 location
In the zone where the fuel jet exits the injector, the intense pressure difference leads to changes in the curvature of the fuel jet mixing layer due to expansion waves. This altered curvature [Reference Zapryagaev, Kiselev and Pavlov62, Reference Zapryagaev, Pickalov, Kiselev and Nepomnyashchiy63] creates a viscous instability known as the Taylor-Goertler instability, resulting in the formation of FJVPs within the mixing layer [Reference Terekhova50]. These FJVPs interact with subsonic CCVP III at location L2, promoting thorough mixing of the cold fuel jet with the recirculating hot product gases. The recirculation regions in the cavity depicted in Fig. 12 allow the hot gas combustion products to remain in contact with the fuel jet stream for extended periods, ensuring that hot gas mixtures always surround the cold fuel jet. To get further insight into the mixing process at location L2, a comparative study of different combustion parameters is conducted along the green dashed line at x/d = 25 over the XY plane at z/d = 0, as shown in Fig. 12. The variations of these parameters plotted across the fuel injector are illustrated in Fig. 15.
Comparison of HRR (normalised), temperature, OH,
 ${{\rm{H}}_2}$
O,
 ${{\rm{H}}_2}$
mass fractions and velocity magnitude along the dashed green line at z/d = 0 in Fig. 12 for P0. The dashed grey and red lines represent the
 ${{\rm{H}}_2}$
mass fractions at peak HRR and stoichiometry, respectively.

As before, the grey dashed line marks the
 ${{\rm{H}}_2}\;$
mass fraction at peak HRR, whereas the red dashed line marks the stoichiometric value. The thin heat release region at L2 indicates a fast reactant mixture formation and ignition. Mixing the fuel with the hot product gases in these locations results in a reactant mixture that is kinetically more reactive than, for example, in location L1. On closer inspection, it can be seen that the
 ${{\rm{H}}_2}\;$
mass fraction at the region of peak HRR is approximately 0.006, which is closer to the lower flammability limit of
 ${{\rm{H}}_2}$
. In addition, the underlying low local velocities (y/d =and 1 to 3) will facilitate longer residence time for the reactive radicals present in the hot combustion products such as OH, thereby stabilising the flame at these locations. Therefore, the flame can anchor over the fuel jet’s periphery, extending from the immediate exit of the fuel injector onwards. To sum up, the flame stabilisation at L2 is influenced by the T-G instability-induced mixing mechanism and the fast generation of kinetically reactive hot reactant mixture. A similar mechanism at L2 is also observed for the other pylon configurations.
3.3.3 L3 location
The interaction of FJVPs with the vortex structure II in P0 and P2 configurations (see Fig. 8) results in the formation of the heat release region L3 in these pylon configurations. In Fig. 16, it is evident that a larger flammable region exists for the P2 configuration where the stoichiometric
 ${{\rm{H}}_2}\;$
mass fraction and peak HRR are overlapped laterally.
Flame stabilisation locations L2 and L3 depicted on HRR (normalised) contour over XY plane at z/d = 9 for different pylon-cavity configurations. The blue line represents the stoichiometric
 ${{\rm{H}}_2}$
mass fraction, and the dashed green line is used to extract data to evaluate flameholding mechanisms.

For a detailed examination of the flame stabilisation mechanism at L3, various combustion parameters are extracted along the green dashed lines shown in Fig. 16 at x/d = 23 for P0 and P2 configurations and are plotted in Figs. 17 and 18, respectively.
Comparison of HRR, temperature, OH,
 ${{\rm{H}}_2}$
O,
 ${{\rm{H}}_2}$
mass fractions and velocity magnitude along the dashed green line in Fig. 16 for P0 configuration. The dashed grey and red lines represent the
 ${{\rm{H}}_2}$
mass fractions at peak HRR and stoichiometry, respectively.

Comparison of HRR, temperature, OH,
 ${{\rm{H}}_2}$
O,
 ${{\rm{H}}_2}$
mass fractions and velocity magnitude along the dashed green line in Fig. 16 for P2 configuration. The dashed grey and red lines represent the
 ${{\rm{H}}_2}$
mass fractions at L3, respectively.

As discussed in Fig. 15, the location L2 possesses a
 ${{\rm{H}}_2}\;$
mass fraction (0.004) closer to the lower flammability limit. Further moving laterally at either side of the fuel jet, a rise in HRR is observed at location L3, where an ultra-lean reactant mixture with 0.001
 ${{\rm{H}}_2}\;$
mass fraction is observed, indicative of a robust hot product gas contribution in the reactant mixture formation. Here, the region between y/d = −2.5 to 2.5 represents the wake region of the pylon. It is found that between y/d = −6 to −12 and 6 to 12, the velocity becomes well below 500 m/s due to counter-rotating vortex structures II and III. These vortex structures allow the hot gas combustion products to recirculate and reside longer adjacent to the fuel jet. As a result, a temperature rise of about 2000–2500 K is observed for the fuel-lean reactant mixture at these locations, contributing to the high HRR observed. This shows that the adjacent hot gas recirculation hugely influences the flame stabilisation at L3 for the P0 configuration.
An almost uniform lateral distribution of HRR at L3 spanning from y/d = −6 to −12 and 6 to 12 is observed for P2 (see Fig. 18). As observed previously, enhanced interaction between FJVP.2 and II in P2 results in the formation of a laterally reactive mixture within the flammability limits. The comparison between the lateral distribution of
 ${{\rm{H}}_2}\;$
mass fraction in P0 and P2 shows that the latter consists of a reactant mixture closer to the stoichiometric value, whereas the former possesses an ultra-lean reactant mixture. In addition to forming ignitable reactant mixtures closer to stoichiometry at L3 in P2, the vortex structures FJVP.2 and II create a locally low-velocity region of about 250 m/s at either side of the fuel jet. This increases the residence time of hot product gases, leading to a more or less uniform temperature distribution (∼2500 K). Owing to these multiple effects, the local fuel-lean mixtures at L3 in P2 achieve a uniformly distributed HRR between y/d = −6 to −12 and 6 to 12.
3.3.4 L4 location
As seen in Fig. 12 (XZ plane at y/d = 0), the flame stabilisation location L4 exists at the interface between the lower periphery of the fuel jet stream and the recirculating hot gases within the cavity. Figure 19 shows the cross-sectional view of L4 over the YZ plane at x/d = 30 for the three pylon configurations, highlighting the differences in the localised regions of heat release. It is evident from the figure that the flame stabilisation location L4 is located within the SFJVP for all three configurations marked within the green dashed rectangle. Extracts along the vertical green dashed line in Fig. 12 over the XZ plane at y/d = 0 are used to compare the combustion parameter variation for location L4 and is shown in Fig. 14. The dashed red line marks the stoichiometric
 ${{\rm{H}}_2}\;$
mass fraction, whereas the dashed grey line marks the mass fraction corresponding to the local peak in HRR. It is found that the
 ${{\rm{H}}_2}\;$
mass fraction at L4 is 0.001, which is well below the lower flammability limit mass fraction value (0.004). This again shows the influence of hot gas combustion products in forming an ignitable reactant mixture. The reactant mixture formation at L4 is based on a dispersive mixing mechanism where SFJVP interacts with the surrounding vortex structures FJVPs and III. Though the reactant mixture at L4 remains fuel-lean, the temperature rise of the mixture (about 2500 K) due to mixing with the hot gas combustion products recirculated within CCVP III extends the lean flammability limit further. This allows a favourable condition for the ultra-lean mixture at L4 to ignite easily and sustain higher HRR. In addition, the relatively low velocity within SFJVP facilitates the residence time required for fuel, air and combustion products to get well mixed and continuously supply the reactive mixture for sustaining a stable flame at this location.
x-vorticity lines depicted on HRR (normalised) distribution over YZ plane at x/d = 30 for different pylon-cavity configurations. The green dashed rectangle shows the flame stabilisation location L4.

Similar observations are made for other pylon-cavity configurations as well. It is found that the fuel jet penetration and the flame stabilisation location height are the same for both P0 and P1, whereas it is fairly increased for the P2 configuration. This inference is based on the vertical shift seen in the stoichiometric contour along the z/d direction. Besides, the spread of the flame stabilisation region downstream of the pylon and above the cavity can be evaluated by calculating the maximum width of the
 ${{\rm{H}}_2}\;$
stoichiometric envelope along the z/d direction. It was found that the spread is greater for P2 when compared to other configurations.
3.4 Impact of pylon shape on overall performance parameters
In the study, the authors compared performance parameters such as combustion efficiency
 $\;{{\unicode{x03B7}}_{\rm{c}}}$
, total pressure loss Λ, and flammable plume area fractions
 ${\rm{F}}{{\rm{P}}_{\rm{f}}}$
for various pylon configurations. The
 ${\rm{F}}{{\rm{P}}_{\rm{f}}}$
represents the area where the OH mass fraction is above 0.0015 that falls within the flammability limits [Reference Oamjee and Sadanandan40]. These performance parameters are calculated by extracting data from 800 slices (YZ plane) along the computational domain’s axis and spatially integrating over each planar cross-sectional area. The results are illustrated in Fig. 20. It is found that there is minimal difference in
 ${{\unicode{x03B7}}_{\rm{c}}}$
and Λ among the pylon configurations. However, there is a notable variation in
 ${\rm{F}}{{\rm{P}}_{\rm{f}}}$
within the flameholder, which is attributed to the diverse geometry-specific pylon-induced vortex structures facilitating the generation of reactant mixtures.
Comparison of a) combustion efficiency, b) total pressure loss, flammable plume area fraction c) behind the pylon above the cavity and d) within the cavity for different pylon-cavity configurations. The inset shows the regions above the cavity (blue colour) and within the cavity (orange colour).

Waterfall plot of temperature contour above 2100 K within P0, P1 and P2 configurations. The blue line represents the
 ${{\rm{H}}_2}$
mass fraction 0.004 (lower flammability limit). The green iso-surface represents the stoichiometric
 ${{\rm{H}}_2}$
mass fraction.

Figure 20(c) shows a higher flammable plume area behind the pylon and above the cavity (region of interest (ROI) in blue colour within the inset) for all the pylon geometries with grooves. This agrees with the earlier observations on these configurations’ reactant mixture formation and flame stabilisation locations. For regions below the cavity (ROI in orange colour within the inset), significantly higher
 ${\rm{F}}{{\rm{P}}_{\rm{f}}}\;$
is observed for P2 when compared to other configurations (see Fig. 20(d)). As described earlier, this is due to the interaction of vortex structure II with FJVP.2 in extending the spread of the flammable mixture in the lateral direction. Therefore, P2 possesses a better flameholding capability than all other configurations studied. For a better visual impression of the efficacy of volumetric heat transfer from the burning fuel into the primary air stream, a waterfall plot of the temperature distribution above 2100 K is shown in Fig. 21.
4.0 Conclusion
This study mainly focuses on exploring how the vortex structures induced by the pylon impact the mixing and flame stabilisation mechanisms in a supersonic pylon-cavity flameholder. RANS-based simulations were carried out of reactive flow using three pylon geometries with
 ${90^{^\circ \;}}$
sonic
 ${{\rm{H}}_2}$
fuel injection from the cavity floor. The vortex structures induced by the pylon geometries II, III and IV are crucial in enhancing mixing and forming reactants at various locations within the flameholder by interacting with the fuel jet-generated vortex pairs FJVP and SFJVP. The findings show that the different levels of interaction between these structures resulted in the formation of four major heat release or flame stabilisation locations within the pylon-cavity flameholder. The first location (L1) forms at the interface between the fuel jet and the crossflow aided by the K-H instability. The varying levels of mixing of recirculating hot gases with the fuel stream are essential in extending the flammability limits at the heat release locations within the cavity at L2, L3 and L4. The mixing rate depends on the spatial location and the interaction of the underlying flow features. A comparative combustion performance analysis between the different configurations shows a higher heat release magnitude and spread for the pylon configuration P2, making it the preferable overall flameholder configuration under the conditions that are investigated.
Though RANS can broadly provide various insights into the mixing and combustion performance of the system, it lacks the temporal information of different transient phenomena and flow features such as the vortex shedding due K-H instability at various regions, influence of periodic coherent flow structures within the flameholder on mixing and flame stability, ignition delay time, and the effect of varying local equivalence ratio. Therefore, it is highly recommended to perform temporally resolved investigations (Hybrid RANS/LES) on pylon configuration P2 in future works to have a detailed insight into the transient evolution of reactant mixture formation, mixture ignition and flame development and flame stabilisation processes.
Acknowledgments
The authors would like to extend their gratitude to Dr. Deepu M. from the Department of Aerospace Engineering for assisting with the utilisation of the computational facility at IIST.
Competing interests
The author(s) declare none.