I. INTRODUCTION
The mechanical properties of semiconductors such as Gallium Arsenide (GaAs) are very important to optoelectronic applications as they determine the structural quality of heterostructures and therefore the performance of the produced devices.Reference Le Bourhis and Patriarche1 When misfit structures are required, the performance is dramatically affected by threading dislocations that plastically relax the structures and extend through the active layers. The mechanisms by which such dislocations appear in mismatch structures are still the subject of ongoing research with the development of bonded substructures and compliant sublayers.Reference Le Bourhis and Patriarche1
Instrumented indentation technique allows probing the mechanics of such structures at relevant length scale and detects the elastic–plastic transition.Reference Le Bourhis and Patriarche1, Reference Wang and Pirouz2 Bulk III–V semiconductors present very poor density of native dislocations so that the transition is abrupt (so-called pop-in event) and is believed to be related to dislocation homogeneous nucleation which occurs at a fraction of the ultimate strength (G/10 with G the shear modulus).Reference Page, Oliver and McHargue3, Reference Lorenz, Zeckzer, Hilpert, Grau, Johansen and Leipner4 Previous studies reported slight difference according to the polar character of the indented surfaceReference Le Bourhis, Patriarche, Largeau and Rivière5 and according to the doping of specimens.Reference Le Bourhis and Patriarche6 In contrast, on coherently strained superlattices of InGaAs grown on InP, the yield pressure was observed to decrease with increasing strain modulation in the superlattice. At the highest strains of 0.8%, the yield pressure was half the value of the unstrained one.Reference Jayaweera, Bushby, Kidd, Kelly and Dunstan7
The use of microscopies to observe subsequently the indentation deformation has proved to be a great source of complementary information and has allowed for a great insight into the mechanical behavior.Reference Le Bourhis and Patriarche1–Reference Lloyd, P’Ng, Clegg, Bushby and Dunstan8 At the nanoindentation scale, thin foils can be prepared for transmission electron microscopy (TEM) in plan view in such a way that the entire plastic zone is contained in the foil (backside etching) or in cross-sectional view using focused ion beam (FIB) milling.Reference Le Bourhis and Patriarche1
In this study, we decided to fabricate (001) GaAs with a thin buried elastically strained InGaAs sublayer and to determine changes on the elastic–plastic transition. TEM was used to observe and characterize the plastic zone structure once pop-in was passed.
II. EXPERIMENTAL PROCEDURE
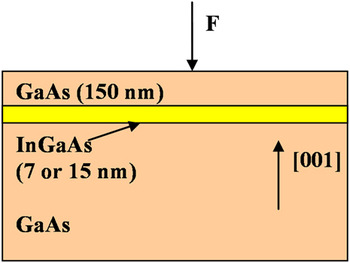
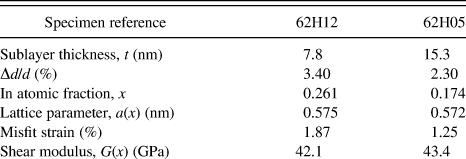
The (001) “epi-ready” wafers of undoped GaAs have been used as reference and to grow InxGa1−xAs/GaAs undoped heterostructures. Two different compositions (x = 0.174 and 0.261) of sublayers were deposited with misfit strains of 1.25 and 1.87%, respectively (Table I). These were obtained by molecular beam epitaxy at a growth temperature of 450 °C. The top layer of GaAs was 150-nm thick, whereas the InGaAs sublayer was either 7-or 15-nm thick. The final structure consists in a (001) GaAs specimen modified by a buried elastically stressed sublayer (Fig. 1) which influence on the mechanical response is analyzed.
Schematic representation of the (001) GaAs modified with a buried and compressive sublayer of InGaAs. Geometric characteristics and orientation of the specimens are shown. The loading indentation direction is along  .

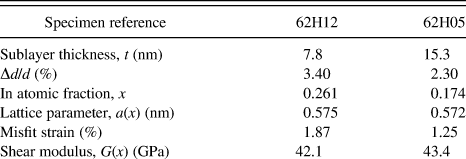
In1−xGaxAs sublayer thickness t, experimental Δd/d, In atomic fraction x, lattice parameter a(x), and shear modulus G(x) (GPa) of the studied specimens (62H12 and 62H05).
The energy per surface unit (Joule per square meter) is calculated from Eq. (2).
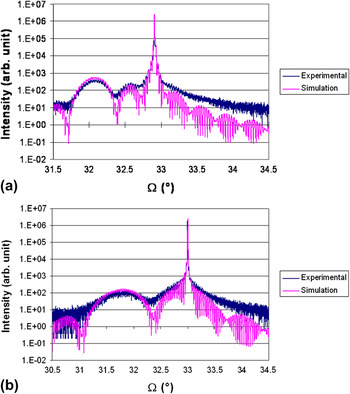
The structure of the InGaAs sublayers was determined through high resolution x-ray diffraction (HR-XRD) Ω/2θ scans using a X’Pert Pro Materials Research Diffractometer (MRD) PANalytical instrument.
The samples were deformed by a Berkovich diamond pyramid using a Nano Hardness Tester from the Swiss Center for Electronic and Microtechnology (CSEM Switzerland, Almelo, Netherlands). The tests were performed at room temperature under force control. The maximum load varied between 0.2 and 1 mN. Arrays of about 90 indentations were made with 10 large indentations (obtained under 50 mN) used as markers for subsequent localization in the TEM samples. Large load indentations were also carried out to determine the indentation modulus. The calibration procedure suggested by Oliver and PharrReference Oliver and Pharr9 was used to correct the load frame compliance of the apparatus and the imperfect shape of the indenter tip.
To prepare TEM plan-view thin foils of indented samples, the undeformed side of the sample (the back side) was mechanically and chemically thinned with a bromine–methanol solution until sufficiently thin to transmit the electron beam. The samples have been observed by TEM in a Philips CM20 Super Twin microscope (Philips, Eindhoven, Netherlands) operated at 200 kV equipped with a double-tilt sample holder (±28°).
III. RESULTS AND DISCUSSION
A. Structure and elastic energy stored in the heterostructure
The orientation of the modified and reference substrates was [001] (Fig. 1). The amplitude of the generated stresses depends upon the lattice misfit between the substrate and the InxGa1−xAs sublayer. Figure 2 shows the HR-XRD diffractograms obtained on the two modified GaAs substrates (namely 62H12 and 62H05). Assuming a pseudomorphic deformation of the strained layer with a tetragonal distortion in the [001] direction, we can determine the mismatch between the InGaAs alloys and the GaAs matrix.Reference Hornstra and Bartels10

High resolution x-ray diffraction diffractograms (Ω/2θ scan) obtained on the two modified GaAs substrates for the 004 reflexion (a) 62H12 (t = 7.8 nm) and (b) 62H05 (t = 15.3 nm). The adjustments of the experimental data are shown in each case.

where both ν(x) and a(x) are functions of sublayer composition. ν(x) is the Poisson’s ratio, and a(x) is the lattice parameter both linearly interpolated between those of GaAs [a(0) = 0.565325 nm, ν(0) = 0.31] and InAs [a(1) = 0.60583 nm, ν(1) = 0.35]. Solving Eq. (1) with experimental Δd/d allows determining the composition and corresponding lattice parameter. The results are shown in Table I.
We verified that both sublayers were indeed not plastically relaxed even after the indentation process as discussed below in view of TEM observation. We obtained a(x) > a(0), therefore, both InGaAs sublayers are determined to be stressed under elastic compression.
The elastic energy stored by the InGaAs sublayer per surface unit can be calculated usingReference Matthews and Nabarro11:

It is proportional to the sublayer thickness t, to the shear modulus G(x), and to the square of the mismatch Δa/a which respective influences are balanced in part as shown in Table I. In fact the layer being twice as thick as the other is also the less mismatched with an energy difference of about 10%. The obtained elastic energies are in the range of ∼0.4 J/m2.
B. Elastic–plastic transition
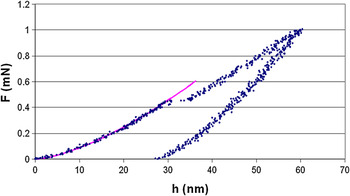
The mechanical response of the modified GaAs substrates has been compared to that of a bare GaAs reference. We used nanoindentation Berkovich tip to load the (001) surface along its normal (Fig. 1). For the lowest loads used during this study (0.1, 0.2 and 0.3 mN), the loading curve superimposed with the unloading one. This was obtained for both reference and modified substrates and indicates that up to 0.3 mN the mechanical response remains elastic and reversible. For maximum loads of 1 mN, we detected on the loading part a penetration discontinuity at a critical load (Fig. 3) also called pop-in load. Above this threshold load, loading and unloading curves separate with a residual penetration being determined.
Loading–unloading curves under 0.5 mN for the (001) GaAs modified with a thin buried elastically strained InGaAs sublayer (62H12, t = 7.8 nm). Under 0.1, 0.2, and 0.3 mN (not presented here), the loading and unloading curves superimpose as the deformation is only elastic. At F c = 0.46 mN, a discontinuity in the loading curve (pop-in) is observed which amplitude is about 4 nm. Upon unloading a residual mark remains and can be observed by TEM. The continuous line represents the Hertzian loading of a spherical indenter with 310-nm radius.

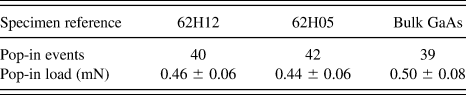
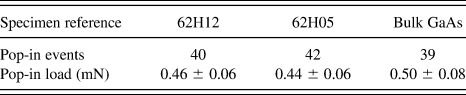
A statistics over about 40 events for each specimen was made to determine the mean and standard deviation of the load at pop-in for reference and modified substrates (Table II). The obtained results for modified substrates with elastically stressed sublayers are obtained at lower levels than on the reference substrate for which we obtained 0.50 ± 0.08 mN. However, we cannot differentiate the two modified substrates.
Pop-in statistics of modified and bulk substrates (mean value ± standard deviation).
To get a further insight into these results, we assumed as a first approximation that before pop-in, the loading curve could be represented by an Hertz type curve.Reference Johnson12–Reference Kiely, Hwang and Houston14 In that case, the load (F)–deformation (h) relationship writes:
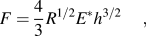
where R is the radius of the extremity of the tip and E* is the composite modulus. E* can be determined from the unloading curves using Oliver and PharrReference Oliver and Pharr9 procedure. This parameter was determined employing the large load indentation tests and found to be about E* = 120 GPa in relatively good agreement with Ref. Reference Korte, Farrer and Clegg15 (and reference therein). We used F(h) relationship to fit the first part of experimental loading curve (see continuous line in Fig. 3) and obtained a tip extremity radius of about R = 310 nm. The contact radius a c at pop-in can be determined using the following relationReference Johnson12–Reference Kiely, Hwang and Houston14
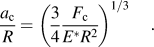
For a critical load of F c = 0.46 mN (Fig. 3), the contact radius at pop-in could be estimated at about a c = 96 nm.
The indentation energy accumulated in the elastic regime writes
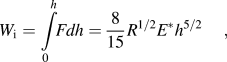
and can be compared at pop-in (h = h c) to the energy stored by the sublayer in the area of ∼

We obtained a W e/W i ratio of about 20%, which is to say that the elastic energy stored in the mismatch compressively stressed sublayer represents a non-negligible part of the energy involved in the indentation test. We suggest that the stored energy could account partly for the observed lower threshold load at elastic–plastic transition. Of course, one has to consider that the sublayers are deeply buried. At elastic–plastic transition, the depth of the sublayers (150 nm) is estimated to be about 1.5a c. Dislocation nucleation in bulk specimens is often discussed in terms of maximum shear stress which peaks closer to the surface at 0.5a c.Reference Lorenz, Zeckzer, Hilpert, Grau, Johansen and Leipner4, Reference Kiely, Hwang and Houston14 The stress field is relatively complex in the modified substrates since size effect is expected with a deviation from infinite bulk hypothesis. The Hertzian stress field extends considerably with contours of equal stress showing a decrease in amplitude as depth increases for all principal stresses with a change from compressive to tensile for two components at approximately 1.3a c (σ 1 and σ 2, ν = 0.26).Reference Johnson12, Reference Fischer-Cripps16 These components are expected to be affected by the presence of a thin and less stiffReference Korte, Farrer and Clegg15 sublayer with the observed assistance in the activation of dislocation sources.
C. Plastic zone structure
Using TEM postmortem, no plastic zone could be detected at the expected indent sites in both types of substrates for maximum loads of 0.1, 0.2, and 0.3 mN. This could be checked carefully as arrays of indentations were made to facilitate the indents’ locations. This confirms that up to these loads, the mechanical response is purely elastic and reversible for bulk and modified substrates. Moreover, in these zones, we did not detect any interfacial dislocations.
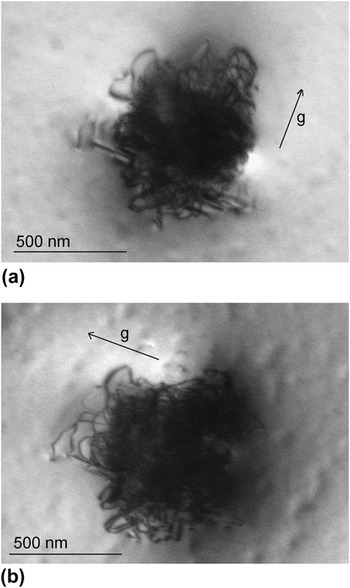
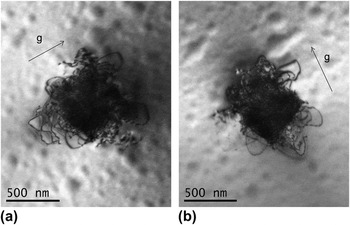
For a maximum load of 1 mN (that is above the pop-in threshold load), we observed systematically a plastic zone as shown in Figs. 4 and 5 for the two substrate types. For both modified and reference substrates, the observed plastic zone comprises a central zone which corresponds to a highly strained zone where it is very difficult to recognize any individual dislocation.Reference Chaudhri17, Reference Largeau, Patriarche and Le Bourhis18 For instance, in semiconducting materials under a Vickers tip (which has the same aspect ratio as a Berkovich one) the plastic strain along the loading axis ε z reaches values as high as 28% just beneath the indent site.Reference Largeau, Patriarche and Le Bourhis18 As a matter of fact, it is impossible to investigate the interface state with observations through this zone in the case of the modified substrates. Only FIB cross-sectional preparation would permit this observation.
TEM plan-view image of the indent site made under 1 mN at room temperature (RT) in the modified (001) GaAs (62H05, t = 15.3 nm) under (a) g = [220] diffraction condition and under (b) g = [ ] diffraction condition.

TEM plan-view image of the indent site made under 1 mN at RT in bulk GaAs under (a) g = [220] diffraction condition and under (b) g = [ ] diffraction condition.

In addition to the central zone, a few individual dislocations are observed at the indentation edge. They are known to organize in two rosette arms along <110> directions parallel to the indented surface under larger loads.Reference Le Bourhis and Patriarche1 A few segments vanish under one of the diffraction conditions used and correspond to segments with Burgers vectors parallel to the indented surface. They are composed by a screw segment starting in the dense plastic zone and a 60° segment ending in the dislocation line. It is interesting to note the modified substrate that dislocations tend to organize forming groups of segments parallel to the InGaAs/GaAs interface. The thin foil thickness is estimated to be above 150 nm and those segments could be located at the interface. Geometric considerations do not rule out this hypothesis, while segments tend to be less organized in the bulk specimen. Again, after indentation test, we have not detected any interfacial dislocations relaxation around the indent site (this phenomenon in transparent area would be easy to identify since a dense square net of dislocations would be observed).
IV. CONCLUSIONS
Elastic–plastic transition of (001) GaAs surfaces modified by InGaAs-buried layers could be investigated using Berkovich nanoindentation. It was determined from the pop-in event observed in the force control mode of the indentation machine that elastic–plastic transition appeared at slightly lower loads (0.44–0.46 mN) for modified substrates, when compared to bare GaAs surface (0.50 mN). We did not detect plastic relaxation at the interface while estimations indicate that for both studied sublayers, the stored elastic energy is about 20% of the elastic indentation energy reached at elastic–plastic transition and could account for the lower transition observed. We suggest that the earlier elastic–plastic transition could result from the stored elastic energy and modification of stress field. This result could be usefully used when tailoring substructures. It would therefore be of utmost interest to determine how the buried layer depth and stored energy amplitude influence the transition. The influence of the sign of the mismatch could also be considered on either GaAs/GaAsP/GaAs or InP/InGaAs/InP systems with tensile-stressed buried layer.