
I. INTRODUCTION
Segregation is an inherent characteristic during the process of alloy solidification, and it is one of the important quality defects in the continuous casting (CC) process. During the CC solidification process of molten steel, the solute will be enriched at the solidification front (mushy zone) of the strand, which can promote the precipitation of inclusions. In response, the precipitation of inclusions may affect the solute concentration distribution and segregation in strand. Reference You, Michelic, Bernhard, Loder and Wieser1,Reference Liu, Wei and Cai2 Literature Reference Liu, Wei and Cai2,Reference Kang, Lee, Koo, Kim and Heo3 pointed out that the precipitation of inclusions could reduce the solute concentration in strand, which could finally restrain the solute segregation effectively. Therefore, taking the inclusion precipitation into consideration was required for the accurate prediction of solute segregation during solidification process.
In reaction to the phenomenon of solutes segregation and inclusions precipitation during the molten steel solidification process, previous researches Reference Nastac and Marsden4,Reference Li, Chen, Fu, Ma, Liu, Chen, Cao, Luan and Li5 were carried out by the means of numerical simulation and experiment. The solute segregation behavior Reference Li, Chen, Fu, Ma, Liu, Chen, Cao, Luan and Li5,Reference Heckl, Rettig and Singer6 and inclusions precipitation (such as MnS, Reference Wu, Zheng, Li, Matsuura and Tsukihashi7 SiO2, Reference Choudhary8 TiN Reference Wang, Cheng, Qiu, Zhao and Gan9 and so on Reference Wang, Yang and Bao10 ), as well as its influencing factors (such as soft reduction, Reference Domitner, Wu, Kharicha, Ludwig, Kaufmann, Reiter and Schaden11 electromagnetic stirring, Reference Liu, Xu, Qiu and Zhang12,Reference Sun, Li, Cheng, Qiu, Liu and Zeng13 secondary cooling mode, Reference Long and Chen14 and other technology Reference Sun and Zhang15,Reference Li, Teng, Feng and Yang16 ) during the metallurgical process were comprehensively investigated. However, most researches mainly focused on studying the solute segregation and inclusion precipitation separately, Reference Liu17–Reference Xiang, Yue, Fan, Qiu and Pei19 or systematically studying the interaction between microsegregation and inclusion precipitation. Reference You, Michelic, Wieser and Bernhard20 Researches on the interaction between the macrosegregation and inclusion precipitation during CC process were mainly carried out by experimental method, Reference Kang, Lee, Koo, Kim and Heo3,Reference Ueshima, Sawada, Mizoguchi and Kajioka21 and it was difficult to obtain the distribution of solutes and inclusions in the whole macroscopic section of the strand. And there were a little reports on simulation of the interaction between inclusion precipitation and solute segregation, as well as predicting the solute segregation more accurately by taking the inclusion precipitation into consideration during the high sulfur steel CC process. So it is meaningful to study the interaction between solutes macrosegregation and inclusion precipitation during the CC solidification process on a macroscale, as well as the accurate prediction of the solute distribution and inclusion precipitation distribution in the strand.
During the solidification process of high sulfur-free cutting steel, the segregation of solute S was serious at the end of solidification, and a large amount of MnS would precipitate in the strand. The precipitation distribution of MnS will affect the solute segregation and steel machinability. Reference Xu, Liu, Guo and Chen22 In this study, in allusion to high sulfur steel slab CC, a three-dimensional (3D) model coupled with flow, heat and solute transport was established to investigate the solute enrichment and distribution during the process of cooling and solidification process of molten steel. Basing on the results of solute distribution in strand calculated by the 3-D model, the MnS precipitation thermodynamic model was developed to analyze the precipitation and distribution of MnS. And the effect of MnS precipitation on the solute distribution was also discussed. Understanding and predicting the interaction between MnS precipitation and solute segregation more accurately could provide a theoretical basis for the adjustment of operating parameters to control and improve the solute macrosegregation in the practical production of high sulfur steel CC.
II. MATHEMATICAL MODELING
A. 3-D macrosegregation model
To study the solute enrichment and segregation distribution during the slab CC process of high sulfur steel, a 3-D macrosegregation model coupled with flow, heat, and solute transport was established.
1. Assumptions
The model made following assumptions:
-
(i) It was assumed as a steady state during CC process.
-
(ii) The transport phenomena in slab were completely symmetrical, and only a quarter of strand region was simulated.
-
(iii) Molten steel in mold was assumed as incompressible Newtonian fluid.
-
(iv) Curvature, bulging, taper and oscillation of the strand were ignored.
-
(v) Molten steel satisfied local thermodynamic equilibrium in the model.
2. Flow and turbulence model
The continuity and momentum equations are used to describe the flow pattern of the molten steel. The equations are expressed as
 $$\rho {{\partial \left( {\rho {u_j}} \right)} \over {\partial {x_i}}} = 0\quad ,$$
 $$\rho {{\partial {u_i}{u_j}} \over {\partial {x_j}}} = {\partial \over {\partial {x_j}}}\left[ {{\mu _{{\rm{eff}}}}\left( {{{\partial {u_i}} \over {\partial {u_x}}} + {{\partial u_j^{}} \over {\partial {x_i}}}} \right)} \right] - {{\partial P} \over {\partial {x_i}}} + {S_{\rm{B}}} + {S_{\rm{P}}}\quad ,$$
where S B and S P are the thermosolutal buoyancy and the source term of velocity, respectively. It can be defined as
 $${S_{\rm{B}}} = \rho {g_i}{\beta _{\rm{T}}}\left( {T - {T_{\rm{L}}}} \right) + \sum\limits_m {\rho {g_i}} {\beta _{{\rm{C}},m}}\left( {{C_{{\rm{L}},m}} - {C_{{\rm{L}},m,0}}} \right)\quad ,$$
 $${S_{\rm{P}}} = {{{{\left( {1 - {f_{\rm{l}}}} \right)}^2}} \over {\left( {{f_{\rm{l}}}^3 + \varepsilon } \right)}}{A_{{\rm{mushy}}}}\left( {v - {v_{\rm{p}}}} \right)\quad ,$$
where A mushy is the mushy zone constant, Reference Brent, Voller and Reid23 C L,m,0 is the solute concentration at the liquid temperature, v p is casting speed, ε is a constant (0.001) to ensure that the divisor of Eq. (4) is not equal to zero.
The low-Reynolds number K-ε turbulent model is used to represent the turbulence and solidification phenomena during the CC process. Reference Yang, Zhao, Zhang, Deng, Li and Gan24
3. Heat-transfer and solidification model
The heat-transfer and solidification phenomenon is described as
 $$\rho {u_i}{{\partial H} \over {\partial {x_i}}} = {\partial \over {\partial {x_i}}}\left( {{\lambda _{{\rm{eff}}}}{{\partial T} \over {\partial {x_i}}}} \right)\quad ,$$
where H is the total enthalpy, which can be calculated by the latent enthalpy and sensible enthalpy.
4. Solute transport model
The conservation equation for multicomponent alloy, which is based on the volume averaging technique can be expressed as
 $${{\partial \left( {\rho {u_i}{C_m}} \right)} \over {\partial {x_i}}} = {\partial \over {\partial {x_i}}}\left( {\rho D_{\rm{L}}^m{{\partial {C_m}} \over {\partial {x_i}}}} \right) + {S_{{\rm{dif}}}} + {S_{{\rm{C,con}}}}\quad ,$$
where S dif and S C,con are the molecular diffusion item and convection diffusion item, respectively. And it can be expressed as follows:
 $${S_{{\rm{dif}}}} = {\partial \over {\partial {x_i}}}\left[ {\rho {f_{\rm{S}}}D_{\rm{S}}^m{{\partial \left( {{C_{{\rm{S}},m}} - {C_m}} \right)} \over {\partial {x_i}}}} \right] + {\partial \over {\partial {x_i}}}\left[ {\rho {f_{\rm{L}}}D_{\rm{L}}^m{{\partial \left( {{C_{{\rm{L}},m}} - {C_m}} \right)} \over {\partial {x_i}}}} \right]\quad ,$$
 $${S_{{\rm{C,con}}}} = {\partial \over {\partial {x_i}}}\left[ {\rho \left( {{u_i} - {u_{{\rm{s}},i}}} \right)\left( {{C_{{\rm{L}},m}} - {C_m}} \right)} \right]\quad .$$
Basing on the mixture theory, the solute concentration in each computational volume can be defined as
 $${C_m} = {f_{\rm{L}}}{C_{{\rm{L}},m}} + {f_{\rm{S}}}{C_{{\rm{S}},m}}\quad .$$
The C L,m and C S,m can be expressed as
 $${C_{{\rm{L}},m}} = {{{C_m}} \over {1 + {f_{\rm{S}}}\left( {{k_m} - 1} \right)}}\quad ,$$
 $${C_{{\rm{S}},m}} = {{{k_m}{C_m}} \over {1 + {f_{\rm{S}}}\left( {{k_m} - 1} \right)}}\quad .$$
5. Division of computational domain
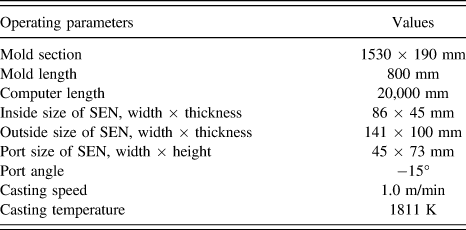
Because the strand is symmetrical, only a quarter of the strand region was simulated. The model has about 550,000 grid cells with a structured mesh. The operating parameters for the mold are presented in Table I.
The operating parameters for the mold.

6. Boundary conditions
Basing on the law of mass conservation, the inlet velocity of molten steel was calculated according to the casting speed. The turbulent kinetic energy and the turbulent energy dissipation in the inlet, which were calculated by the semiempirical relations, were 0.0021 m2/s2 and 0.0077 m2/s3, respectively. The initial temperature of the molten steel was 1811 K. The initial concentration of the solute element in the molten steel are presented by Table II.
Initial concentration of solute elements in molten steel, wt%.

According to the measured results of the water flow rate on strand surface, the heat flux on different cooling zones of strand surface was calculated. Then the heat flux was compiled and loaded as a user-defined function into the 3-D model, which was applied to calculate the heat transfer and solidification, as well as the temperature distribution of the strand during the CC process. The heat flux on strand surface includes mold zone and secondary cooling zone. The specific description of the heat-transfer boundary condition in this model please refers to Ref. Reference Long, Dong, Chen, Liao and Ma25.
7. Thermophysical properties
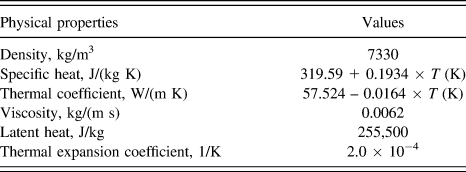
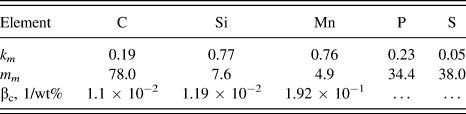
The steel physical properties, which were used in the model are presented by Table III. The equilibrium partition coefficients (k m ), the slopes of liquidus line (m m ) and the solute expansion coefficient (βc) of solute elements are presented in Table IV. Because the available accurate data are quite few and the relative atomic mass of elements P, S are similar to Si, the value of solute expansion coefficient of solute elements S, P were assumed the same as the solute element Si in the model. The value of solute expansion coefficient of elements C, Si, and Mn are referenced from the publications. Reference Yang, Zhao, Zhang, Deng, Li and Gan24,Reference Meng and Thomas26
The thermo–physical parameters of steel.

Equilibrium partition coefficients, liquidus slopes and expansion coefficients of solutes.

In this article, the phenomena of turbulent flow, heat, and solute transportation during the CC process was simulated by the commercial computational fluid dynamics software of Fluent, which is based on finite volume method. To make the calculation easier to converge, an unsteady computational model was adopted.
B. Thermodynamic model of MnS precipitation
During the solidification process of molten steel, solutes Mn and S will concentrate at the solidification front. When the concentrations of solutes Mn and S exceed the equilibrium concentration of MnS precipitation, MnS will precipitate and the reaction can be described as Eq. (12). The standard Gibbs free energy of MnS precipitation in the liquid phase and mushy zone was calculated by Eq. (13). Reference Ueshima, Isobe, Mizoguchi, Maede and Kajioka27
 $$\left[ {{\rm{Mn}}} \right] + \left[ {\rm{S}} \right] = \left( {{\rm{MnS}}} \right)$$
 $$\Delta {G^\Theta } = - 165{\rm{,}}146 + 90.84T$$
If there was MnS precipitating, the solutes concentration in the liquid phase would be equal to the equilibrium concentration for the MnS precipitation, and it can be calculated by
 $$\left( {{C_{{\rm{eq}},{\rm{Mn}}}} \times {f_{{\rm{Mn}}}}} \right) \times \left( {{C_{{\rm{eq,S}}}} \times {f_{\rm{S}}}} \right) = {1 \mathord{\left/ {\vphantom {1 {{K_{{\rm{MnS}}}}}}} \right. \kern-\nulldelimiterspace} {{K_{{\rm{MnS}}}}}}\quad ,$$
where C ep,Mn and C ep,S represent the equilibrium concentrations of solutes Mn and S for MnS precipitation at some temperature, respectively. f Mn, f Mn are the activity coefficient of solute Mn, S.
 $$\lg {f_i} = e_i^i\left( {{\omega _i}} \right) + \sum\limits_{i \ne j} {e_i^j} \left( {{\omega _j}} \right)\quad ,$$
where
 $e_i^i$
and
 $e_j^i$
are the activity interaction coefficient and its values in 1873 K are shown in Table V. The activity coefficients of Mn and S at other temperatures are calculated by
 $$\lg {f_{{\rm{Mn,T}}}} = \left( {{{2557} \mathord{\left/ {\vphantom {{2557} {T - 0.365}}} \right. \kern-\nulldelimiterspace} {T - 0.365}}} \right)\lg {f_{{\rm{Mn}},1873\;{\rm{K}}}}\quad ,$$
 $$\lg {f_{{\rm{S,T}}}} = \left( {{{3280} \mathord{\left/ {\vphantom {{3280} T}} \right. \kern-\nulldelimiterspace} T} - 0.75} \right)\lg {f_{{\rm{S}},1873\;{\rm{K}}}}\quad .$$
Activity interaction coefficient at 1873 K.

The contents of Mn and S in MnS inclusion are supposed to be the ideal chemical ratio during the precipitation of MnS.
 $${{{C_{{\rm{l,Mn}}}} - {C_{{\rm{eq,Mn}}}}} \over {{M_{{\rm{Mn}}}}}} = {{{C_{{\rm{l,S}}}} - {C_{{\rm{eq,S}}}}} \over {{M_{\rm{S}}}}}\quad ,$$
where C l,Mn and C l,S are the concentration of Mn and S before the precipitation of MnS, respectively. M Mn and M S are the relative atomic mass of Mn and S, respectively.
The solutes Mn and S in the system satisfied mass conservation whether the MnS is precipitated or not.
 $$\Delta {C_{{\rm{Mn}}}} = {C_{{\rm{l,Mn}}}} - {C_{{\rm{eq,Mn}}}}\quad ,$$
 $$\Delta {C_{\rm{S}}} = {C_{{\rm{l,S}}}} - {C_{{\rm{eq,S}}}}\quad ,$$
 $$\Delta {C_{{\rm{MnS}}}} = \Delta {C_{{\rm{Mn}}}} + \Delta {C_{\rm{S}}}\quad ,$$
where ΔC Mn and ΔC S are the consumption of free dissolved concentration of solutes Mn and S due to MnS precipitation, respectively. When the system does not satisfy the thermodynamic condition of MnS precipitation, namely, there is no precipitation of MnS, ΔC Mn, ΔC S, and ΔC MnS all are equal to zero.
This study mainly focused on the promotion of solute enrichment on the precipitation of MnS and the precipitation distribution of MnS in the liquid phase and mushy zone during the solidification process of slab CC. The precipitation of MnS in solid phase of the strand was not considered.
III. SIMULATION RESULTS AND DISCUSSION
A. Solute distribution and macrosegregation
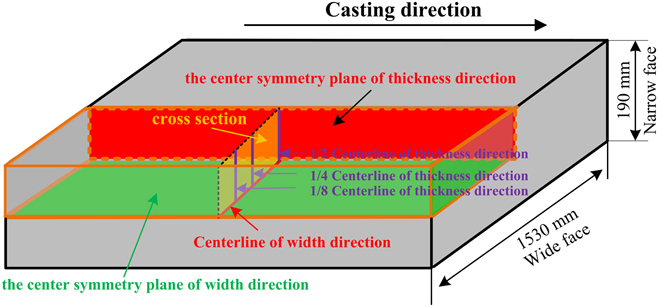
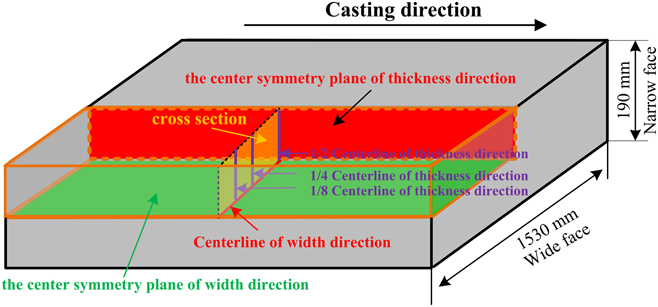
The distribution of temperature and solutes in strand were calculated by the 3-D model. Figure 1 was the sketch map of the characteristic planes and lines in strand. In Fig. 1, a quarter of the strand region was simulated. The red and the green sections were the center symmetry plane of the strand on the thickness and width direction, respectively. The yellow section was the cross section of strand, and the blue and red lines were the center line along the thickness and width direction on the strand cross section, respectively. Those planes and lines were the characteristic regions of solute segregation in strand. Solute distribution and MnS precipitation on these characteristic planes and lines would be analyzed and discussed next.
Sketch map of characteristic planes and lines in the strand.
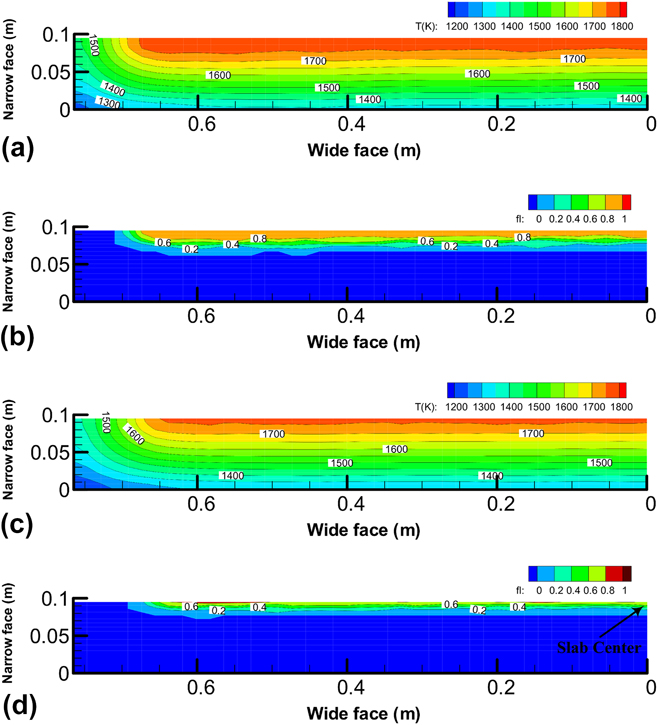
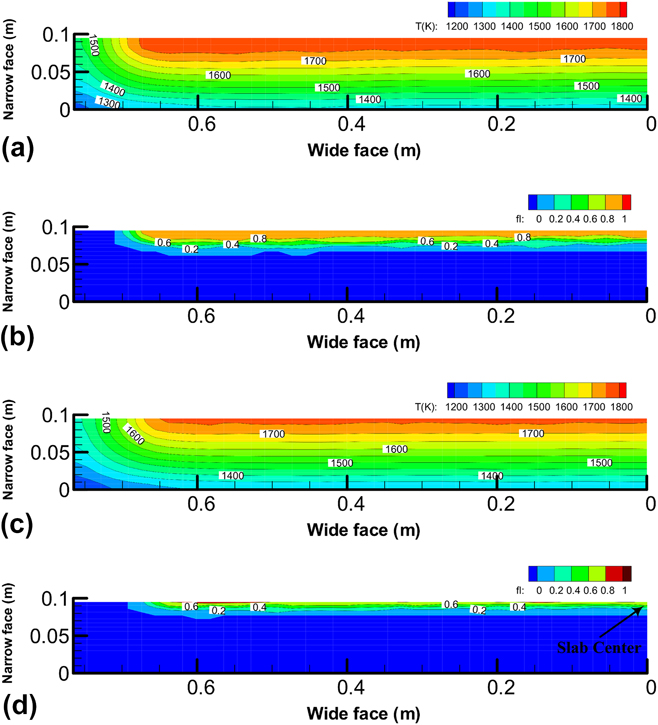
Figures 2(a) and 2(c) indicated that the temperature on the cross section decreased gradually from inside to outside of the strand. Due to the combined transverse and longitudinal cooling, the temperature at the strand corner was the lowest. Along with the CC process, the strand was cooled gradually, resulting in that the area of high-temperature zone in strand center on the cross section 15 m away from meniscus was smaller than that of 12 m. Figure 2(b) showed that most of the region in strand center on the cross section 12 m away from meniscus was mushy zone. But the strand was almost solidified completely at the location 15 m away from meniscus, where there was only a narrow band of mushy zone remained at the center of the strand. And its maximum liquid fraction was around 0.8, located in the strand center 0.2 m away from the strand narrow surface, as shown in Fig. 2(d).
Temperature and liquid fraction distribution on strand cross section. (a) Temperature at 12 m away from meniscus, (b) liquid fraction at 12 m away from meniscus; (c) temperature at 15 m away from meniscus, (d) liquid fraction at 15 m away from meniscus.
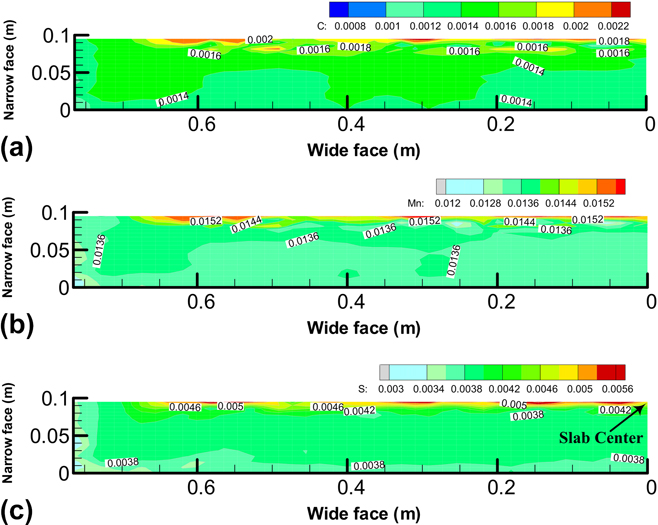
According to Figs. 3 and 2(d), solute C, Mn, and S all have a narrow solute enrichment zone in the mushy zone, and the region of the solute enrichment zone corresponded to the region of the mushy zone. The concentrations of C, Mn, and S in the mushy zone were higher than that in other regions, and that reached highest in the strand center 0.2 m away from the strand narrow surface, where the liquid fraction was the largest as shown in Fig. 2(d). Figure 3 showed that there was only a few mushy zone that has not solidified and remained in strand center region and no liquid phase was existed in strand at the end of solidification during CC process. Then, as the solidification went on, the higher the liquid fraction in mushy zone was, the longer the solidification time was. The solute would discharge from the region where the liquid fraction was lower and solidified earlier, and solutes would be gathered in the mushy zone with a higher liquid fraction where solidified more later. This contributed to the increase of solutes concentration in the region with a higher liquid fraction. As a result, the higher the liquid fraction was, the higher the solute concentration was. The concentrations of C, Mn, and S increased gradually from the surface to the center of the strand along the thickness direction. The changing regularity of C, Mn, and S concentration on the strand cross section were similar.
Solute distribution on the strand cross section 15 m away from meniscus. (a) C, (b) Mn, and (c) S.
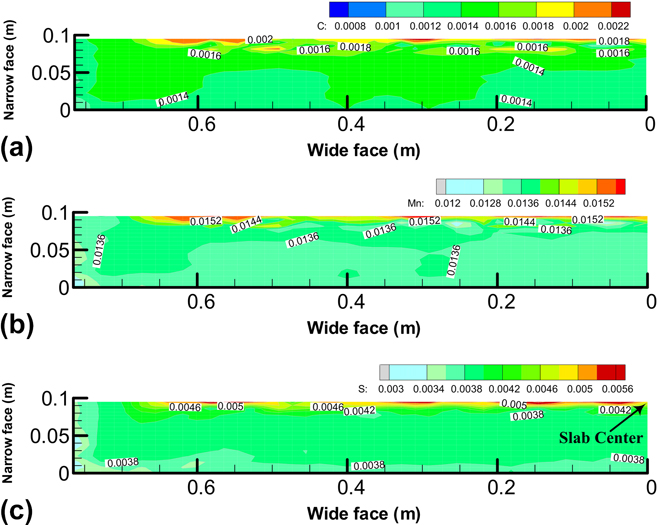
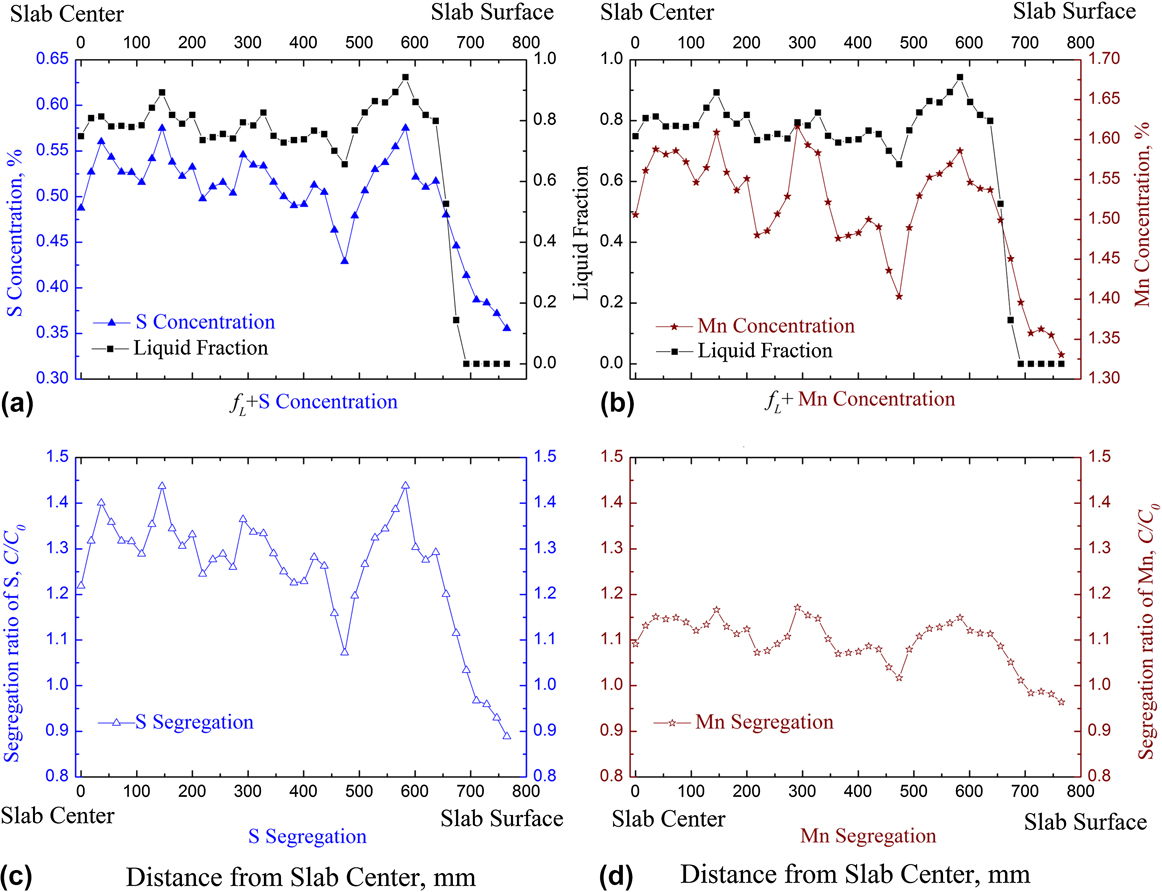
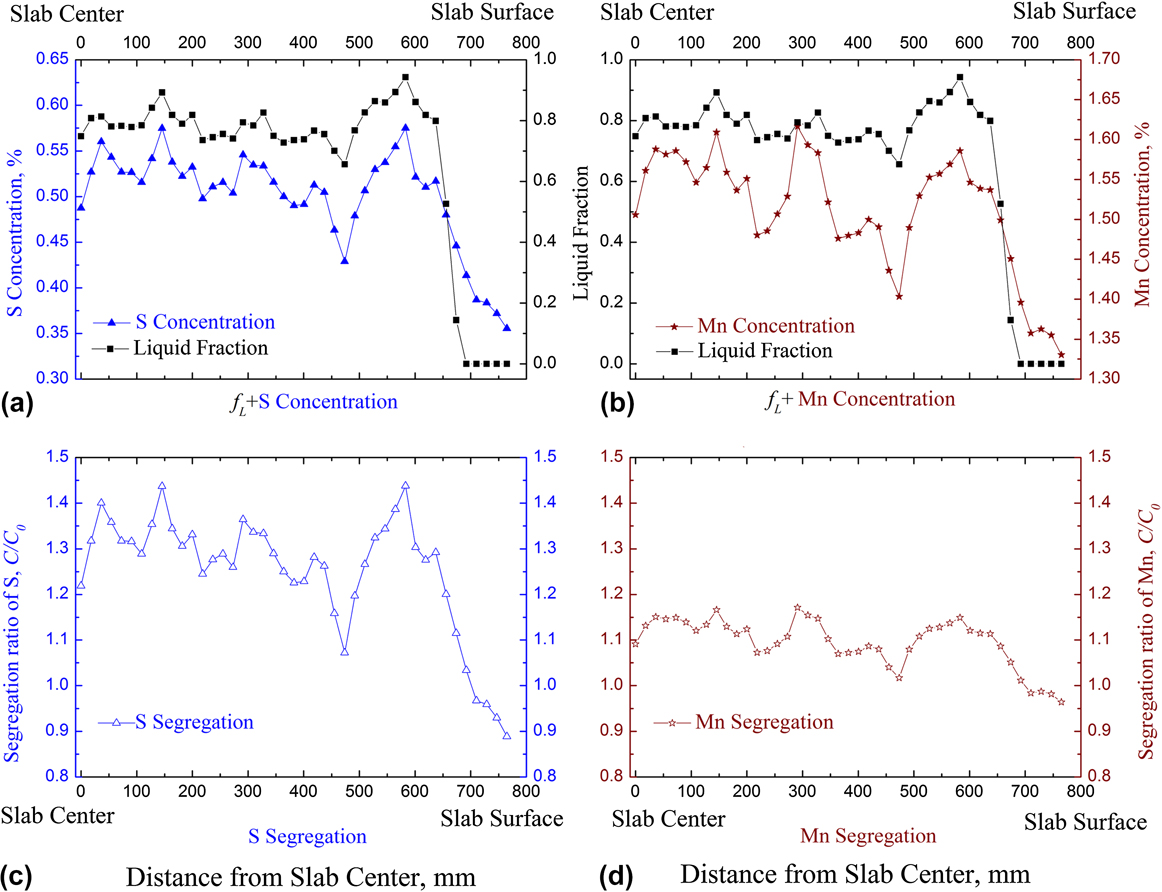
Figure 4 showed the concentration and segregation ratios (C/C 0) of solutes Mn and S on the center line along width direction on the strand cross section 15 m away from meniscus. The negative segregation formed in the initial solidified shell region which is close to the strand narrow surface. The solute segregation changed from a negative to a positive value within a width of 65 mm away from strand narrow surface. The main reason of this phenomenon should be the changing interdendritic strain brought out by the thermal condition, Reference El-Bealy and Fredriksson28,Reference El-Bealy29 and the circulation flow near the solidification front and the floatation of solute-richer molten steel at the upper part of strand Reference Sun and Zhang30 as previous studies suggested. In the region of positive segregation on the center line, the segregation ratio of solute S was mainly in the range of 1.2–1.45, which was similar to the result obtained from Zhang and Sun. Reference Sun and Zhang30,Reference Sun and Li31 The segregation ratio of solute Mn mainly ranged from 1.05 to 1.15. Furthermore, concentrations and segregation ratios of solutes in the place with a higher liquid fraction were relatively higher.
Concentration and segregation ratio of solutes Mn and S at the center line along width direction on the strand cross section 15 m away from meniscus. (a) Liquid fraction and S concentration, (b) Liquid fraction and Mn concentration, (c) S segregation ratio, (d) Mn segregation ratio.
Along the strand thickness direction, the concentrations of solutes Mn and S in the initial solidified shell region were similar to the initial concentration of the molten steel and have a certain amount of increase in the mushy zone. In addition, at the end of solidification, the higher the liquid fraction was, the higher the concentrations of solutes Mn and S were, and this phenomenon was more significant in the region where the liquid fraction was higher than 0.6. The variation trend of Mn or S concentration on the 1/2, 1/4, and 1/8 center line along the thickness direction were similar. There was a negative segregation region of solutes Mn and S in the initial solidified shell within thickness of 80 mm away from strand wide surface, and the segregation ratio of solute Mn was between 0.97 and 1.0, while solute S was around 0.95. In the positive segregation region where was in the center of the strand, the segregation ratio of solutes Mn and S was from 1.0 to 1.1 and from 1.0 to 1.4, respectively. The highest segregation ratio of solute S was 1.4.
The comparison of solute S segregation between the results of this study and that of by the previous literature was listed in Table VI. It could be found out that the results of this study were in good agreement with the literature Reference Sun and Zhang30,Reference Sun and Li31 and that validated the accuracy of the model in this study.
Comparison between the simulation results and the literature measurement results on solute S segregation at the center line.

B. MnS precipitation distribution and solute concentration change
Basing on the results of solute Mn, S distribution in the strand, which were calculated by the previous 3-D coupling numerical model, the precipitation and distribution of MnS inclusion at the solidification front during CC process has been studied through the MnS precipitation thermodynamic model. The effects of MnS precipitation on the distribution and segregation of solutes Mn and S were discussed.
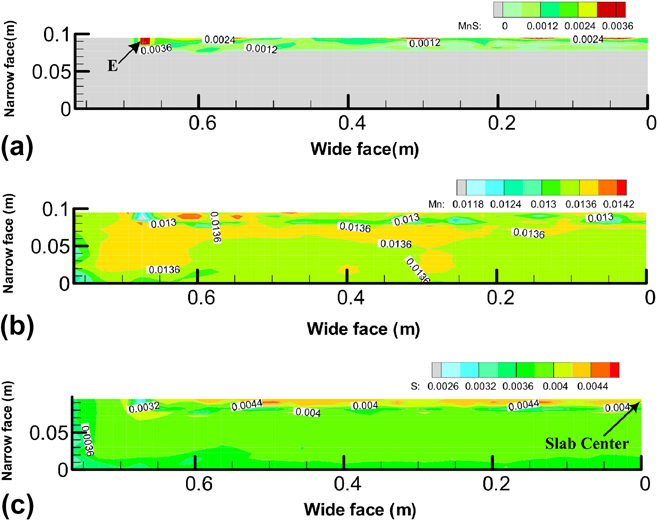
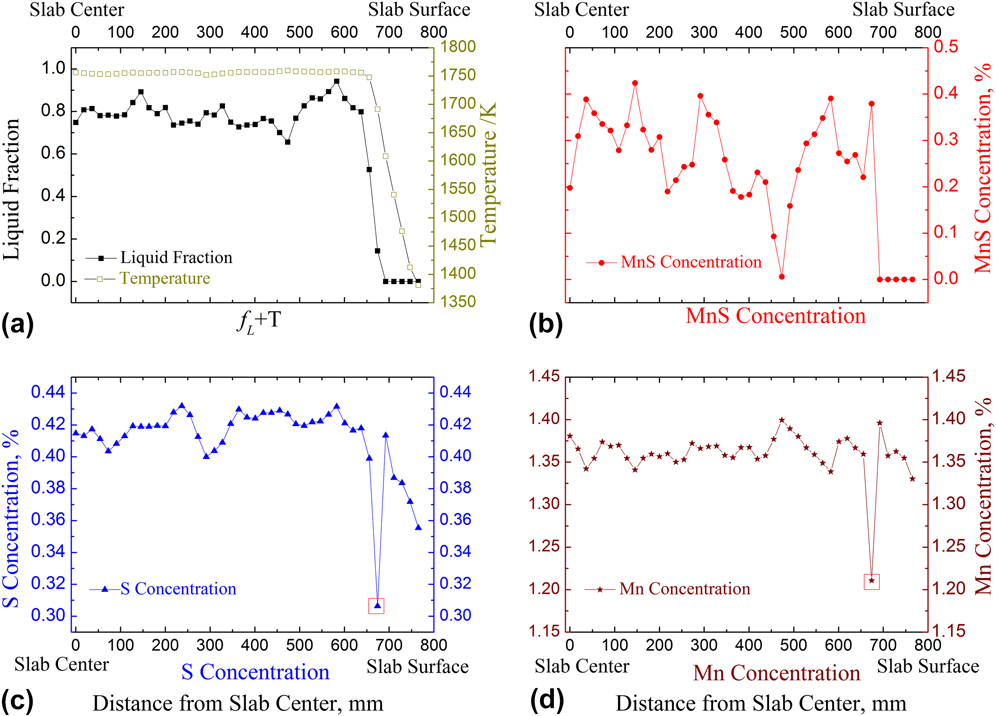
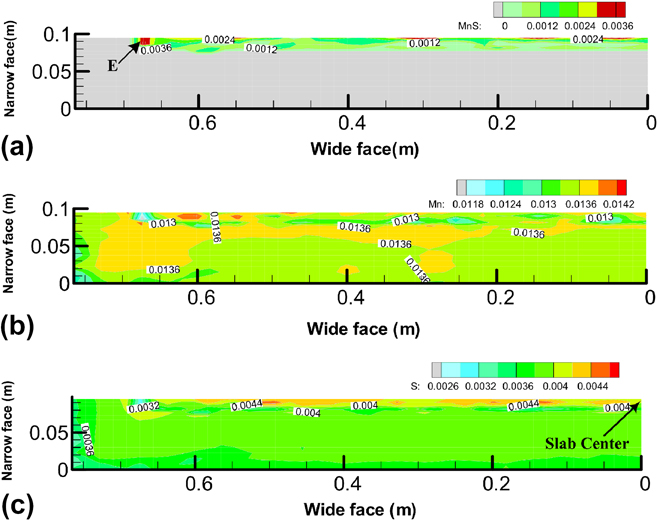
Combining Fig. 5 with Figs. 2 and 3, it could be found the precipitation of MnS was determined by the temperature distribution and concentration distribution of solutes Mn and S. In the region with a higher Mn, S concentration and lower temperature, the precipitation amount of MnS was relatively larger, making the precipitation amount of MnS reach maximum in the region which was 90 mm away from the strand narrow surface. This region was marked with “E”, as shown in Fig. 5(a). It was seen that the concentration of solutes Mn and S decreased significantly in the region with MnS precipitation. Moreover, the larger the precipitation amount of MnS was, the lager the consumption of freely dissolved concentration of solutes Mn and S was, which led to a significant decrease of freely dissolved concentrations for solute Mn and S in the region marked with “E”. The above results showed that the freely dissolved concentration of solutes Mn and S decreased because of the precipitation of MnS, and that could affect the final concentration distribution of solutes Mn and S in the strand.
MnS and solute Mn, S distribution on strand cross section 15 m away from meniscus after MnS precipitation. (a) MnS, (b) Mn, and (c) S.
According to Figs. 4 and 6, it could be found that the concentrations of Mn and S at the central line along width direction on strand cross section 15 m away from meniscus were reduced and the concentration distribution of Mn and S was more uniform due to the precipitation of MnS. The precipitation amount of MnS was different in each position because the temperature and concentration of solutes Mn and S were fluctuated at that line. Figure 6(b) stated that at the end of solidification, the average precipitation amount of MnS at the center line along width direction on strand cross section was about 0.27%.
f L, T, MnS, Mn, and S at the center line along width direction on strand cross section 15 m away from meniscus. (a) Liquid fraction and Temperature, (b) MnS concentration, (c) S concentration, (d) Mn concentration.
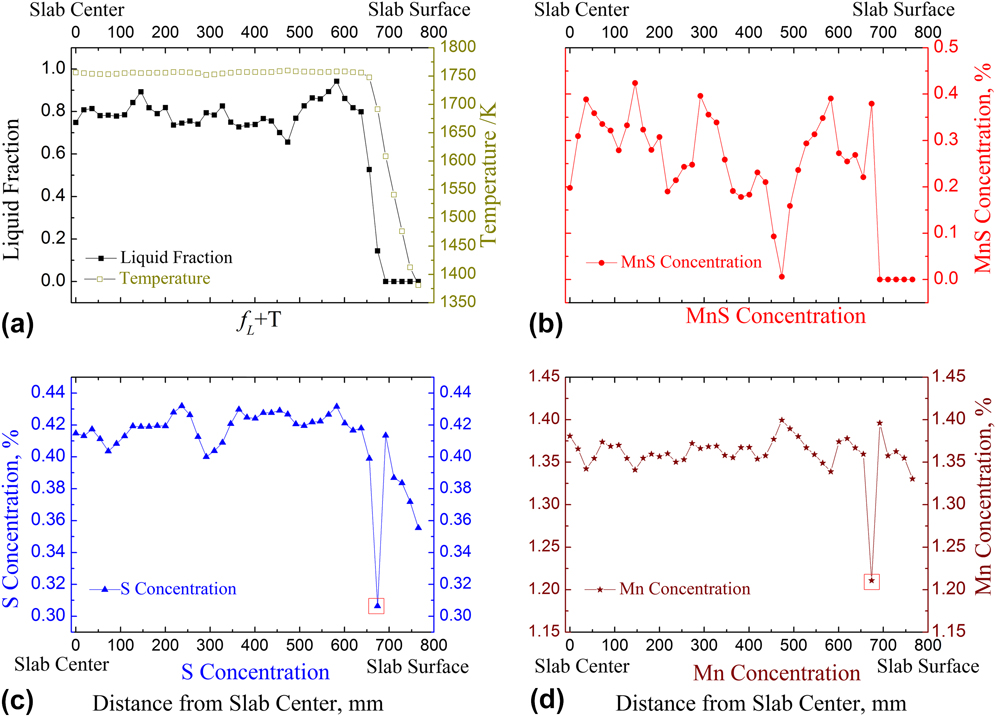
In addition, it could be observed that the concentrations of solutes S and Mn have a sudden drop in the point that was marked by a red box in Fig. 6. Through calculation and analysis, the point was in the mushy zone and near the solid interfaces which has a lower temperature, and its thermodynamic conditions for MnS precipitation was more suitable. So there was a lager amount of MnS precipitation and the consumption of solutes Mn and S free dissolved concentration were lager. As a result, the solutes Mn and S free dissolved concentration decreased greatly. But on the left side of that point, the temperature and the liquid fraction would increase, and the precipitation amount of MnS would decrease, the solutes Mn and S free dissolved concentration would decrease less and higher than that point. In this study, only the inclusion precipitation in liquid phase and mushy zone were considered. The inclusion precipitation in solid phase and its influence on solute concentration have not been calculated. So the concentrations of solutes Mn and S on the right side of that point have not changed much. Therefore, it presented that the S and Mn concentrations have a sudden drop in Fig. 6.
The above analysis shows that the effect of temperature on inclusion precipitation and solute distribution was more significant in the mushy zone with a lower liquid fraction. In the light of this study, the effect of temperature changing on the precipitation of MnS was significant when the liquid fraction was less than 0.2.
C. Influence of MnS precipitation on solute segregation
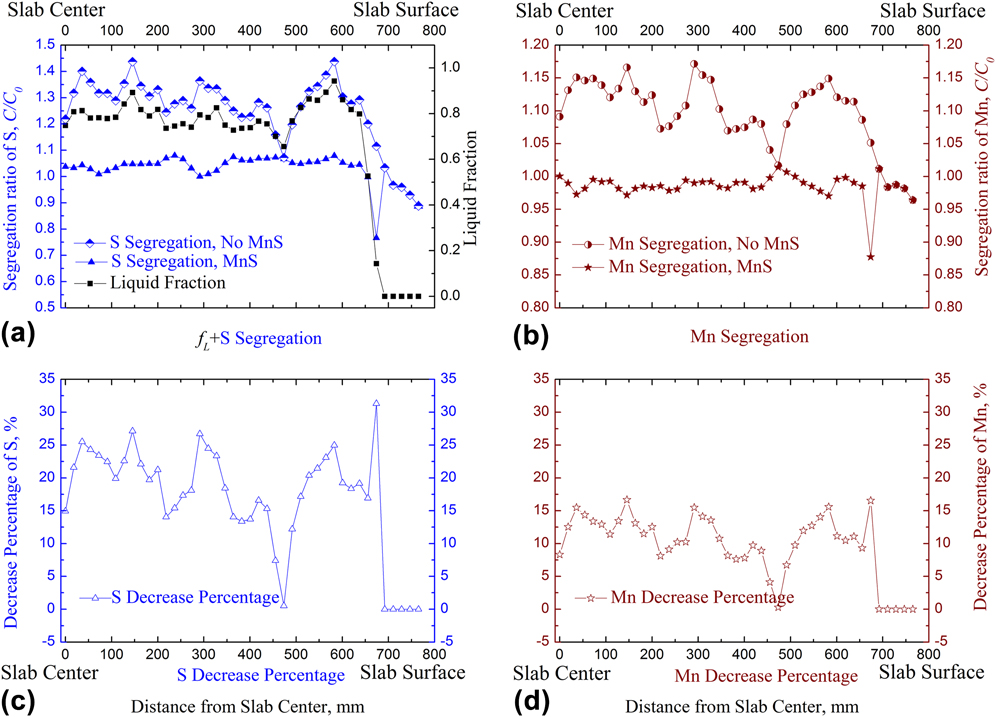
The solute enrichment promoted inclusion precipitation at the solidification front, ultimately affecting the solute segregation behavior during the CC solidification process. Figure 7 presented the change and decrease percentage of segregation ratios of solutes Mn and S at the center line along width direction on strand cross section under the condition of considering MnS precipitation or not. Figures 7(a) and 7(b) indicated that the precipitation of MnS could reduce the segregation ratios of solutes Mn and S effectively, and the change of solutes segregation ratio on the center line of strand became more uniform. Because of the precipitation of MnS, the segregation ratios of solutes Mn and S declined from 1.05–1.15 to 0.97–1.01 and from 1.2–1.45 to 1.00–1.08, respectively. Figures 7(c) and 7(d) demonstrated that the average decrease percentage of solutes Mn and S segregation ratio was 11.13% and 19.15%, respectively. The effect of MnS precipitation on the segregation of solute S was greater than that of Mn.
Variation and decrease percentage of segregation ratio of solutes Mn and S at the center line along width direction 15 m away from the meniscus under the condition of consider MnS precipitation or not. (a) Liquid fraction and S segregation ratio, (b) Mn segregation ratio, (c) Decrease percentage of S segregation ratio, (d) Decrease percentage of Mn segregation ratio.
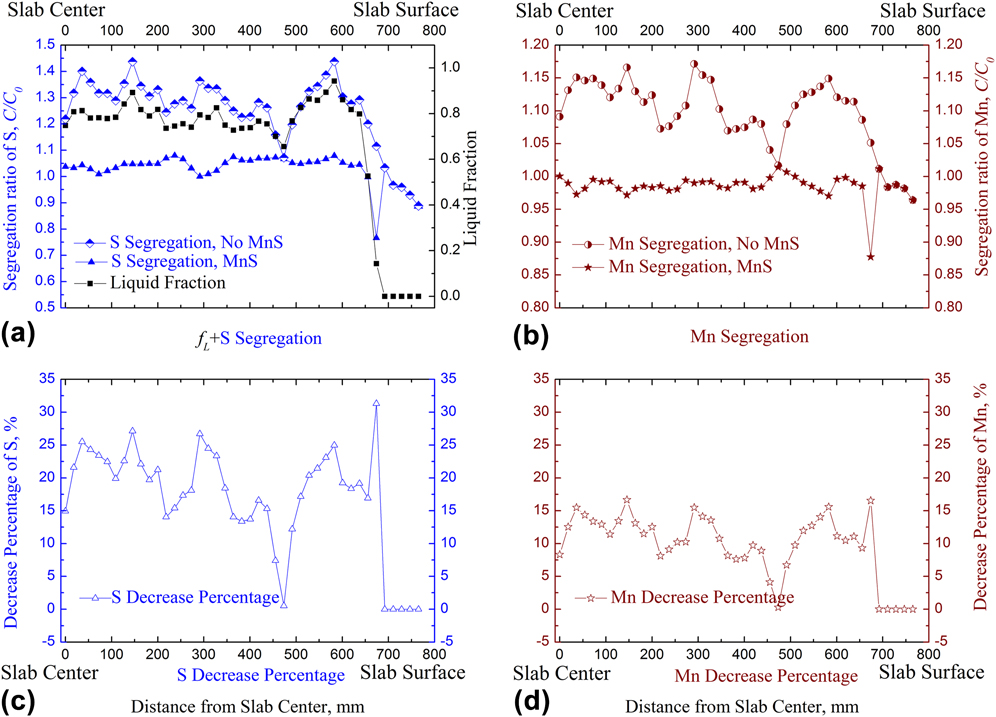
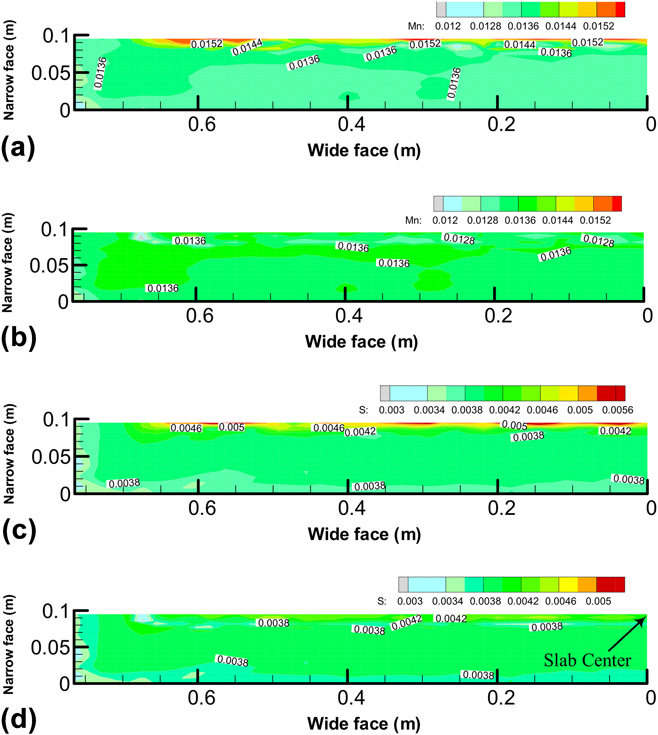
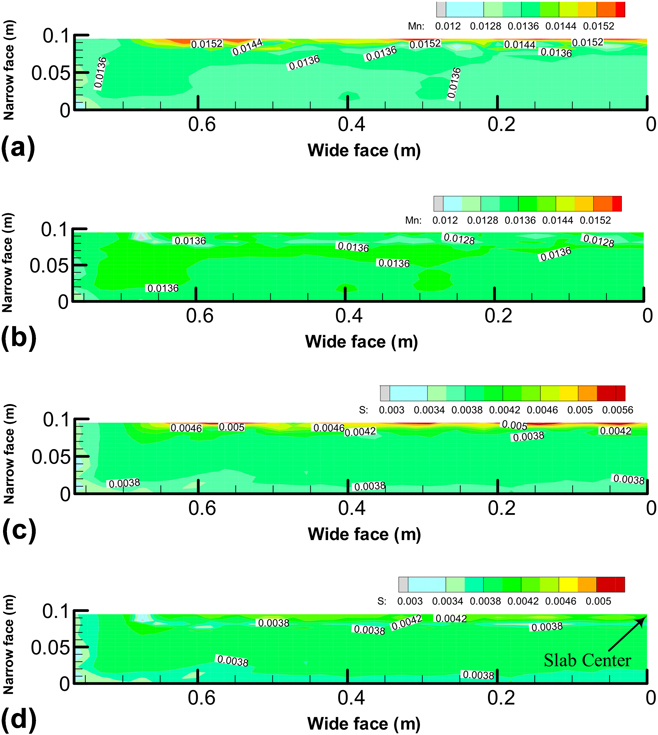
Figure 8 illustrated that with MnS precipitation, the freely dissolved concentration of solutes Mn and S decreased and distributed more uniformly in corresponding region of strand, especially in the strand center. These results indicated that the precipitation of MnS has a significant influence on the concentration distribution of solutes Mn and S at the solidification front.
Solute Mn and S on the strand cross section 15 m away from the meniscus under the condition of consider MnS precipitation or not. (a) Mn: before MnS precipitation. (b) Mn: after MnS precipitation. (c) S: before MnS precipitation. (d) S: after MnS precipitation.
This study showed that the influence of MnS precipitation on the distribution of solutes Mn and S could not be ignored. The precipitation of MnS changed the concentration distribution of solutes Mn and S in strand, and the solutes freely dissolved concentration decreased and distributed more uniformly. Therefore, the ability to accurately predict the effect of inclusion precipitation on macrosegregation is of practical consequence to the prediction and restraint of macrosegregation.
To study the effect of inclusion precipitation on solute distribution and segregation more accurate, the calculation of inclusion precipitation should be coupled with solute transport calculation in real-time, and the kinetic factors of inclusion precipitation also should be considered. These will be the next work to be done in this study.
IV. CONCLUSION
A 3-D model coupled with flow, heat and solute transport, and the thermodynamic model of MnS precipitation have been established to study the solutes enrichment and precipitation distribution of MnS in strand on a macroscale. Conclusions were as follows:
-
(1) The precipitation of MnS was influenced by the temperature and concentration of solutes Mn and S. The effect of temperature was significant when the liquid fraction was less than 0.2.
-
(2) The average precipitation amount of MnS at the center line along the width direction was 0.27. Due to the precipitation of MnS, the segregation ratios of solutes Mn and S declined from 1.05–1.15 to 0.97–1.01 and from 1.2–1.45 to 1.00–1.08, respectively. The decrease percentage of segregation ratio of solutes Mn and S was 11.13% and 19.15%, respectively.
-
(3) Because of the precipitation of MnS, the distribution of solutes Mn and S became more uniform and the solutes segregation were suppressed.
-
(4) To predict the solute segregation more accurate, the influence of inclusion precipitation could not be ignored.
ACKNOWLEDGMENT
The authors would like to thank the National Natural Science Foundation of China (NSFC) for the financial support (Project Nos. 51504048, 51374260, and 51611130062).