I. INTRODUCTION
The vast impact of semiconductor materials on modern life is predominantly due to the possibility of adapting their physical properties via the control of their electronic band structure. For semiconductor crystals such as silicon (Si) and germanium (Ge), which form the heart of modern computer and telecommunication industry, Reference Moss and Ledwith1,Reference Shklovskii and Efros2 the tuning is achieved via doping with e.g., phosphorous and boron and the application of a surface electrical field. These ingredients enable the creation of transistors, p–n diodes, and photodiodes. Likewise, p–n junctions assembled around heterostructures and quantum wells formed by alloys such as GaAs/AlGaAs or InGaAs/InP are used to fabricate lasers and light emitting diodes. The last decades have shown that the strain can likewise be used to influence important semiconductor properties such as carrier mobility and band alignment. Accordingly, applied elastic strain can lift band degeneracies and reduce carrier scattering and the effective mass, and thereby increase the carrier mobility. Reference Schetzina and McKelvey3–Reference Geiger, Zabel and Sigg6 Strain can also tune bandgap energies and, thus, improve the performance of optical devices. Reference Ahn and Chuang7,Reference Ahn and Chuang8 In electronics this has, for example, led to the incorporation of SiGe alloys as a stressor material increasing the channel mobility in field effect transistors (FETs). Reference Garone, Venkataraman and Sturm9,Reference Nanver, Jovanović, Biasotto, Moers, Grützmacher, Zhang, Hrauda, Stoffel, Pezzoli, Schmidt, Miglio, Kosina, Marzegalli, Vastola, Mussler, Stangl, Bauer, van der Cingel and Bonera10 Since deviatoric strain changes the crystal symmetry, thermal Reference Li, Maute, Dunn and Yang11 and magnetic properties of particular materials can be modified as well. Reference Huang, Yu and Wei12
So far, applications using strain commonly rely on epitaxial deposition of a layer with a lattice constant different than that of the substrate. Here, the thermodynamical limitation for large strain values depends on the exact growth conditions which in turn determine the formation of defects, Reference Braun, Briggs and Böni13,Reference Matthews and Blakeslee14 interdiffusion Reference Schorer, Friess, Eberl and Abstreiter15,Reference Tan, Brunner, Bougeard and Abstreiter16 and the growth of three-dimensional structures. Reference Brunner17 To overcome these limitations, other strain technologies are preferred which can be applied post-growth. One obvious method is to add external stressor layers such as SiN x deposited using plasma-enhanced chemical vapor deposition. Reference Ong, Wei, Tay and Iliescu18 For example, this technique has shown to induce up to 1.75% of biaxial strain into Ge. Reference El Kurdi, Prost, Ghrib, Checoury, Beaudoin, Sagnes, Picardi, Ossikovski and Boucaud19,Reference Capellini, Kozlowski, Yamamoto, Lisker, Wenger, Niu, Zaumseil, Tillack, Ghrib, de Kersauson, El Kurdi, Boucaud and Schroeder20 Unfortunately, it suffers from inhomogeneous strain profiles. Reference Morin, Maitrejean, Allibert, Augendre, Liu, Loubet, Grenouillet, Pofelski, Chen, Khakifirooz, Wacquez, Reboh, Bonnevialle, le Royer, Morand, Kanyandekwe, Chanemougamme, Mignot, Escarabajal, Lherron, Chafik, Pilorget, Caubet, Vinet, Clement, Desalvo, Doris and Kleemeier21,Reference Prost, El Kurdi, Ghrib, Sauvage, Checoury, Zerounian, Aniel, Beaudoin, Sagnes, Boeuf and Boucaud22 Alternatively, the use of micromechanical- or piezo-actuators can produce very homogeneous strain profiles but they suffer from the requirement of additional processing due to the requirement for electrical contacting. Reference Bhaskar, Pardoen, Passi and Raskin23–Reference Gravier, Coulombier, Safi, André, Boé, Raskin and Pardoen25
Conceptually different is a technique introduced first in Si by Minamisawa et al. Reference Minamisawa, Süess, Spolenak, Faist, David, Gobrecht, Bourdelle and Sigg26 and later in Ge by Süess et al., Reference Süess, Geiger, Minamisawa, Schiefler, Frigerio, Chrastina, Isella, Spolenak, Faist and Sigg27 where strain is induced by a geometrical approach using patterning and underetching of layers with a positive pre-strain ε0 > 0. The thus enforced strain redistribution may eventually lead to a strong local enhancement of the in-plane strain.
II. GEOMETRICAL STRAIN TECHNOLOGY
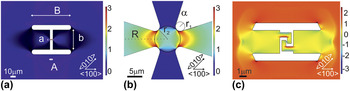
This geometrical strain technology relies on minimization of elastic energy of a stressed layer by relaxation along well-defined boundary conditions upon removal of the substrate. For the simple case of a microbridge such as shown in Fig. 1(a) with a total length B and width b, which consist of two stressor pads connected by a narrow constriction with length A and width a, we find the boundary condition that upon releasing the strained layer from the substrate the stressor pads will relax by contracting the same distance as the constriction will be stretched.
 $$\left( {1 + {\varepsilon _0}} \right) = \int_{ - B/2}^{B/2} {\left( {1 + {\varepsilon _{xx}}\left( x \right)} \right)\,{\rm{d}}x}$$
Schematic of strain enhancement structures for (a) uniaxial, (b) biaxial, and (c) compressive strain with their corresponding in-plane strain component ε xx in %.

Moreover, the stress ratio between the longitudinal stress σ xx in the pad and bridge is related to the cross section, which according to Hooke’s law Reference Davis28 holds true for the strain.
 $${{{\varepsilon _{{\rm{pad}}}}} \mathord{\left/ {\vphantom {{{\varepsilon _{{\rm{pad}}}}} {{\varepsilon _{{\rm{bridge}}}}}}} \right. \kern-\nulldelimiterspace} {{\varepsilon _{{\rm{bridge}}}}}} = {a \mathord{\left/ {\vphantom {a b}} \right. \kern-\nulldelimiterspace} b}$$
Combining these two relations and accounting for an additional underetching of length L yields the strain enhancement factor (EF) for uniaxial microbridge designs Reference Minamisawa, Süess, Spolenak, Faist, David, Gobrecht, Bourdelle and Sigg26,Reference Süess, Minamisawa, Geiger, Bourdelle, Sigg and Spolenak29 :
 $${\rm{EF}} = {{{\varepsilon _{xx}}} \over {{\varepsilon _0}}} = {{2L + B} \over B}{{\left( {{A \over {B - A}} + 1} \right)} \mathord{\left/ {\vphantom {{\left( {{A \over {B - A}} + 1} \right)} {\left( {{A \over {B - A}} + {a \over b}} \right)}}} \right. \kern-\nulldelimiterspace} {\left( {{A \over {B - A}} + {a \over b}} \right)}}$$
Equation (3) shows that the EF only depends on the pre-strain ε0, and the geometrical dimensions of the pattern which can be in the nanoscale, microscale or macroscale, hence, allowing for applicability both in electronics and optics which demand different dimensions. Furthermore, as the geometric pattern can be designed for an EF larger than e.g., 20–30, very high strain magnitudes can be obtained even with a small pre-strain. In fact the only limitation of the method is the yield strength of the respective material. Reference Süess, Geiger, Minamisawa, Schiefler, Frigerio, Chrastina, Isella, Spolenak, Faist and Sigg27,Reference Gassenq, Tardif, Guilloy, Dias, Pauc, Duchemin, Rouchon, Hartmann, Widiez, Escalante, Niquet, Geiger, Zabel, Sigg, Faist, Chelnokov, Rieutord, Reboud and Calvo30,Reference Sukhdeo, Nam, Kang, Brongersma and Saraswat31
Moreover, geometrically induced stress can not only be uniaxial, as in the case of the linear microbridges, but also biaxial [Fig. 1(b)], where shear and even compressive [Fig. 1(c)] strain/stress enhancements are possible. All this depends on the geometrical design. In particular, biaxial strain enhancement designs, consisting of symmetric stressor pads magnifying the stress in a central symmetric constriction, have been devised either in a Maltese cross design as shown in Fig. 1(b) or in various similar patterns by several other groups. Reference Sukhdeo, Nam, Kang and Brongersma32,Reference Gassenq, Guilloy, Dias, Pauc, Rouchon, Hartmann, Widiez, Tardif, Rieutord, Escalante, Duchemin, Niquet, Geiger, Zabel, Sigg, Faist, Chelnokov, Reboud and Calvo33
III. FABRICATION
A. Sample requirements
The aforementioned strain enhancement mechanism relies on two prerequisites—the presence of a pre-strain ε0 and an underlying sacrificial layer or selectively removable substrate to release part of the pre-strained structure from its substrate. It is interesting to note from Eq. (3) that pre-strain values of both sign, tensile and compressive, can be enhanced; however, upon magnifying a compressive strain severe buckling or bending can occur reducing the suitability. Hence, in the following, we restrict ourselves to the discussion of tensile strain enhancement.
A wide variety of material combinations provide a tensile pre-strain, such as InGaAs on GaAs substrate or InGaP/InP. The pre-strain is epitaxially induced due to the mismatch in lattice constant. Reference Stringfellow34,Reference Jain, Willander and Maes35 Also Si grown lattice matched on a SiGe virtual substrate is a good candidate for this technology. Reference Sailer, Wild, Lang, Siddiki and Bougeard36,Reference Wild, Kierig, Sailer, Ager, Haller, Abstreiter, Ludwig and Bougeard37 Ideally, the strained Si layer is transferred to SiO2 on a Si substrate, enabling the removal of defective interfaces which after the bonding are at the surface. Reference Takagi, Mizuno, Tezuka, Sugiyama, Numata, Usada, Moriyama, Nakaharai, Koga, Tanabe and Maeda38 Such strained Si on insulator (sSOI) can be processed with standard SOI process technologies as used for example in the fabrication of microelectromechanical systems. Reference Milanovic39 Moreover, any layer–substrate combination is conceivable when the transfer and/or bonding process induces some pre-strain. For example, bonding on a bent substrate returns, after the release of the bent substrate, a strained layer. Reference Turner40 This approach could be combined with the scotching transfer technique for two-dimensional materials such as graphene, Reference Geim41 potentially opening a large field of research in highly strained two-dimensional layers. Another method for creating a tensile pre-strain refers to fabrication-induced strain which occurs when cooling down a multilayer system with dissimilar thermal expansion coefficients such as Ge on Si. For this purpose, Ge is deposited at elevated temperatures >700 K at a thickness which allows for complete relaxation of the compressive strain. Upon cooling to room temperature, the difference in thermal expansion coefficient of Ge with respect to Si induces a small tensile pre-strain in the Ge layer which can be conserved during a subsequent bonding and annealing process to form high optical quality germanium on insulator (GeOI). Reference Gassenq, Guilloy, Dias, Pauc, Rouchon, Hartmann, Widiez, Tardif, Rieutord, Escalante, Duchemin, Niquet, Geiger, Zabel, Sigg, Faist, Chelnokov, Reboud and Calvo33 Using this technique a pre-strain is achieved in the order of 0.2–0.25%. In the following, we will restrict ourselves to the use of GeOI as a sample material system with a pre-strain at room temperature of only 0.16%.
B. Strained GeOI microbridges
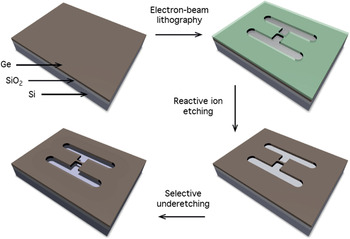
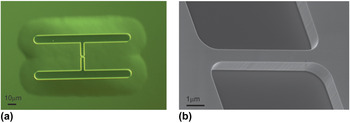
As an example, we show in Fig. 2 the fabrication process of uniaxially stressed GeOI microbridges as investigated by R. Geiger. Reference Geiger42 The base material is a biaxially tensile strained layer of Ge on top of sacrificial SiO2. Electron beam lithography is used to define the desired strain redistribution geometry into polymethylmethacrylat resist. The pattern consists of two stressor pads connected by a constriction which will provide the strained region of interest [see Fig. 1(a)]. Using anisotropic reactive ion etching based on SF6/C4F8/O2, the pattern is transferred into the Ge device layer. Finally, the strain within the stressor pads is released by removal of the underlying SiO2 layer using hydrofluoric acid either in liquid or gaseous phase. While the stressor pads relax, a tensile force is induced on the constriction increasing the strain along the crystallographic direction of the microbridge. In Fig. 3(a), we display a differential interference contrast microscopy image of a GeOI microbridge structure uniaxially stressed along 〈100〉. The phase contrast mode allows visualizing the structure, as well as the surrounding underetched region inferring a complete and isotropic underetching and, hence, complete relaxation of the stressor pads which is essential for an optimal strain enhancement. In Fig. 3(b) a scanning electron microscopy image of a GeOI microbridge after dry etching is shown. As will be shown in Sec. V, the high quality of the vertical sidewalls is essential for achieving high strain enhancement. Note that the fabrication scheme is neither restricted to a particular material system such as GeOI nor restricted to uniaxial tensile strain geometries as has already been shown for biaxial strain Reference Sukhdeo, Nam, Kang and Brongersma32,Reference Gassenq, Guilloy, Dias, Pauc, Rouchon, Hartmann, Widiez, Tardif, Rieutord, Escalante, Duchemin, Niquet, Geiger, Zabel, Sigg, Faist, Chelnokov, Reboud and Calvo33 or using sSOI material. Reference Minamisawa, Süess, Spolenak, Faist, David, Gobrecht, Bourdelle and Sigg26,Reference Süess, Minamisawa, Geiger, Bourdelle, Sigg and Spolenak29
Fabrication steps for suspended GeOI microbridges. The tensile pre-strained layer is patterned with stressor pads and a connecting constriction using lithography and reactive ion etching. Then the strained layer is released from the substrate using underetching with hydrofluoric acid.

(a) Differential interference contrast microscopy image of a suspended GeOI microbridge strained along 〈100〉 and (b) tilted scanning electron microscopy image of the microbridge area.

IV. CHARACTERIZATION OF HIGH STRAIN
Common methods to assess strain in crystalline materials include X-ray diffraction (XRD) and Raman spectroscopy. The latter relies on the conversion of the Raman shift based on phonon deformation potential parameters. Reference Minamisawa, Süess, Spolenak, Faist, David, Gobrecht, Bourdelle and Sigg26,Reference Süess, Minamisawa, Geiger, Bourdelle, Sigg and Spolenak29 Thoughtful considerations are required in particular for samples with inhomogeneous strain or nonzero shear components. In addition, means to address laser-induced sample heating are necessary. Reference Süess, Minamisawa, Geiger, Bourdelle, Sigg and Spolenak29,Reference Süess43 Yet, Raman spectroscopy is routinely applied as this comparably simple and fast method allows an immediate mapping of the strain state with spatial resolution at the submicron range. Reference Minamisawa, Süess, Spolenak, Faist, David, Gobrecht, Bourdelle and Sigg26,Reference Süess, Minamisawa, Geiger, Bourdelle, Sigg and Spolenak29 In contrast, XRD offers a model-free access to the strain state because diffraction patterns are a direct measure of the displacement of the crystal lattice. This has been demonstrated using scanning XRD with a monochromatic submicron-sized beam, for microbridges with strain values of the order of ε xx ≈ 1.5%. Reference Etzelstorfer, Süess, Schiefler, Jacques, Carbone, Chrastina, Isella, Spolenak, Stangl, Sigg and Diaz44 Alternatively, using a “white” beam, X-ray Laue microdiffraction (µ-Laue) enables to characterize the full strain tensor on micrometer-sized structures as shown by Robach et al. Reference Robach, Micha, Ulrich, Geaymond, Sicardy, Härtwig and Rieutord45 at the BM32 beamline of ESRF. Recently, this method was successfully used on GeOI microbridges. Reference Gassenq, Tardif, Guilloy, Dias, Pauc, Duchemin, Rouchon, Hartmann, Widiez, Escalante, Niquet, Geiger, Zabel, Sigg, Faist, Chelnokov, Rieutord, Reboud and Calvo30,Reference Tardif, Gassenq, Guilloy, Pauc, Dias, Hartmann, Widiez, Zabel, Marin, Sigg, Faist, Chelnokov, Reboud, Calvo, Micha, Robach and Rieutord46 It was shown that by employing a rainbow filtering technique and/or by assuming zero vertical stress the full strain state of the microbridges can be obtained. Reference Gassenq, Tardif, Guilloy, Dias, Pauc, Duchemin, Rouchon, Hartmann, Widiez, Escalante, Niquet, Geiger, Zabel, Sigg, Faist, Chelnokov, Rieutord, Reboud and Calvo30,Reference Tardif, Gassenq, Guilloy, Pauc, Dias, Hartmann, Widiez, Zabel, Marin, Sigg, Faist, Chelnokov, Reboud, Calvo, Micha, Robach and Rieutord46 The combination of µ-Laue with Raman spectroscopy revealed that the strain Raman shift conversion deviates considerably from a linear correlation for high strain. Up to quadratic terms the, thus, established dependence of the Raman shift on strain for uniaxial stress along 〈100〉 in Ge is given in Ref. Reference Gassenq, Tardif, Guilloy, Dias, Pauc, Duchemin, Rouchon, Hartmann, Widiez, Escalante, Niquet, Geiger, Zabel, Sigg, Faist, Chelnokov, Rieutord, Reboud and Calvo30 as
 $${\varepsilon _{xx}} = - 0.019\Delta {\omega ^2} + 0.68\Delta \omega \quad .$$
This dependence has been used throughout this review.
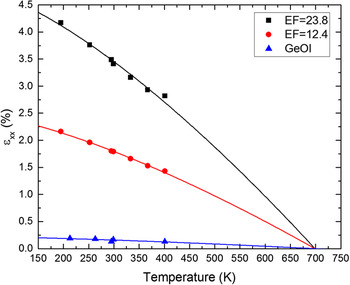
In Fig. 4, we present the longitudinal strain ε xx along 〈100〉 obtained from such µ-Laue measurements as a function of temperature. Three samples have been investigated; one unprocessed GeOI layer (blue triangles) and two uniaxially tensile stressed microbridges with EFs of 12.4 (red circles) or 23.8 (black squares), respectively. The solid lines represent the temperature-dependent strain calculated using the temperature-dependent thermal expansion coefficients of Si and Ge Reference Okada and Tokumaru47–Reference Singh49 :
 $${\varepsilon _{xx}} = EF \cdot {\varepsilon _0} = EF \cdot \int_{{T_1}}^{{T_{{\rm{max}}}}} {{\alpha _{{\rm{Ge}}}}\left( T \right) - {\alpha _{{\rm{Si}}}}\left( T \right)\,{\rm{d}}T} \quad .$$
Longitudinal strain in 〈100〉 direction of an unprocessed GeOI layer (blue triangles) and two GeOI microbridges with EFs of 12.4 (red circles) and 23.8 (black squares) measured by μ-Laue diffraction as a function of temperature.

The strain continuously increases with decreasing temperature reflecting the thermal nature of the biaxial pre-strain ε0 which is magnified by the EF. The calculated strain perfectly agrees with the experimental values with a crossing at approximately 700 K which corresponds to the growth/annealing temperature of the GeOI substrate fabrication process. This verifies the interplay between pre-strain and geometrically defined EF for reaching the resulting strain magnitude. Interestingly, this temperature-dependent strain-tuning process can be exploited for additional strain enhancement after fabrication. Indeed, an increase in longitudinal strain along 〈100〉 from 3.6% at room temperature to 5.4% at 20 K has been observed in temperature-dependent photoluminescence experiments using the same GeOI microbridges. Reference Geiger42,Reference Geiger, Zabel, Marin, Gassenq, Hartmann, Widiez, Escalante, Guilloy, Pauc, Rouchon, Dias, Tardif, Rieutord, Duchemin, Niquet, Reboud, Calvo, Chelnokov, Faist and Sigg50
V. ROBUSTNESS AND REPRODUCIBILITY
A. Microbridge yield
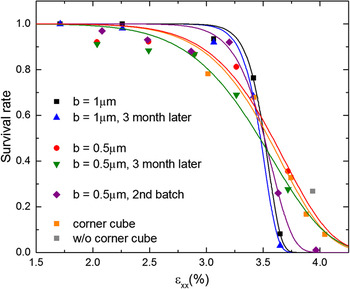
Strain values of the order of 4–5% are still considerably below the ultimate yield strength of Ge which is expected at approximately 15 GPa corresponding to 14.6% of longitudinal strain along 〈100〉. Reference Ruoff51,Reference Ngo, Almécija, Sader, Daly, Petkov, Holmes, Erts and Boland52 According to fracture mechanics, such a reduction of the yield strength can be expected in the presence of defects and cracks Reference Griffith53 both potentially originating in heteroepitaxy and subsequent fabrication processes. Figure 5 presents a statistical yield analysis as a function of the longitudinal strain ε xx for GeOI bridges with width b = 1 μm (black squares) and 0.5 μm (red circles) evaluated directly after and 3 months after the fabrication, see blue and green triangles, respectively. During these three months, the samples have been exposed to several cryogenic cooling and heating steps between 20 and 300 K and some were exposed to laser radiation at intensities up to ≈20 kW/cm2. Nevertheless, we find no systematic degradation of the survival rate with time at the presented strain magnitudes. Most failures could be attributed to excess heating by laser irradiation. Moreover, the similarity of the histogram of the survival rates from a second fabrication run (purple diamonds) suggests a good reproducibility of the process.
Survival statistic of GeOI bridges with 1 um (black) and 500 nm (red) width after fabrication and after three months (blue and green), as well as of a 2nd batch (purple) and of a sample with etched parabolic corner cube mirrors (orange). The solid lines represent a Weibul statistical fit.

For strain values below 2.7%, we obtain a yield larger than 90% which drastically drops above 3.5% strain. Moreover, bridges with smaller cross section in Fig. 5 exhibit a flatter survival behavior with a higher probability of survival at higher strain but a slightly higher probability for failure at lower strain values. This is most likely due to the reduced surface-to-volume ratio which makes the bridges more susceptible to surface defects.
It is also interesting to note that there is no significant reduction of the survival rate upon additional patterning of the stressor pads, see in Fig. 5 samples with (orange squares) and without (gray square) additional patterning of the stressor pads. In this case, the patterning was to induce so-called corner cube cavities, as shown below in Sec. V. C.
B. Fracture
The survival behavior in Fig. 5 can be modeled with a Weibull probability function based on the assumption that fracture occurs at the weakest link governed by a defect Reference Weibull54,Reference Weibull55 :
 $${P_{\rm{f}}} = \exp \left( { - {{\left( {{\sigma \over {{\sigma _{\rm{A}}}}}} \right)}^m}} \right)\quad .$$
Here, σA is defined as the characteristic strength at which 63% failure occurs and m is the Weibull modulus which describes the shape of the failure probability curve. Reference Afferrante, Ciavarella and Valenza56
Extracted from this, the critical stress (strain) is of the order of 3.6 GPa (ε xx = 3.5%) and 3.7 GPa (ε xx = 3.6%) for microbridges with a width of 1 µm and 500 nm, respectively. For m, we obtain values of 33 and 10, respectively. We now employ the Griffith theorem,
 $${\sigma _{\rm{A}}} = \sqrt {{{2E\gamma } \over {\pi {l_{\rm{c}}}}}} \quad ,$$
which is based on the minimization of the system energy. This energy increases while forming new surfaces as a crack propagates, but decreases on releasing the elastic energy. Reference Griffith53 This relation correlates the critical fracture strength σA to a critical defect length l c which is found to be between 8.6 and 9.5 nm using a Young modulus of 102.7 GPa, Reference Wortman and Evans57 and a free surface energy per unit area γ of 1.835 J/m2 for the (100) surface of Ge. Reference Jaccodine58
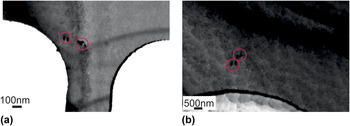
To investigate the limiting defect type with such a critical length, we performed transmission electron microscopy (TEM). In Fig. 6 we show bright field images taken in (220) Bragg condition of two microbridges which have been processed simultaneously and designed for strain values ε xx > 3.5%. One broke during the underetching process in the center (a) and the other did not (b). Both bridges were cut with a focused ion beam from the stressor pad. We observed 8 ± 1 misfit dislocations on this broken bridge (a) and 2 ± 1 on this unbroken bridge (b) corresponding to misfit dislocation densities of approximately 1 × 108 cm−2 and 3 × 107 cm−2, respectively. Regardless of the fact that only two bridges have been investigated, and nonetheless the observed different dislocation densities, the following arguments suggests that the critical defects are not these dislocations. Firstly, for the broken bridge (a) we find three misfit dislocations close to the filet which connects the bridge with the stressor pad. This is the region with the highest von Mises stress which is a criterion for the occurrence of plastic deformation. For brittle materials, such as germanium, the regime for plastic deformation is very small and, thus, fatigue is expected as soon as nonreversible deformation starts. However, the microbridge did not break at this position but close to the center. The same holds true for the unbroken bridge, where we find two dislocations at almost the same position without experiencing any failure. Secondly, we observe a distinct surface and side wall roughness induced during the dry-etching process. The size of the roughness, as estimated from the TEM analysis, is of the order of approximately 10 nm which accurately coincides with the critical defect length calculated using the Griffith theorem. Moreover, a lower yield strength than shown in Fig. 5 is found for microbridges fabricated with an unoptimized dry-etching which delivered a larger side wall roughness. Hence, the critical defect is more likely related to the surface and side wall roughness.
(220) bright field TEM images of GeOI microbridges at the filet connecting stressor pad and bridge; (a) bridge broken at the center and (b) bridge without fracture. Both images exhibit the presence of 2–3 misfit dislocations highlighted by the red circles. The long dark lines in (a) and (b) stem from slight changes in the Bragg condition due to bending of the mounted bridges. The contrast modulation in (b) stems from residual SiO2 below the microbridge.

A second fabrication-induced failure mechanism has been identified in an inhomogeneous underetching process as a few broken microbridges show severe shear movement after the underetching. Thus, we conclude that the yield strength of the investigated GeOI layers is not yet reached. After further process optimization, even higher strain values than shown in Fig. 5 should be possible. The current record values of 4.9% for similarly sized structures are presented by CEA in Ref. Reference Gassenq, Tardif, Guilloy, Dias, Pauc, Duchemin, Rouchon, Hartmann, Widiez, Escalante, Niquet, Geiger, Zabel, Sigg, Faist, Chelnokov, Rieutord, Reboud and Calvo30. The Stanford group realized strains up to 4.5%, based on their Raman shift of 8.68 cm−1 converted by Eq. (4). Reference Sukhdeo, Nam, Kang, Brongersma and Saraswat31
C. Patterning
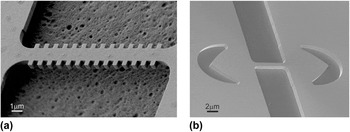
Important for the applicability in devices is the ability to pattern the structures while conserving the strain. An example is shown in Fig. 7(a) where we show a scanning electron microscopy image of a GeOI microbridge with a periodic array of lateral corrugations defining a distributed feedback cavity (DFB). The achieved strain values were up to 3.5% at room temperature, very similar to those of the unpatterned reference structure.
Scanning electron microscopy image of a (a) lateral-defined DFB and (b) a corner cube cavity etched into the stressor pads.

An alternative cavity design based on two micrometer-sized parabolic mirrors etched into the stressor pads is shown in Fig. 7(b). For a discussion of the pro and contra for the two approaches see Ref. Reference Bonzon59. These corner cube mirrors can be etched during the same fabrication step as the strain pattern. The resulting decrease by 10% in final strain can be compensated by increasing the size of the stressor pads and we, thus, obtained again more than 4% of strain (see Fig. 5 orange and gray data). Petykiewicz et al. etched a 10-period distributed Bragg reflector into the pads and realized strains up to 2.37%. Reference Petykiewicz, Nam, Sukhdeo, Gupta, Buckley, Piggot, Vuckovic and Saraswat60
D. Biaxially strained structures
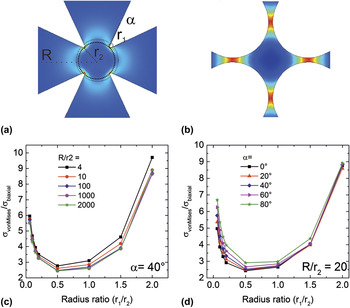
In the following, we will discuss how to design a biaxially strained structure with a conceivably maximal strain. Herein, we follow the approach as discussed in M. Süess’ thesis. Reference Geim41 As input we take from Fig. 5 the highest strain (stress) ε xx = 4% (4.1 GPa) so far achieved with the above introduced fabrication process and material. From finite element method (FEM) calculations, we deduce that the microbridge with 4.1 GPa of stress in the center will have a maximum von Mises stress of σMises = 4.5 GPa at the fillet connecting bridge and stressor pads. Using σMises as a figure of merit, we can derive the maximum possible strain of, e.g., biaxially strained Maltese cross designs with pad length R, center radius of r 2, opening angle α, and fillet radius of r 1 (see Fig. 8).
Schematic FEM simulation of a biaxial strain enhancement structure with r 1/r 2 → 0 (a) and r 1/r 2 → 2.5 (b). FEM simulation of the stability factor σMises/σbi as a function of r 1/r 2 for varying (c) R/r 2 or (d) α.

Figure 8 assesses the von Mises stress as a function of the radius ratio (r 1/r 2) based on FEM calculations. With increasing radius ratio, the pads become thinner concentrating the strain in the pads without a benefit for the total biaxial strain [see Fig. 8(b)]. With decreasing radius ratio, the stress is concentrated at the tip of the fillet strongly increasing the von Mises stress [see Fig. 8(a)]. The optimum we find at a radius ratio between 0.5 and 1 where the von Mises stress is approximately 2.4 times larger than the biaxial stress in the structure for α < 20° and R/r 2 > 100. A yield stress of σMises = 4.5 GPa based on a prestrain of 0.16% (σ0 = 164 MPa) corresponds to a maximum possible strain enhancement of σMises/σ0 = 28.1 in the structure. Taking into consideration that σMises is 2.4 times the average stress, we only obtain a maximum stress EF of approximately 11.7 which would correspond to a biaxial strain of 1.88%. The CEA group demonstrated 1.9% Reference Gassenq, Guilloy, Dias, Pauc, Rouchon, Hartmann, Widiez, Tardif, Rieutord, Escalante, Duchemin, Niquet, Geiger, Zabel, Sigg, Faist, Chelnokov, Reboud and Calvo33 which is in fair agreement with the estimation above considering the generally higher strain values they achieve and their chosen geometrical parameters of α = 22.6° and R/r 2 = 66.5.
VI. INVESTIGATION PLATFORM AND APPLICATIONS
We have seen that the microbridge strain technology enables one to induce high strain on any convenient platform in a reproducible and simple manner. Moreover, it is applicable to many different material systems and, due to the geometrical design, it is scalable from macro-to nanometer-scale, thus, offering investigative research of numerous kinds.
A. X-ray investigation platform
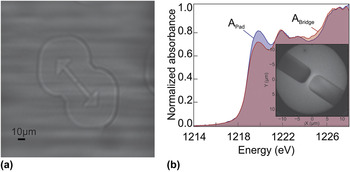
The high uniformity of the strain within the stressed layer as well as the predictability is attractive for various experiments regarding XRD. This is the reason why these structures have been used as test specimens of well-characterized strain for the development of novel strain microscopy techniques Reference Gassenq, Tardif, Guilloy, Dias, Pauc, Duchemin, Rouchon, Hartmann, Widiez, Escalante, Niquet, Geiger, Zabel, Sigg, Faist, Chelnokov, Rieutord, Reboud and Calvo30,Reference Etzelstorfer, Süess, Schiefler, Jacques, Carbone, Chrastina, Isella, Spolenak, Stangl, Sigg and Diaz44,Reference Tardif, Gassenq, Guilloy, Pauc, Dias, Hartmann, Widiez, Zabel, Marin, Sigg, Faist, Chelnokov, Reboud, Calvo, Micha, Robach and Rieutord46 performed in reflection under Bragg condition. Reference Gassenq, Tardif, Guilloy, Dias, Pauc, Duchemin, Rouchon, Hartmann, Widiez, Escalante, Niquet, Geiger, Zabel, Sigg, Faist, Chelnokov, Rieutord, Reboud and Calvo30,Reference Tardif, Gassenq, Guilloy, Pauc, Dias, Hartmann, Widiez, Zabel, Marin, Sigg, Faist, Chelnokov, Reboud, Calvo, Micha, Robach and Rieutord46 However, these structures also enable forward imaging in transmission as the substrate can be thinned from the backside while leaving the patterned structure intact. Such an experiment is show in Fig. 9(a), where we present an X-ray transmission image taken through a 700 nm thick Ge membrane on top of 300 nm Si under illumination with a 6.2 keV beam. Such a geometry could allow for strain characterization of thin crystals by applying tele-ptychography, Reference Tsai, Diaz, Menzel and Guizar61 a technique which consists of reconstructing the complex-valued wave front after transmission through the object, while keeping the crystal in Bragg condition. This novel approach is currently under development at the cSAXS beamline at the Swiss Light Source (SLS).
(a) X-ray transmission image of a suspended Ge microbridge. The contrast in this image is produced by edge enhancement. Reference Cloetens, Barrett, Baruchel, Guigay and Schlenker63 The outer circular lines indicate the underetched region. (b) X-ray absorption spectra on the pad (blue) and the bridge (red) and a PEEM image of the bridge recorded at 1214 eV.

We also investigated the effect of strain on the X-ray absorption edge of Ge via photoelectron emission imaging (PEEM) at the surfaces/interfaces: microscopy (SIM) beamline of the SLS. X-ray absorption spectra of a strained bridge and a pad are shown in Fig. 9(b) with the corresponding PEEM image given in the inset. Unfortunately, the inherent broadening of the absorption edge of the investigated Ge 2p 3/2 edge did not allow to resolve the shift and splitting of the conduction band such as has been shown for Si. Reference Euaruksakul, Li, Zheng, Himpsel, Ritz, Tanto, Savage, Liu and Lagally62 However, a distinct contrast between strained and unstrained region near the edge is observed which, from the comparison to ab-initio calculations, is attributed to a strain-induced change in the density of states.
B. 4-Point bending
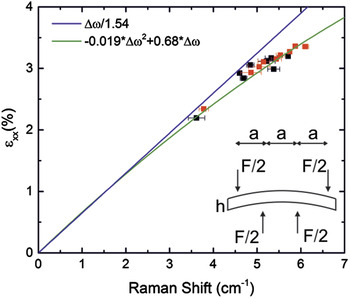
A way to give the top-down approach an in situ tunability is to clamp a fully processed sample into a 4-point bending apparatus. In Fig. 10, we show the Raman shift for two bridges with varying deflection upon bending. The deflection is correlated to the strain via
 $${\varepsilon _{xx}} = {\rm{EF}} \cdot \left( {{\varepsilon _{{\rm{pre}}}} + {{6\delta h} \over {23{a^2}}}} \right)\quad ,$$
with h, a, and δ being the sample thickness, the distance between the bending points, and the deflection, respectively. Two samples with an EF of approximately EF = 15 are shown together with the linear Reference Süess, Minamisawa, Geiger, Bourdelle, Sigg and Spolenak29 and quadratic Reference Gassenq, Tardif, Guilloy, Dias, Pauc, Duchemin, Rouchon, Hartmann, Widiez, Escalante, Niquet, Geiger, Zabel, Sigg, Faist, Chelnokov, Rieutord, Reboud and Calvo30 strain Raman shift correlation, respectively. Independently from the µ-Laue diffraction, we find a very good agreement between the measurement and the quadratic dependence of Eq. (4), which describes an accelerated softening of the Raman modes at strain values larger than 2–3%.
Induced strain from 4-point bending of GeOI microbridges as a function of the measured Raman Shift. The inset shows a schematic of the used 4-point bending system.

In addition, as shown in Eq. (8), substrate bending induces strain which completely relaxes the requirement for a pre-strain εpre. Thus, any material can be investigated with this technique e.g., lattice matched AlGaAs/GaAs or graphene.
C. Strained FET
We conclude this chapter by mentioning the first attempts to use the strain enhancement technology as introduced by Minamisawa et al. Reference Minamisawa, Süess, Spolenak, Faist, David, Gobrecht, Bourdelle and Sigg26 to improve the performance of CMOS FETs. Luong et al. showed a way to apply this bridge technology to increase the electron mobility of n-type MOSFETs using sSOI as starting material. Reference Luong, Knoll, Blaeser, Süess, Sigg, Schäfer, Trellenkamp, Bourdelle, Buca, Zhao and Mantl64 The compatibility of the bridge straining approach with scaling has been discussed for a FinFET design of the current sub-22 nm node down to the 7 nm technology node where a mobility increase of more than 80% is expected at 2.9 GPa stress. Reference Schmidt, Süess, Barros, Geiger, Sigg, Spolenak and Minamisawa65 However, a demonstration of such a breakthrough has not been undertaken yet.
VII. CONCLUSION
A top-down strain technology based on the enhancement of a potentially small pre-strain ε0 was presented. We established this technology for various material systems and demonstrated its simplicity and universality, i.e., viability on various length scales from the nanoscale to the macroscale. This strain technology supports explorations of new phenomena because it is a simple and versatile approach which is top-down and extends already existing knowledge into new strain regions. Important for the latter is that we found that current strain limits are imposed by fabrication uncertainties and not by the material.
We hope that by showing the potentials of this strain technology, we can motivate researchers from various solid-state physics background to explore new physics in the presence of strain as well as to challenge seemingly understood knowledge beyond previously available strain magnitudes.
Finally, we expect that the wafer-based top-down strain method opens the path for employing strain as a new degree of freedom to systematically change the physical properties of materials in a similar way as doping did over the last decades in semiconductor device development.
ACKNOWLEDGMENT
We would like to acknowledge the scientific support we had from many colleagues. In particular, we like to mention the collaboration with members from CEA LETI, CEA INAC and the Univ. Grenoble Alpes, A. Gassenq, S. Tardif, K. Guilloy, I. Duchemin, G. Osvaldo Dias, N. Pauc, D. Rouchon, J. Widiez, J. Escalante, Y-M. Niquet, F. Rieutord, V. Reboud and V. Calvo, J-M. Hartmann, and A. Tchelnokov for their scientific contributions and the supply of high quality GeOI substrates. We would also like to thank our collaborators J. Frigerio, D. Chrastina, and G. Isella from L-NESS in Como, Italy for providing epitaxial grown Ge on SOI substrates. We also thank our colleagues from PSI, S. van Petegem and S. Bagiante for their contributions in acquiring the X-ray image shown in Fig. 9(a) as well as C. Vaz and A. Kleibert for their assistance with the PEEM shown in Fig. 9(b). B. Delley, we thank for private communication helpful in the understanding of these measurements. For their help in acquiring the temperature dependent μ-Laue spectra at BM32 at ESRF shown in Fig. 4, we thank S. Tardif and K. Guilloy. But mostly, we thank our previous group members G. Schiefler and R. Minamisawa for their contributions to launch the technology and S. Stutz for the technical support in the lab. Finally, we would like to acknowledge the Swiss Science Foundation (SNF) for financially supporting the here presented studies.