NOMENCLATURE
- F
-
fitness of the motion response
- G
-
frequency dependent maximum gain of the motion filter
- H, ∠H
-
frequency dependent amplitude and phase distortion of motion response, deg
- K
-
gain of the motion filter
- HP
-
high-pass motion filter
- K 1, K 2, K 3
-
constant weighting factors
- L IS
-
transformation from simulator to inertial coordinate system
- LP
-
low-pass motion filter
- N
-
number of axes
- T S
-
transformation to Euler angle accelerations
- S I
-
platform displacement, m
- X
-
weighting function for fitness
- f x , f y , f z
-
specific force of the aircraft, body reference frame, m/s2
- g I
-
acceleration due to gravity, inertial reference frame, m/s2
- p, q, r
-
rotational velocities of the aircraft, body reference frame, deg/s
-
 $\dot{p},\dot{q},\dot{r}$
-
rotational accelerations of the aircraft, body reference frame, deg/s2
- u, v, w
-
translational velocities of the aircraft, body reference frame, m/s
- x
-
fitness of the motion response in a single axis
- Δ
-
change in parameter, deg
- Φ
-
phase of the motion response, deg
- β S
-
simulator angular displacements, deg
- μ
-
mean fitness
- ζ
-
damping ratio of motion filter
- σ2
-
variance of fitness for each axis
- ω
-
break frequency of motion filter, Objective Motion Cueing Test (OMCT) input signal frequency, rad/s
- AA
-
cockpit reference point (pilot seat)
- HP
-
high-pass filter
- LP
-
low-pass filter
- i
-
response in the ith axis, where i={p, q, r} for rotational axes and i={f x , f y , f z } for the translational axes.

Greek Symbol
Subscripts
1.0 INTRODUCTION
Certain aspects of motion systems are not currently subjected to extensive objective testing to determine their suitability for piloted investigations or for pilot training. Whilst Certification Specifications for Aeroplane Flight Simulation Training Devices (CS-FSTD(H))(1) requires the completion of a number of robotic tests, quantitative requirements, and ‘special effects’ of flight (e.g. runway rumble, buffet), these do not include observation of the motion platform response following filtering. Therefore, the actual response of the motion platform to pilot control is not objectively considered. As a result, there are no constraints placed on the motion tuning, which is usually conducted by the manufacturer upon delivery of the system. This is conducted entirely through the subjective opinion of subject matter experts and the simulator assessment pilot.
Despite the subjective nature of motion tuning, both manufacturers and researchers possess a range of virtual engineering tools for tuning motion systems. Given the mechanical complexity and cost of the systems, it is important to have desktop validation techniques and software to ensure that the system is configured correctly. Real-time software is also employed to monitor platform behaviour to determine if the platform response is appropriate to any given input demand. Consequently, the expected response of the platform to given conditions can be assessed in detail. Therefore, the motion platform lends itself towards ‘virtual engineering’ efforts.
It is important to mention at this point that motion cues from the motion system are supplementary to the motion cues from the visual system. Cues from the former are sensed by the vestibular system and are best suited to detecting higher-frequency disturbances. The perception of low-frequency motion and steady-state orientation is dominated by visual cues(Reference Hodge, Perfect, Padfield and White2). However, the visual quality and complexity determines the rapidity of the human visual system response. The term ‘motion’ in this study is limited to the vestibular (i.e. physical motion). Although not considered explicitly in the research, one must consider that when the pilot is subjectively assessing the motion cueing in the simulation, s/he is assessing both the vestibular and visual cueing quality.
When assessing motion platforms, pilot subjective opinion is usually obtained through a combination of open-loop and closed-loop testing. Improvements to the cues rely upon the communication between the pilot and the motion filter expert, whereby the subjective comments of the pilot must be interpreted to make the appropriate changes to the motion parameter settings.
The optimum settings for the motion filter parameters must be determined through exhaustive tests with the motion filter expert. This reliance on ‘pilot-in-the-loop’ testing means that motion tuning costs both time and effort, and does not always guarantee optimum results. For this reason, it is often not repeated unless it is imperative.
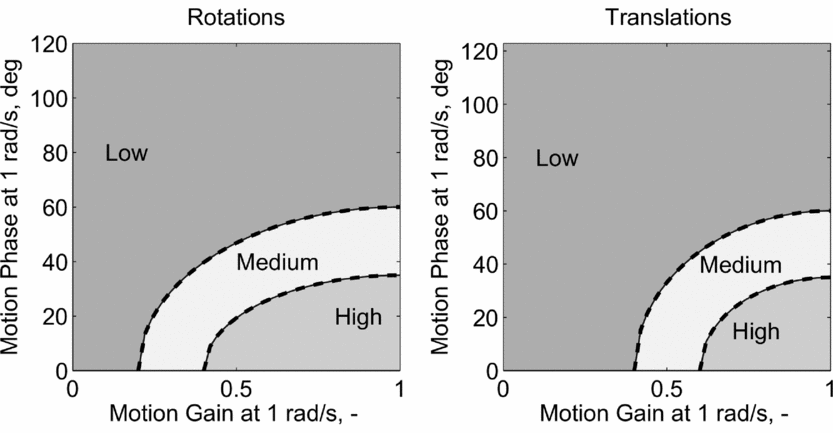
Numerous research efforts have culminated in the development of motion criteria. One of the most used, applied and accepted methods to determine motion fidelity was originally proposed by Sinacori(Reference Sinacori3) and later further validated and refined by Schroeder(Reference Schroeder4). It has been used in many research campaigns (examples include work reported in Refs Reference Hodge, Perfect, Padfield and White5-Reference Zaal, Schroeder and Chung10). The Sinacori/Schroeder criteria characterise the motion fidelity from measured gain and phase shift introduced by the motion drive software at 1 rad/s. This is the frequency at which the semicircular canals, used to sense motion, have the highest sensitivity(Reference Hodge11). Boundaries, determined through subjective and objective evaluation, are shown in Fig. 1. Often, motion parameters required to reach high-fidelity boundaries are not achievable with standard hexapod platform designs. The primary limiting factor is often the translational motion available to achieve the low phase-shift and high-gain motion required by the criteria. To address this issue, some novel simulation platforms are being used for research(Reference Wentink, Valente Pais, Mayrhofer and Bles12-Reference Fischer, Seefried and Seehof15). The fidelity criteria are not often employed for tuning purposes and are subsequently not contained within any certification guidance documents (i.e. Refs 1 and 16). Despite the statement of Sinacori in Ref. Reference Sinacori3 that the criteria “have little or no support other than intuition,” they remain the most well-applied motion fidelity criterion available to researchers today.
Schroeder fidelity boundaries for rotational and translational motion.

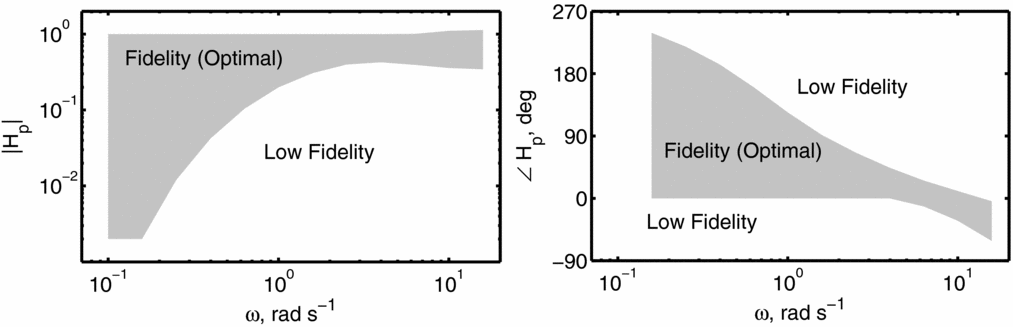
The Objective Motion Cueing Test (OMCT) has been proposed as an alternative method to determine motion fidelity(Reference Hosman and Advani17). The OMCT is designed to test the response of both the motion hardware and software. Results from its application should include motion filtering, hardware dynamics and the digital delays of the motion system. Tests are conducted without a pilot-in-the-loop. Single frequency sinusoidal signals, over a range of typical frequencies expected during simulation (0.1-15 rad/s), are provided as input to the platform. These effectively replace the response of the vehicle model. The amplitude of each signal is defined by the frequency. Output response of the motion system is measured to determine both the change in motion amplitude (motion gain) and the phase distortion following each input frequency. Ten tests, defined by the input and output channels, should be completed; these include both on-axis and off-axis responses of the system. From tests completed using nine fixed-wing transport aircraft simulators, boundaries have been published(Reference Hosman and Advani17). These boundaries were obtained by collecting results from tests from each simulator. Figure 2 shows an example of boundaries for the roll motion from a roll input.
The OMCT boundaries for roll motion with respect to roll input.

The shaded areas denote the regions of ‘fidelity’(Reference Hosman and Advani17) or ‘optimal’ motion settings(18). Both should be treated together. For example, it is not acceptable to reach requirements for motion gain (H i ) whilst failing to meet phase (∠H i ) requirements. Generally, tolerances at 1 rad/s are less stringent than shown through the use of Sinacori/Schroeder boundaries. For example, the OMCT boundaries allow H p = 0.2 − 1.0 and ∠H p = 0-123° at 1 rad/s in the roll axis. Using Schroeder boundaries, for medium fidelity, ∠H p = 0-60° only is allowable. Furthermore, this is only for the case where H p = 1.0. Here, it must be reiterated that the OMCT boundaries include the response of both the motion hardware and software, whereas the Sinacori/Schroeder boundaries only consider the response of the motion filtering.
The validity of the OMCT boundaries has yet to be fully explored with pilot-in-the-loop testing. However, efforts to refine and further investigate these boundaries have been initiated by researchers(Reference Zaal, Schroeder and Chung10). A number of other researchers have also reported results from the application of the criteria to their simulators(Reference Hagiwara, Advani, Funabiki, Wakairo, Muraoka and Nojima19-Reference Stroosma, van Paassen and Mulder21).
The OMCT has the potential to be applied to the assessment of rotorcraft simulators. However, boundaries are likely to be different due to the nature of flying tasks. Due to inherent vehicle instabilities and operational requirements, rotorcraft often require more pilot involvement than fixed-wing aircraft. This exposes different aspects of the motion system than the vehicle type previously used to determine boundaries (i.e. fixed-wing transport aircraft). Finally, although already considered in the original conception of the OMCT, rotorcraft simulators are likely to require more detailed consideration of cross-couplings between axes. This is due to the strong couplings often present in these vehicles, not usually found in fixed-wing aircraft (e.g. collective-to-yaw, pitch-to-roll).
Work to optimise motion cues of flight simulators has been attempted in the past, with some examples of previous research outlined in Refs Reference Hodge, Perfect, Padfield and White2, Reference Hodge, Perfect, Padfield and White5 and Reference Advani and Hosman22-Reference Hosman, Advani and Haeck25. These methods have included optimisation based upon both subjective opinion and objective techniques.
Bilimoria and Reardon(Reference Bilimoria and Reardon23) proposed an error metric based upon the difference between the desired and actual rotational and translational accelerations. This also included weighting factors, to give emphasis to errors in specific channels. Successful application of the method was shown using a Space Shuttle landing trajectory. Ridder and Roza(Reference de Ridder and Roza26) used the OMCT procedure as the basis for an automatic motion drive cueing method, and applied this to a fixed-wing simulator featuring a hexapod motion platform. The research showed that it was possible to optimise the motion cueing offline with limited knowledge of the motion drive algorithm. The results, however, were not investigated with pilot-in-the-loop simulation.
Reardon and Beard(Reference Reardon and Beard7) attempted to use a simple quantitative method for the appraisal of the motion filters for the completion of rotorcraft Mission Task Elements (MTEs). Data from the simulator model, flown without motion were recorded, and optimisation was accomplished through the minimisation of the Root Mean Square (RMS) error between the aircraft and the motion system response over the entire run. This was based upon maximising objective fidelity of the motion cues. However, quantitative methods failed to account for all false motion cues, and application of tuning using this method resulted in a reduced fidelity when measured through subjective assessment.
Motion optimisation using genetic algorithms, as demonstrated in this current work, has recently been undertaken by Casas et al(Reference Casas, Coma, Portales and Fernandez27). This has been applied to the motion control of a robotic motion platform, with the eventual aim of using the method to tune ‘piloted’ simulation devices (i.e. driving simulation). The method uses a simple function of difference between simulation input and motion output in the optimisation process. Work to date has focused upon the settings of the algorithm and general performance tests. The objective success of the methodology has yet to be demonstrated.
In addition to quantitative efforts to optimise the motion system, Grant and Reid(Reference Grant and Reid28) developed PROTEST, a process whereby subjective comments are transferred to motion parameter manipulation. This was applied through a computer algorithm in an attempt to capture the knowledge of the motion tuning expert.
Hodge et al(Reference Hodge, Perfect, Padfield and White2,Reference Hodge, Perfect, Padfield and White5) combined both the use of subjective pilot opinion and objective supporting analysis to optimise the motion fidelity of a short-stroke hexapod motion platform. Motion fidelity during both a roll-sway and a yaw capture task was assessed using a novel pilot subjective motion rating scale. Motion perception models were used to confirm pilot subjective ratings for results obtained from completion of the yaw capture task.
This paper presents a new method to optimise the response of a motion system, which is applied to a hexapod type platform. The optimisation is conducted using a fitness function developed in this research. The paper proceeds as follows. Firstly, the role of motion cueing is discussed in more detail, outlining the methods used to provide the pilot with vestibular motion cues. Secondly, a novel optimisation approach is presented, which uses a genetic algorithm in order to optimise the response of the motion base. Thirdly, the method is applied to a number of test cases, recorded from piloted simulation, and analysis of these cases is conducted. An additional study showing results from changes in actuator leg length is shown for one of the test cases. The paper finishes with conclusions from the work, and recommendations for future research.
2.0 MOTION CUEING
2.1 The AVES simulator
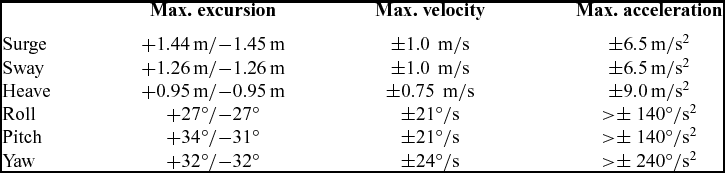
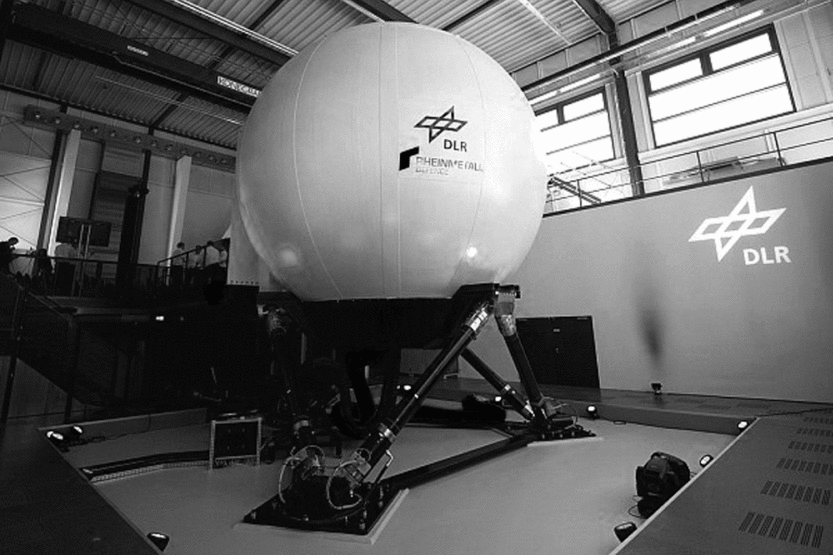
In 2013, DLR opened the Air Vehicle Simulator (AVES), which consists of two full flight simulators – one with an A320 cockpit and the other with an EC135 cockpit(Reference Duda, Gerlach and Advani29) (see Fig. 3). The EC135 cockpit is configured to represent the Active Control Technology/Flying Helicopter Simulator (ACT/FHS), a highly modified version of the aircraft type. AVES features interchangeable cockpits, which can be installed onto a hexapod platform. The maximum performance of the motion system is shown in Table 1. These are data supplied by the manufacturer and are slightly larger than achievable in a single axis. Each actuator leg has a maximum displacement (stroke) of approximately 1.5 m.
The Air Vehicle Simulator (AVES) in the simulation centre, DLR, Braunschweig, Germany.
AVES motion platform limits

AVES is used for both research and pre-flight testing of the ACT/FHS. The simulator includes a full non-linear flight simulation model of the ACT/FHS bare airframe in addition to the full hardware and software used in the aircraft’s experimental system(Reference Kaletka and Butter30). The use of the simulator for flight test preparation increases safety and reduces the required in-flight testing time. AVES benefits from both a purpose built replica cockpit of the ACT/FHS and a large visual projection system, with a maximum visual field-of-view (FoV) 240° × 93°.
2.2 Principles of motion cueing
Motion filters define how the motion is delivered to the pilot, the use of motion space and how efficiently the motion platform will return to its neutral position.
Within the human vestibular system, the semi-circular canals are used to detect angular motion and the otoliths are used to detect linear motion. Semi-circular canals have evolved to primarily sense angular velocity and can be used to accurately detect motion over a frequency range 0.1 Hz to 3.0 Hz(Reference Hodge11). The threshold for which angular velocity can no longer be detected in a simulator has been measured as between 0.2-2.0 deg/s. This depends on the axis of motion and the availability of additional cues(Reference Hodge11). The threshold for detecting linear acceleration has been measured as between 0.003 g and 0.008 g(Reference Groen, Wentink, Valente Pias, Mulder and Van Paassen31). This inability of humans to accurately detect motion at low frequencies can be exploited in the motion cueing algorithms.
The most commonly used motion filter algorithm is the Classical Washout Algorithm (CWA), developed by Reid and Nahon(Reference Reid and Nahon32). A derivative of this strategy is used in AVES. The general, and simplified, filtering strategy used for results presented in this investigation is shown in Fig. 4.
Motion filtering technique used in this investigation.
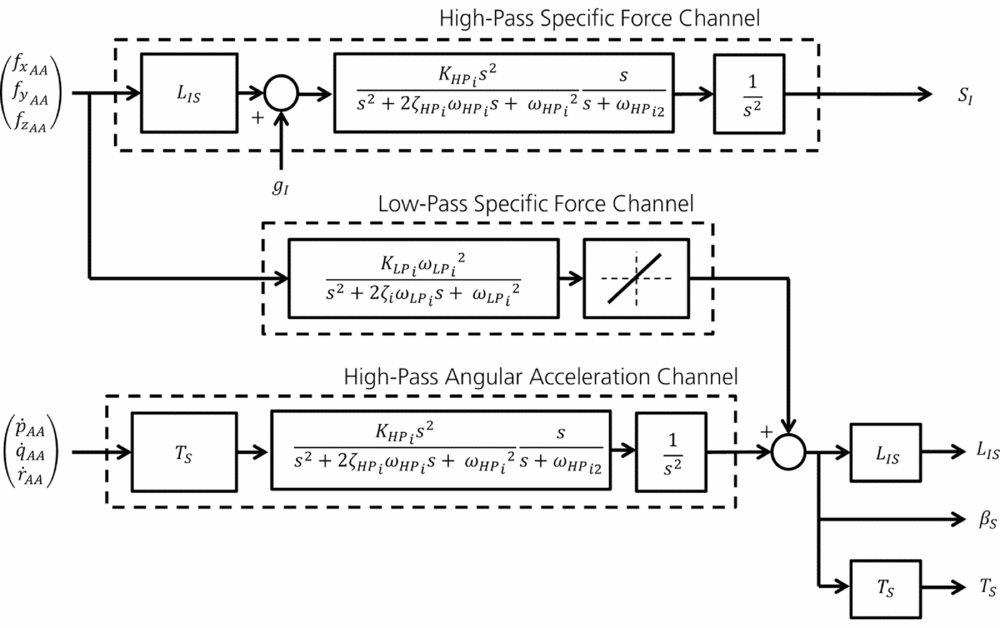
The filtering system features both high-pass (HP) and low-pass (LP) filtering elements. For analysis conducted in this research, standard third-order HP filters (previous research has stated that these are required for rotorcraft simulation(Reference Hodge, Perfect, Padfield and White5)) and second-order LP filters are used within the structure shown in Fig. 4.
Aircraft specific forces are defined as the force per unit mass, excluding gravitational forces. These are first transformed to the cockpit reference point (position of the pilot seat). These specific forces (f xAA , f yAA , f zAA ) are fed into both HP and LP channels. The HP channel is used to remove low-frequency motions, which would otherwise result in the motion platform reaching actuator travel limits. HP filtering is conducted in the inertial reference frame through the transformation L IS . Once forces are in the inertial coordinate system, gravity (g I ) is added. All third-order HP filters contain motion gain (K HPi ), break frequencies (ω HPi , ω HP i2 ) and damping ratio (ζ HPi ). Filtering is then completed, giving motion accelerations, which are integrated twice to obtain platform displacement, S I .
The LP filters add low-frequency rotational motion, in order to produce additional specific forces which have been removed through the use of HP filtering. This is achieved through the manipulation of the gravity vector, a technique which is often referred to as ‘g-tilt’. The ‘g-tilt’ technique is only possible in the surge and sway axes, and only effective if the pilot cannot sense the platform rotation. Therefore, the channel is rate limited to around 2-3 deg/s. Second-order LP filters contain motion gain (K LPi ), break frequency (ω LPi ) and damping ratio (ζ LPi ).
The HP filtering in the rotational channel is conducted using a similar method as in the translational channel. First, the rotational accelerations (
 $\dot{p}_{AA},\dot{q}_{AA},\dot{r}_{AA}$
) are converted to Euler angle accelerations using the rotational acceleration transformation, T
S
, before filtering is conducted. The output of the third-order filter is integrated twice to obtain angular displacement. At this stage, the output from the LP channel is added to the result to give the total angular displacement of the motion platform, β
S
.
3.0 OPTIMISATION PROCESS
The objective tuning of the motion system is based upon the use of an optimisation method. This section discusses the steps taken to develop the method and the fitness functions used for the optimisation.
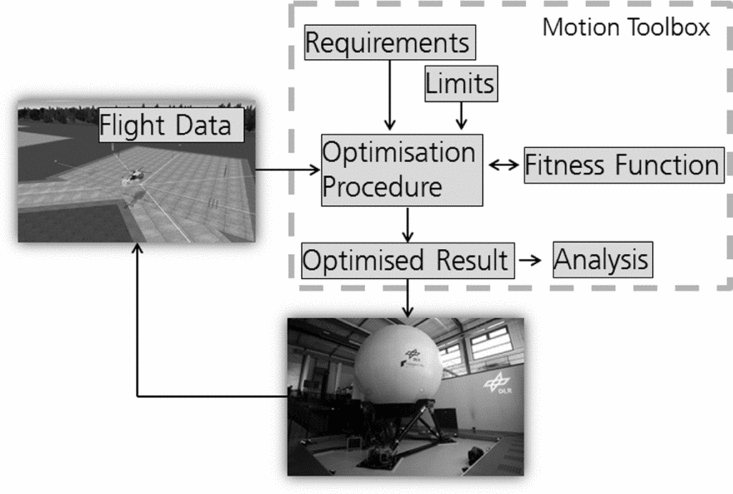
The approach is shown in Fig. 5. Optimised motion filtering is achieved through the use of task-based appraisal. Through the use of tasks and specific flight conditions, the motion can be tuned for the specific purpose. As a result, the motion platform envelope should be more effectively utilised. The flight data used for the tuning process is input into the system, along with the limits and the requirements of the motion platform. In these investigations, data from recorded simulation tests are used, rather than actual flight test data. The method could also use data collected from flight testing. The result of the optimisation is a set of task specific motion filters.
Process for the continuous tuning of the motion platform.

3.1 Proposed fitness function
A fitness function has been developed from tests conducted in AVES. Initial functions were investigated in research discussed in Refs Reference Jones33 and Reference Jones34. First attempts were developed directly from the Schroeder fidelity boundaries(Reference Schroeder4) (shown in Fig. 1). The step changes between low, medium and high fidelity were not entirely suitable for an optimisation process. Therefore, blended functions were also investigated, where fitness improved when the motion filter gain was increased and the phase distortion was decreased. The functions developed did not account for the interaction between motion filtering in different axes. Large differences between filtering (for example high-fidelity roll and low-fidelity sway cueing) were found to be a problem using these approaches.
In the work described in this paper, proposed extensions to the previous concepts are introduced. The function presented here uses techniques to improve the balance in the motion cueing characteristics during the optimisation procedure.
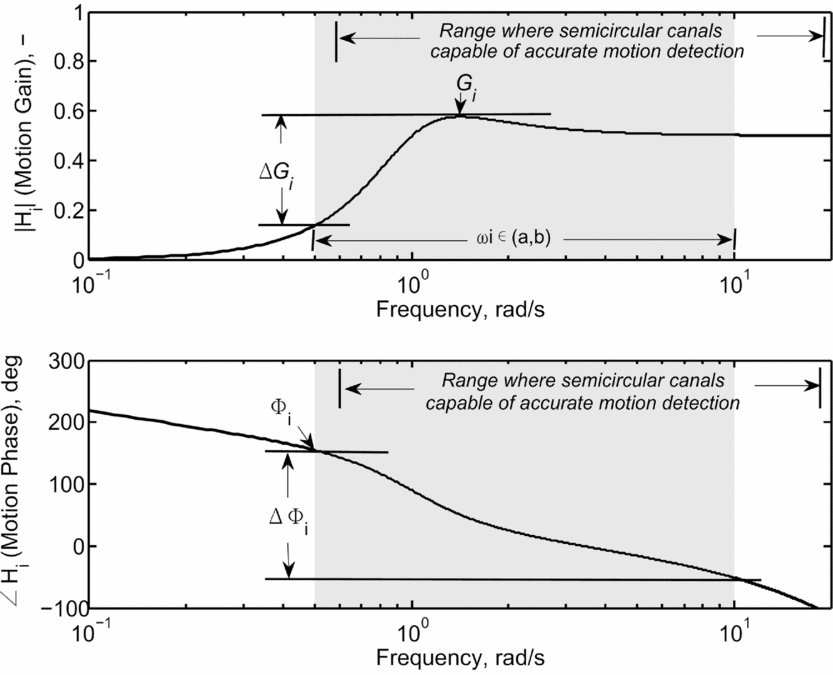
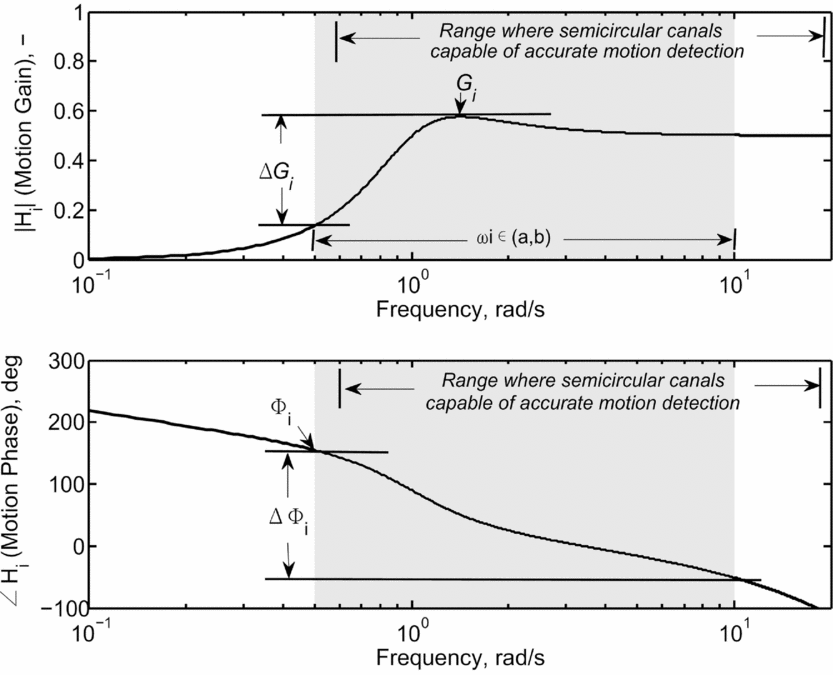
Fitness is determined from the response of the motion system in each axis. A typical example of the response of a third-order motion filter with respect to frequency is shown in Fig. 6. When evaluating the fitness, the response of the motion is considered between points a and b. This is shown as the shaded region in Fig. 6. This region is used to capture the typical range of closed-loop pilot control (a = 0.5 rad/s and b = 10 rad/s). As stated previously, humans can accurately detect angular velocity motion at frequencies above 0.1 Hz (0.63 rad/s). This is close to the minimum frequency used in this investigation and changes to motion parameters in this range should be detected by the pilot.
Typical third-order motion filter response.
To calculate the overall configuration fitness, firstly, the fitness in each motion axis must be calculated. For a six-degree-of-freedom (DoF) hexapod system, the fitness would be calculated for axes i shown in Equation (1).
 $$\begin{equation}
i = \lbrace p,q,r,f_x,f_y,f_z\rbrace
\end{equation}$$
The fitness in each axis (x i ) is calculated using Equation (2).
 $$\begin{equation}
x_i = {X_i {K_{1_i} G_{i} (1- {\Delta G_{i}} - K_{2_i} \Phi _{i} \Delta \Phi _i)} }
\end{equation}$$
Here, K 1 i , K 2 i and X i are scaling factors, G i is the maximum gain, ΔG i is the difference between maximum and minimum gain, Φ i is the maximum phase and ΔΦ i is the difference between maximum and minimum phase. Parameters are shown in Fig. 6, and are calculated between points a and b.
ΔG i is calculated using Equation (3) and ΔΦ i is calculated using Equation (4).
 $$\begin{equation}
\Delta G_i = \max _{\omega \in (a,b)}H_{i}(\omega ) - \min _{\omega \in (a,b)}H_i(\omega )
\end{equation}$$\\
 $$\begin{equation}
\Delta \Phi _i = \max _{\omega \in (a,b)}\Phi _i(\omega ) - \min _{\omega \in (a,b)}\Phi _i(\omega )
\end{equation}$$
Equation (5) is used to calculate the maximum phase, Φ i . Motion response can either lead or lag the vehicle motion. Therefore, motion phase may be positive or negative. The larger of either the maximum or minimum phase distortion is calculated.
 $$\begin{equation}
\Phi _i = \max (|\min _{\omega \in (a,b)} \Phi _i(\omega )|,|\max _{\omega \in (a,b)} \Phi _i(\omega )|)
\end{equation}$$
The maximum gain is given by Equation (6).
 $$\begin{equation}
G_i = \max _{\omega \in (a,b)}H_{i}(\omega )
\end{equation}$$
Phase is calculated in degrees, and motion gain has a maximum value of unity. Therefore, in Equation (2), the influence of the parameters must be scaled appropriately using K 2 i .
The term X i is used to increase or reduce the fitness of the axis based upon the settings of other axes which are likely to have an impact on the fidelity. For each motion axis, a specific value of X i is calculated using Equation (7) to Equation (12).
 $$\begin{equation}
X_p = (1 - K_{3_p}|G_{fy}-G_p|)(1- K_{3_p}|G_p - G_q|)\\
\end{equation}$$
 $$\begin{equation}
X_q = (1 - K_{3_q}|G_{fx}-G_q|)(1- K_{3_q}|G_p - G_q|)\\
\end{equation}$$
 $$\begin{equation}
X_r = 1 - K_{3_r}|G_{r}-G_{fz}|\\
\end{equation}$$
 $$\begin{equation}
X_{fx} = (1 - K_{3_{fx}}|G_{fy}-G_p|)(1- K_{3_{fx}}|G_{fx} - G_{fy}|)\\
\end{equation}$$
 $$\begin{equation}
X_{fy} = (1 - K_{3_{fy}}|G_{fx}-G_q|)(1- K_{3_{fy}}|G_{fx} - G_{fy}|)\\
\end{equation}$$
 $$\begin{equation}
X_{fz} = 1 - K_{3_{fz}}|G_{r}-G_{fz}|
\end{equation}$$
This prevents a system that has unbalanced characteristics (e.g. high rotational fidelity and low translational fidelity). This requirement was also an outcome of research described in Ref. Reference Hodge, Perfect, Padfield and White5.
Once the fitness in each axis has been determined, the variance of these values is calculated. It is not desirable to have high fitness in one axis and low fitness in another. The variance is used as a weighting factor when calculating the overall fitness of the motion configuration. Higher variance will lead to an overall lower fidelity motion configuration. The variance is calculated using Equation (13).
 $$\begin{equation}
\sigma ^2 = \frac{1}{N} \sum _{i=1}^{N}{(x_i - \mu )^2}
\end{equation}$$
Here, μ is the mean fitness for all axes (x i ), and N is the number of axis included in the calculation. Finally, Equation (14) is used to calculate the overall fitness of the motion configuration.
 $$\begin{equation}
F = \frac{1}{\sigma ^2+1} \sum _{i=1}^{N}{x_i}
\end{equation}$$
There are a number of advantages to conducting the objective tuning with the function presented in Equation (14). The first is that only a limited amount of parameters are required for the calculation. The second is that the fitness result is dependent only on the output response of the motion system. Therefore, results should be independent from different filtering techniques. This should ensure that the function is suitable for future novel motion platform configurations.
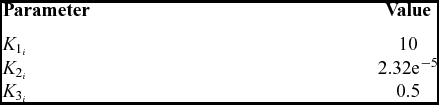
Table 2 shows constant values used in this investigation. The value of K 1 i is a scaling factor for the final fitness result. The values of K 2 i and K 3 i were obtained through exploratory testing with a number of test pilots. Subjective comments from pilots were taken during low-speed manoeuvring. Parameter adjustments to the filters were made during real-time flying. Direct pilot comments were collected whilst varying motion filter parameters. The subjective comments were used to calculate the fitness parameters following tests. For example, if the pilot commented that the motion was low fidelity, parameters K 2 i and K 3 i would be tuned to result in low fitness. The value of K 2 i is used to scale Φ i ΔΦ i in Equation (2). As both parameters are measured in degrees, the magnitude is significantly larger than ΔG i , with a maximum value of unity. Therefore, the value of K 2 i is small compared to other values.
Constant values used during this investigation

At the current stage of the research, these numbers are preliminary. The testing used to obtain the constant values was exploratory and unstructured. Whilst the parameters shown in Table 2 appear to lead to beneficial motion cueing during the limited testing undertaken, more thorough investigations are required and will be conducted in future work. In this investigation, values of K 1 i , K 2 i and K 3 i in all axes i are identical. The use of axis dependent values is considered in the discussion section of this paper.
An example of the fitness obtained from a single channel, the roll channel, is shown. Results are obtained from analysis of a third-order HP filter. This analysis assumes that pure roll motion is generated by the simulator. As only roll motion is considered, X p = 1 (K 3 p = 0 to remove influence of other axes) and σ2 = 0. Therefore, Equation (2) reduces to Equation (15).
 $$\begin{equation}
F = x_p = {{K_{1_p} G_{p} (1 - {\Delta G_{p}} - K_{2_p} \Phi _{p} \Delta \Phi _p)} }
\end{equation}$$
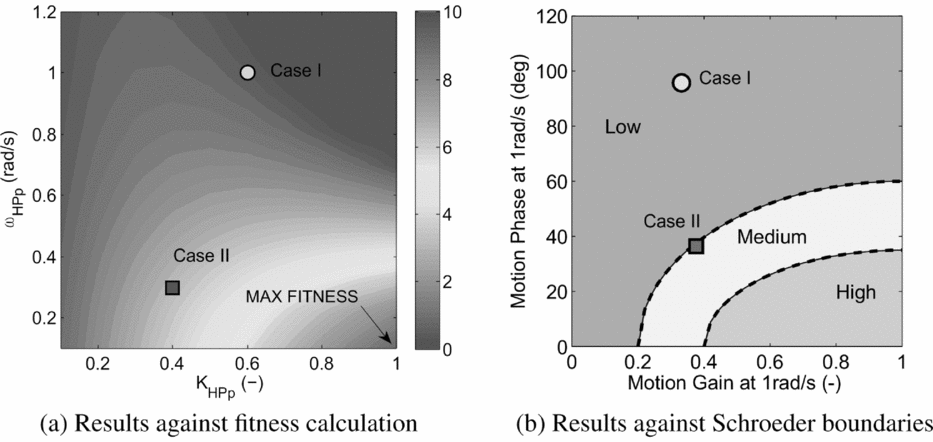
Figure 7(a) displays the fitness obtained with respect to motion gain (K HPp ) and break frequency (ω HPp ) parameter modifications. The maximum fitness in the roll axis is 10. This is equal to K 1 p . This is for the case where K HPp = 1 and ω HPp = 0 rad/s. Logically, higher fitness represents better motion.
Comparison between fitness calculation and Schroeder objective fidelity boundaries.

Figure 7(b) shows the Schroeder objective fidelity boundaries used for all rotational axes. These boundaries are plotted with respect to motion gain and phase at 1 rad/s. Both Figs 7(a) and 7(b) show two points (Case I and Case II). These two cases have similar motion gain at 1 rad/s, but have a large difference in phase at this frequency. Both the fitness, obtained using Equation (15), and the Schroeder boundaries show significant differences between the fidelity of the two cases. Case I, featuring high-break frequency, is predicted to lead to low-fidelity motion cueing. This is also shown through a fitness which is significantly lower than the maximum value. Case II, featuring lower motion gain and lower break frequency is on the low/medium boundary using the Schroeder plot. The fitness is a significant improvement over Case I. This reflects the Schroeder boundaries. At this stage in the research, the translation of a numerical fitness value to a motion fidelity is not possible. This must be determined through both extensive pilot-in-the-loop investigations and through comparison with previous fidelity metrics (e.g. Schroeder boundaries).
3.1.1 Optimisation parameters
When optimising the filters, any of the parameters shown in Fig. 4 can be selected. For this study, primarily the motion filter gain (K HPi , K LPi ) and the motion filter break frequencies (ω HPi , ω LPi ) have been optimised. These allow a large range of filter parameters, covering the range of objective criteria(Reference Schroeder4,Reference Hosman and Advani17) to be evaluated.
The motion gain (K HPi , K LPi ) is the amplitude of the motion with respect to the amplitude of vehicle motion. For the HP motion, the larger the system gain (i.e. K HPi → 1), the larger the platform motion. K HPi =1 represents amplitude which has the same maximum amplitude in the simulator as in the real aircraft. However, larger platform motion gain must be accompanied by higher break frequency. For filters used in this investigation, this will cause higher motion washout to ensure that limits are not reached.
Tuning the HP break frequency (ω HPi ) of the system determines the amount of washout that will be experienced in the simulator. The actual vehicle motion features no washout. Washout adds frequency dependency to motion amplitude and phase response. Therefore, the design of the washout system requires careful attention. More washout will allow larger motion gains but will increase the phase distortion which will eventually be felt as a false motion cue by the pilot.
3.2 Optimisation approach
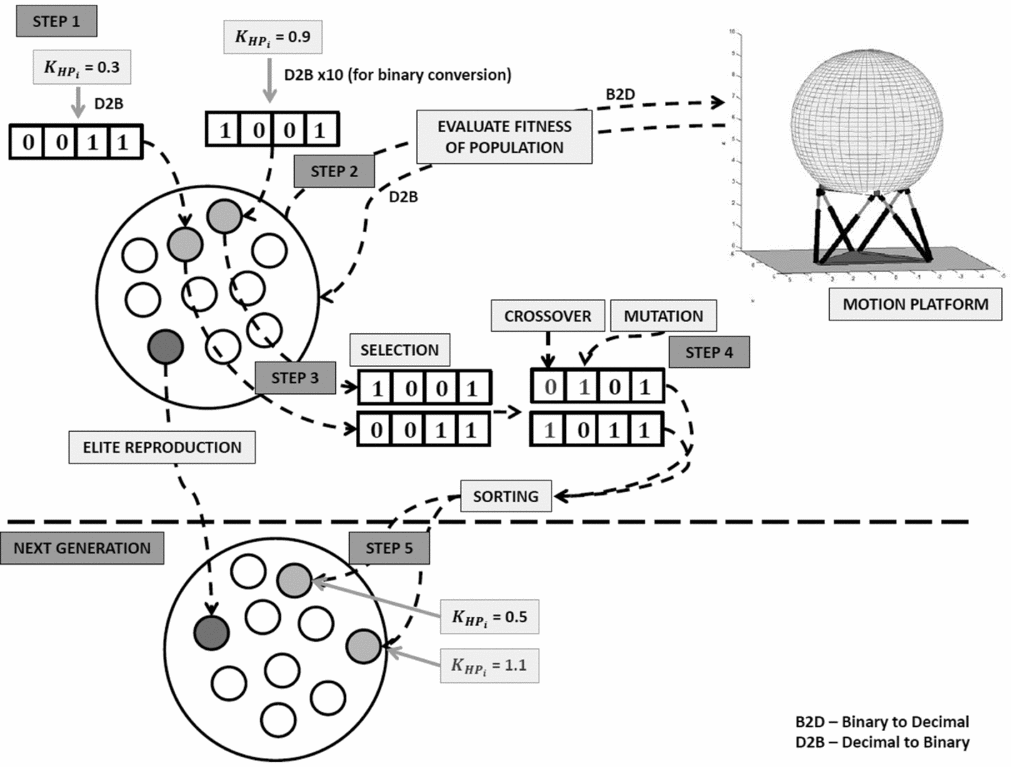
For results presented in this paper, a genetic algorithm method is used for optimisation. This method uses nature-inspired selection techniques to optimise the response. A schematic for a simplified version of the process is shown in Fig. 8. This is shown for a simple case of tuning the HP motion gain.
Genetic algorithm process for tuning motion filters.
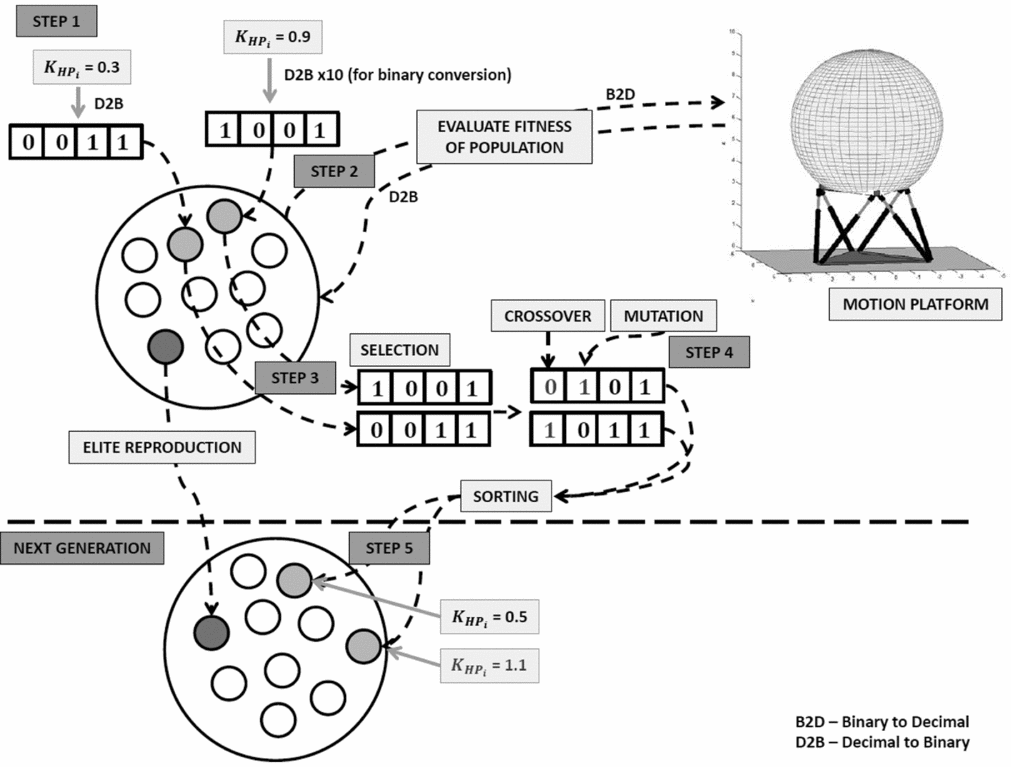
In Step 1, a random set of values (unknowns) are generated. These represent filter parameters to be optimised. In the case shown in Fig. 8, a ‘population’ of 10 random values for motion gain have been generated. Each of these is represented in the population as a binary string. When more motion parameters are optimised, each binary number is combined to form a longer binary string. Each binary string is referred to as one ‘chromosome’.
In Step 2, each of the chromosomes is used as input to the motion platform, to determine the fitness (described in Section 3.1). The binary strings must be converted to real numbers for input to the motion system. Once the fitness of each chromosome in the population is known, selection is initiated. This is Step 3.
Selection is accomplished to form a new generation from the existing population. This takes inspiration from evolution, receiving the best characteristics from the previous generation (i.e. survival of the fittest). The strongest chromosomes in the generation are retained, through ‘elite reproduction’ (referred to as elite chromosomes). This is to ensure that the best characteristics of the generation are not lost. The following chromosomes of the next generation are selected through roulette wheel selection. An amount of chromosomes equal to the population size minus those already selected through elite reproduction are selected. The fittest chromosomes are more likely to be selected, as more weighting is given to these cases.
In Step 4, the newly selected population (with the exception of elite chromosomes) undergoes genetic changes, to alter it from the previous generation. The techniques used to achieve this are:
-
• Crossover: Two random chromosomes are selected and a random bit position within each is selected. This is then used as the point to exchange information between the chromosomes. Two new chromosomes are created; one with the first half of the information from one chromosome and the second half from the other, and vice versa. This is repeated to perform crossover on a percentage of the population given by the optimisation variables.
-
• Mutation: Random binary bits within chromosomes are swapped to change the motion filter parameters.
In Step 5, the new population is formed. Steps 2-5 are then repeated. This continues until the maximum number of generations or the desired fitness has been reached. As the fittest motion characteristics are more likely to survive to the next generation, each generation is stronger than the previous. The solution is the fittest chromosome from the final generation. The binary string is converted to decimal numbers, which can be input as the previously unknown values in the motion drive algorithm.
Additional constraints are added to ensure that the solution provides acceptable cueing. When a chromosome violates a constraint, its fitness is zero. The most important constraints are the motion travel limits. These are set as leg extension values. The motion case is unacceptable once any leg minimum/maximum extensions is reached. These cases are not considered acceptable, as the travel limit could not only damage the motion platform, but also lead to false cueing sensation. In practice, a margin between the maximum actuator travel achievable and the actual allowable travel is often used in motion system software to provide an additional safety limit. Furthermore, motion systems often incorporate non-linear filtering close to these limits to avoid harsh limiting. These aspects should be considered when setting these constraints for the optimisation.
Additionally, all filter parameters (rotational and translational) should be non-zero and greater than zero (e.g. negative motion gain is not logical). Filter parameters were limited based upon logical acceptable values. For example, motion gain in any axis may not be greater than unity as this would lead to motion larger than the actual vehicle. In this case, one of the values shown in Fig. 8 would have a fitness of zero. This would be determined during Step 2.
3.3 Virtual engineering toolbox
The optimisation process conducted in this research was completed using a virtual engineering toolbox. This toolbox is described here. It has been generated using MATLAB and aims to provide a generic platform to assess the characteristics of the motion cueing. The toolbox can be used both to calculate the motion response using pre-defined filter settings or to perform optimisation. Both of these methods use recorded flight test data (either from in-flight or the simulator) to determine the motion response.
If parameters for a motion system are known, one can use the tool to observe what the motion response will be for a certain test case, for example, if the user wishes to observe the motion utilisation for a different task or vehicle configuration. Furthermore, motion parameters can be modified in order to observe the change to the motion response (e.g. if the user wished to observe whether a larger motion gain could be implemented whilst remaining in limits). Here, the user can select which filter parameters to change using slider bars and input boxes. The toolbox features an in-built approximation of the motion platform response.
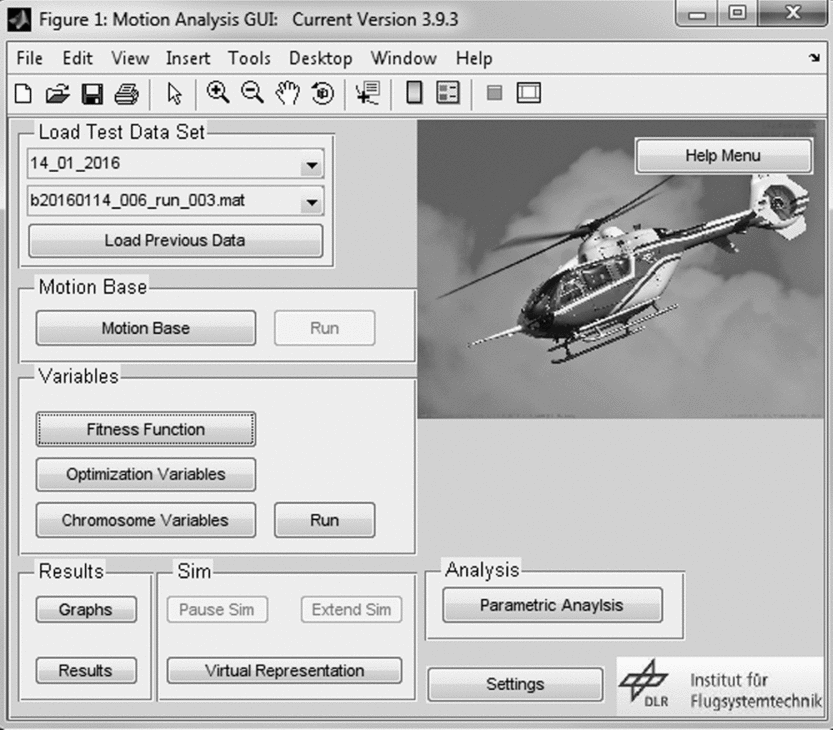
The main window of the Graphical User Interface (GUI) is shown in Fig. 9. Here, the user can select test data, motion parameters and optimisation variables.
Motion analysis toolbox main window.

A more advanced application of the motion toolbox is to perform optimisation. The procedure discussed in Section 3.2 was implemented in the toolbox. The optimisation procedure can run using standard computer hardware. Within the toolbox, there are a number of user-defined inputs, which determine how the optimisation procedure will be conducted. Firstly, the user may decide which motion parameters they wish to optimise. The user interface features tick boxes, enabling and disabling optimisation for specific parameters. The parameters selected for optimisation will ultimately determine the maximum fitness which may be obtained. In the future application of the tuning method, clear guidelines regarding the tuning parameters should be developed to remove subjectivity during the selection. In this way, the user can select which motion parameters they wish to optimise. Prior to optimisation, the user can also select the parameters, including the number of chromosomes and generations, and the genetic algorithm parameters.
System limits can also be selected. This is useful if the user wishes to optimise the motion travel whilst maintaining an additional safety limit. Reducing the allowable leg travel can allow for the additional safety margin to be incorporated into the optimisation results. Standard limits are preloaded to the program.
A further feature of the motion toolbox is the ability to perform a parametric appraisal of filter settings. This can be performed before or after the optimisation and allows one to observe the influence of parameters upon the fitness of the motion cueing. In this respect, it is also possible to observe whether the solution (either from pilot tuning or from the optimisation approach) represents the theoretical maximum for the parameters. The current toolbox allows the appraisal of two characteristics from the set of filters. The use of the parametric analysis can help to determine whether the optimisation has converged on an optimal solution.
4.0 APPLICATION
The following section discusses data used to perform the optimisation and the results obtained. A further study showing the influence of actuator leg stroke on the overall fitness obtained is also shown.
4.1 Scenarios and data acquisition
To demonstrate the optimisation procedure, it was applied to a number of scenarios to obtain optimised motion configurations. These scenarios were selected as they represent typical missions for the ACT/FHS aircraft. They also offer an insight into how different motion settings are required for changes in simulator and vehicle use.
Three scenarios were selected for investigation; a precision hover task (PH), a lateral reposition task (LR) and forward flight (FF) task using a ‘tunnel-in-the-sky’ guidance display. The hover task was performed to standards contained in Aeronautical Design Standard (ADS)-33E-PRF (ADS-33(35)).
The lateral reposition performance standards contained in ADS-33 were found to lead to very large motion platform excursions. This severely limited the range of motion that could be investigated. Therefore, tolerances for ‘underslung loads’ were used. These tolerances allow a longer time to complete the manoeuvre, which reduces the task aggression significantly. Both research efforts by Schroeder(Reference Schroeder4) and Hodge et al(Reference Hodge, Perfect, Padfield and White5) included ‘roll-lateral’ sidestep tasks. For desired performance, Schroeder required pilots to perform a lateral translation of 20 ft in 10 seconds. Hodge et al used a similar course layout, but required a translation of 40 ft in 6 seconds. This included time for stabilisation. Both require a lower average lateral ground speed to complete the manoeuvre than the lateral reposition used in this investigation.
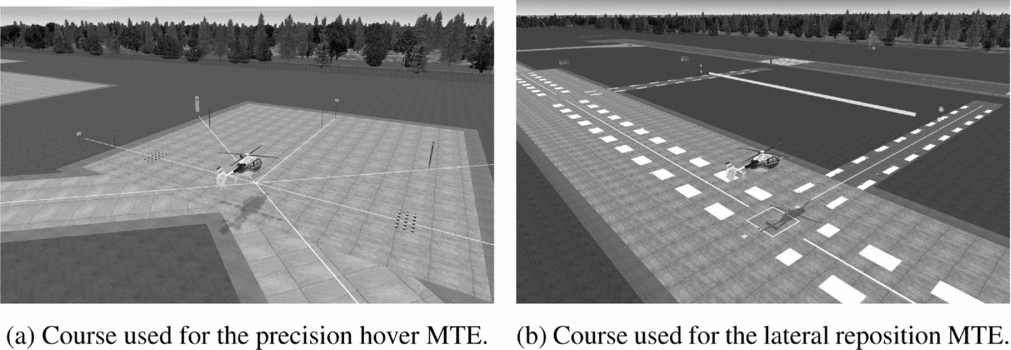
Both the hover and lateral reposition tasks were used to evaluate the motion cues experienced during low-speed flying. Both tasks feature translational and hovering flight phases. Figure 10 displays courses used for completion of the tasks. The pilot uses visual cues to judge whether desired and adequate performance requirements have been achieved.
Low-speed flight tasks conducted during the investigation.

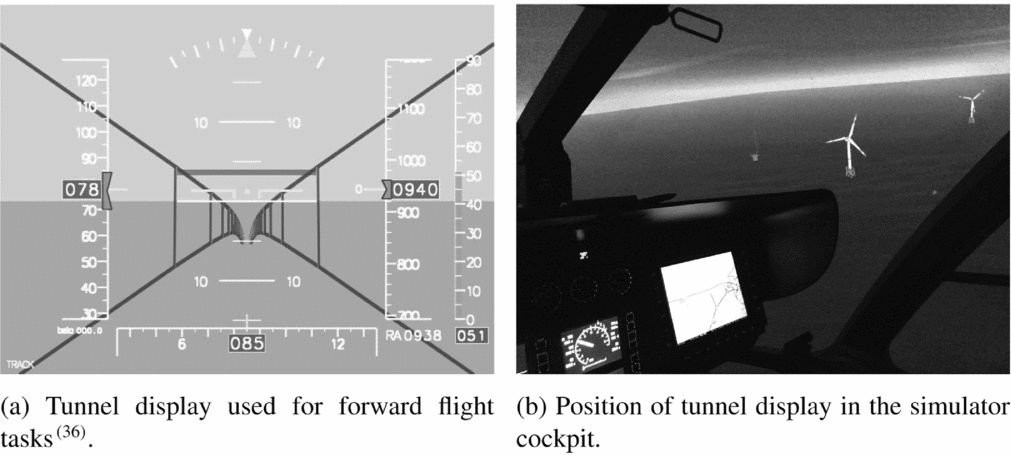
The tunnel display, shown in Fig. 11(a), was used to obtain the trajectory of the vehicle during forward flight. This is currently employed for flight guidance tasks and noise research(Reference Olsman and Gursky36). The tunnel display combines both the dynamics of the helicopter and the flight-path requirements to plan an acceptable route to the desired landing point.
Use of DLR’s tunnel display for motion evaluations.

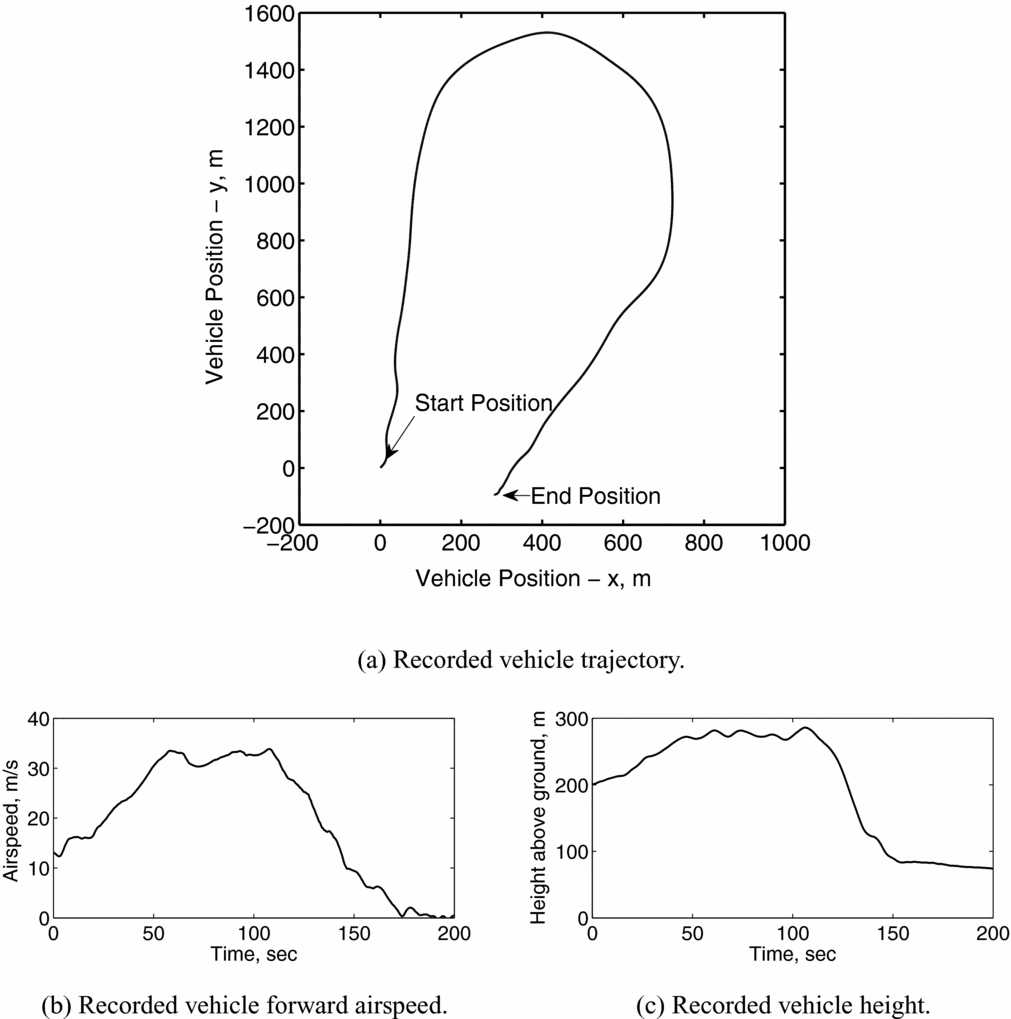
Figure 12 displays data recorded during one completion of the forward flight task. The pilot must first accelerate to reach a target speed of approximately 30 m/s (60 knots). The tunnel display guides the pilot through a sustained turn, which is followed by a decelerating phase of flight. This is accompanied by a descent to 80 m. The manoeuvre ends with the aircraft hovering above the landing point. The tunnel is calculated depending upon where it is activated. In this case, the tunnel was activated at the start position displayed in Fig. 12(a).
Recorded vehicle data during completion of forward flight mission task element.

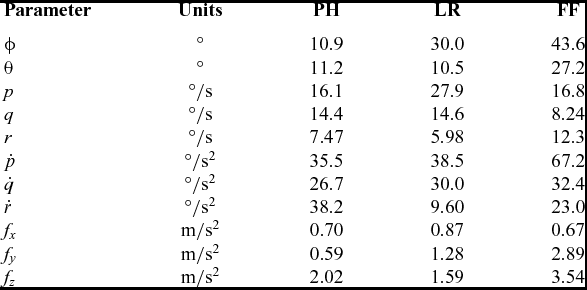
One pilot flew all of the MTEs, to obtain data for the optimisation process. These MTEs were flown using the standard motion configuration used in AVES. Table 3 shows a comparison of the measured vehicle parameters for the three flight manoeuvres.
Maximum attitudes, rates and forces

Comparison of vehicle accelerations and forces experienced show that the forward flight task demands the highest motion accelerations in most axes. The lateral reposition task features significantly higher roll attitudes than the hover task, but accelerations are similar. Furthermore, significantly higher forces are experienced laterally during the lateral reposition. This is to be expected since the required lateral ground speed is higher than during the hover task.
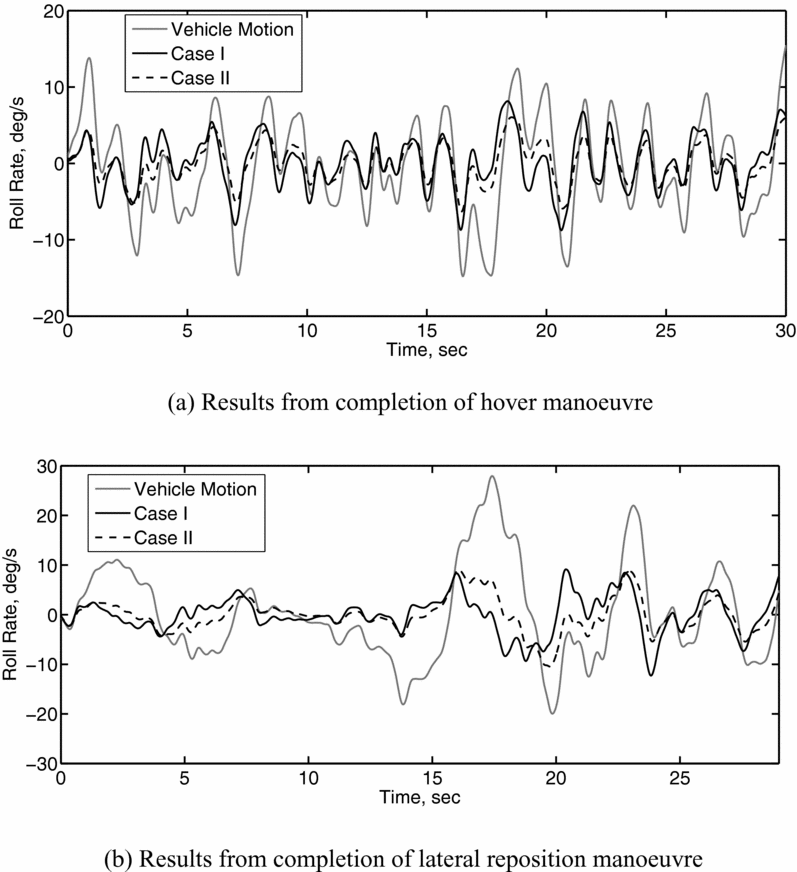
Figure 13 shows the expected motion utilisation using the two cases shown in Section 3.1. It was previously shown that Case I, featuring higher motion gain and washout than Case II, is expected to lead to poorer motion fidelity. This was shown through both results from the Schroeder fidelity boundaries and from the application of the fitness function. Results shown in Fig. 13 are predictions of expected motion usage and were not used during completion of the tasks. Roll rates of the motion platform expected during both the hover and lateral reposition tasks are shown.
Comparison of roll rates between the vehicle model and two motion cases.

Figure 13(a) displays the vehicle roll rate recorded, alongside motion expected for Case I and Case II. In this case, Case I shows larger motion gain but is accompanied by a phase lead. This means that the motion platform maximum roll rate is reached prior to this occurring in the vehicle (and subsequent display in the visual channel). This phase lead, however, is not large, and for the majority of the task, the motion appears to reflect the motion of the vehicle.
Figure 13(b) displays the vehicle roll rate recorded and the motion expected for the completion of the lateral reposition manoeuvre. Results show a larger difference between Case I and Case II. During translations, large sustained roll rates are shown. The largest of these is between 15-20 sec. During this period, Case I motion begins to ‘washout’ rapidly (particularly at approx. 16 sec). The roll rate felt by the pilot opposes the roll rate of the vehicle (clearest between 16-18 sec). This is likely to provide the pilot with a false cue. During the same period, motion for Case II also begins to washout. However, the rate of washout is much smaller than for Case I. Washout between 16-18 sec is approximately 1 deg/s, which is in the region of imperceptible angular velocity limits shown in Ref. Reference Hodge11.
4.2 Optimised cases
The optimisation was conducted for each of the three manoeuvres independently. The recorded data shown in Fig. 13 was used for the optimisation of hover and lateral reposition cases.
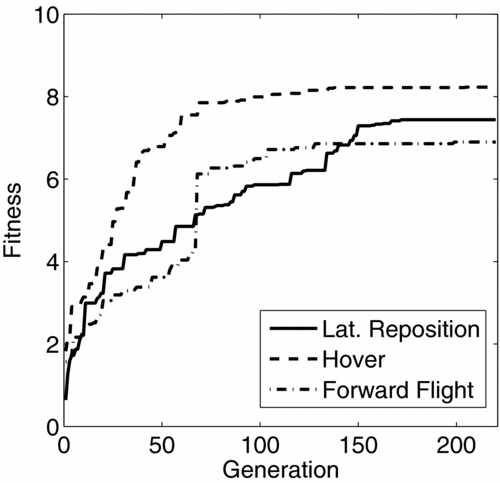
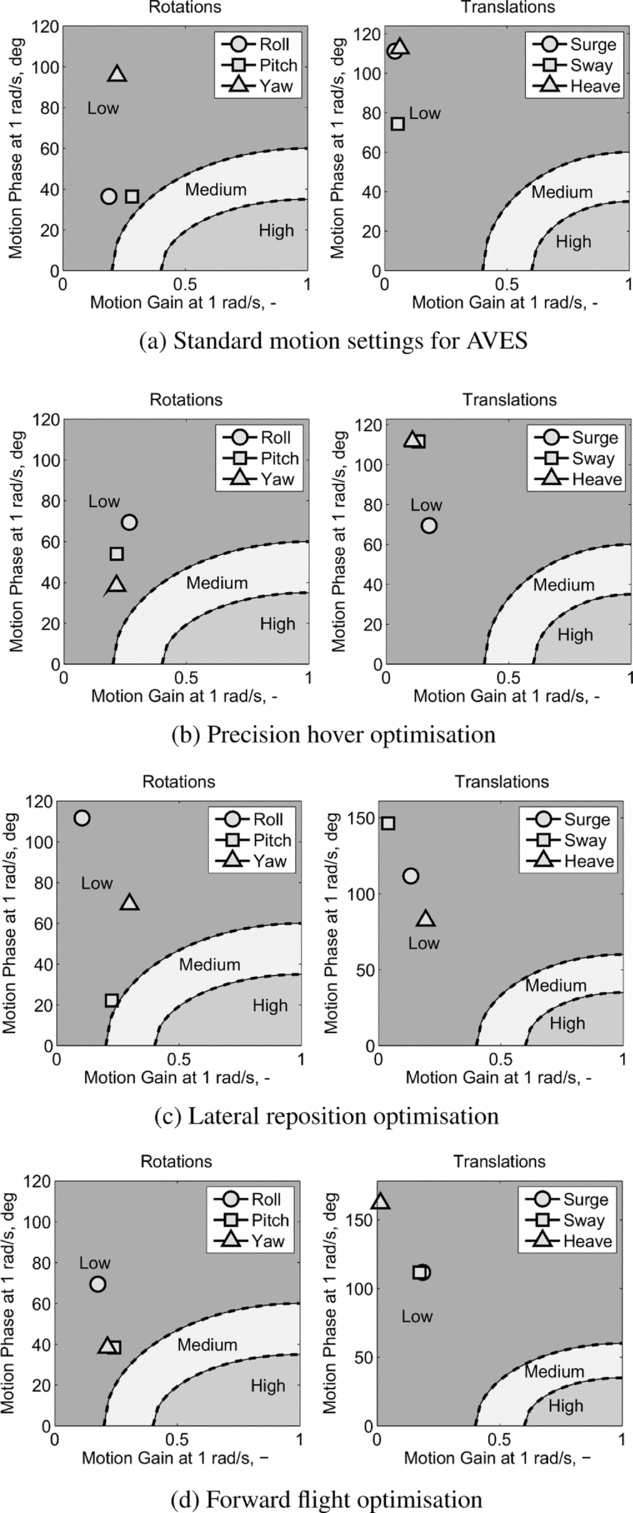
All motion gains and break frequencies were tuned using the process. Both the damping ratios (ζ HPi , ζ LPi ) and ω HP i2 remained constant throughout. These were set to 0.9 and 0.1 rad/s, respectively, considered to be representative as typical values after being previously used in Refs Reference Hodge, Perfect, Padfield and White2 and Reference Hodge, Perfect, Padfield and White5. Each optimised solution was found to converge after 220 generations, when using a population of 50 chromosomes. The convergence was confirmed by running the procedure multiple times. To limit the use of the motion platform, and ensure that it remained within its travel envelope, the travel of each actuator leg was restricted to 50% of maximum travel (0.8 m). Figure 14 displays the progression of fitness for each of the three cases over the 220 generations. This also displays the maximum fitness obtained for each scenario.
Example of fitness function convergence for the three scenarios.

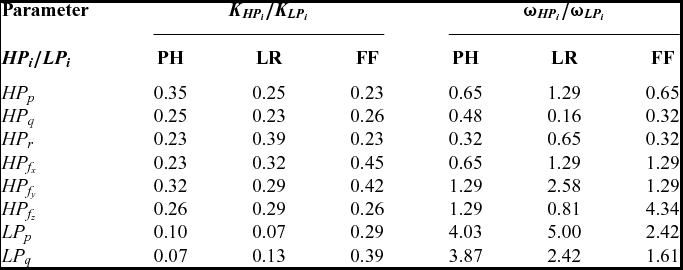
As shown, the hover case was found to result in the highest overall fitness. This was expected as this case features the lowest angular attitudes and specific forces. This case is followed by the lateral reposition case and the forward flight case. Table 4 displays the parameters of the optimised cases. Values are used within the structure shown in Fig. 4 to determine the motion filter settings.
Optimised filter settings for the three tasks

Figure 15 displays results from the optimisation process with respect to the Schroeder fidelity boundaries. As shown, for all cases, all filter parameters are within the low fidelity region. Due to the platform size (and the restrictions placed during this investigation), it was not possible to reach the high-fidelity region for the scenarios considered in this work. The restrictions resulted in very limited translational travel available. As shown in Equation (14), the overall fitness is dependent on the fitness of each individual axis. This prevents high-fidelity rotational cueing which could be achieved without this restriction.
Comparison between tuned motion cases with respect to Schroeder fidelity boundaries

Hexapod motion platforms must provide both translational and rotational motion using the six actuator legs. The interdependency of the legs limits the individual usage in each axis. For example, large roll motion to the left will cause half of the actuator legs to extend and half to compress. Initiating a positive pitch manoeuvre (pitch-up) in this state would require extension of the front platform legs and/or compression of the back platform legs. Due to the roll manoeuvre, some legs are already extended, and cannot support further motion. This trade-off must also be considered for rotational and translational motion. Although it is possible to achieve larger rotational motion, this would come at the expense of translational motion. The fitness function places a requirement to ensure that both translational and rotational motion are treated with the same importance.
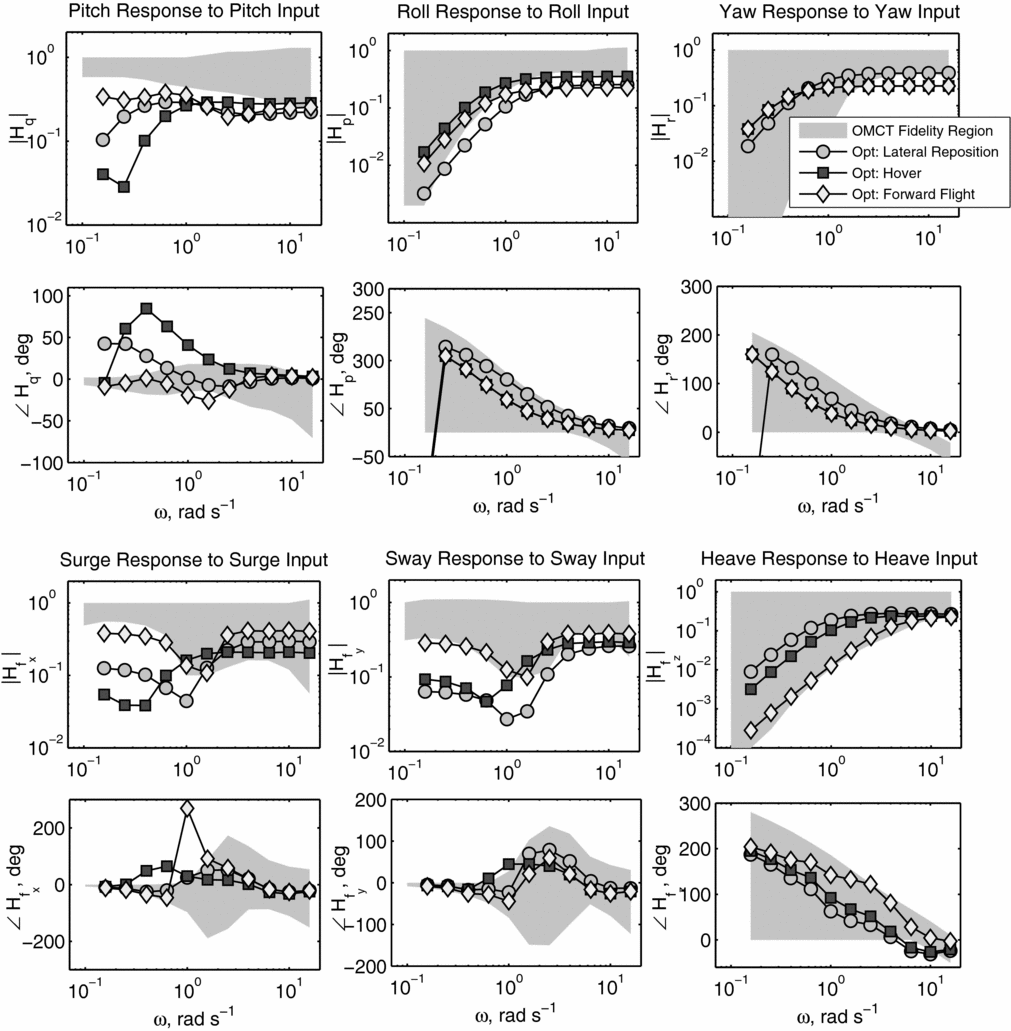
Figure 16 displays results with respect to the OMCT boundaries. As previously stated, these boundaries are developed from research into cueing for fixed-wing aircraft simulators. The use of the method for analysing rotorcraft motion cueing has not previously been presented.
Comparison of the OMCT results for the three tasks.

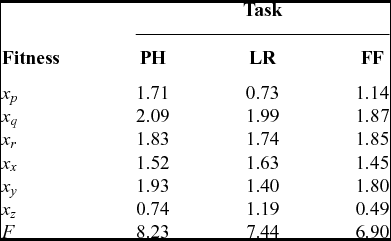
The case most analogous to fixed-wing flight, the forward flight tracking task, has been shown to result in parameters which reflect the OMCT boundaries well. This is with the exception of the surge phase, which is much larger than the boundary at 1 rad/s. This is explained by the fitness obtained in each axis, shown in Table 5.
Fitness with respect to axis for all tasks

The maximum fitness in each axis (the case for 1-to-1 motion) is equal to 10. Although the phase distortion in the forward flight case is much higher than the other two tasks, the fitness is only marginally lower. This is clear when compared to differences in fitness in other axes (i.e. heave). In this case, the reduction in fitness caused by the high phase distortion is smaller than would appear to be required. The reduction in fitness due to the large phase distortion has been compensated through an increase in motion gain. However, the result is far from the requirements of the OMCT boundaries. Without conducting more thorough pilot-in-the-loop investigations, the impact of this phase distortion cannot currently be determined (as the OMCT boundaries are not specifically for rotorcraft). However, if the phase distortion in this case is found to lead to low-fidelity cueing, a further reduction in fidelity due to phase distortion would be required. This could be achieved through further tuning of K 2 i in Equation (2). The case for values dependent on axis for parameters K 1 i , K 2 i , K 3 i are considered in the discussion section of this paper. The largest difference in fitness is found in the heave axis (x z ), which was expected due to the large difference between maximum force during the completion of the different tasks. As stated earlier in this paper, detailed investigations using the OMCT procedure have not been conducted for rotorcraft simulators. It is recommended that rotorcraft specific investigations are conducted to investigate the suitability of current boundaries.
4.3 Influence of actuator stroke
The actuator stroke refers to the maximum travel of each motion actuator leg. The stroke essentially defines the shape and size of the motion envelope. Once a motion leg reaches its limit (either extension or compression), system limits are reached and a false cue will be sensed by the pilot. The larger the actuator stroke, the larger the motion travel range. Often due to software and hardware constraints, it is not possible to use the complete travel range of the actuator legs. The optimised cases presented above were obtained when setting an actuator leg stroke of 0.4 m. This is 50% of the standard usable platform stroke in AVES. Although the platform is capable of achieving 1.5 m leg stroke, soft-limits currently reduce this usable range.
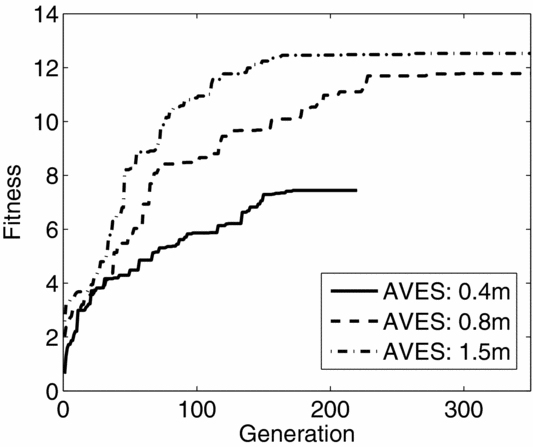
The influence of actuator leg stroke was investigated through the use of the lateral reposition case. The optimisation parameters were modified to allow the complete usable range of each actuator leg (0.8 m). Furthermore, an additional case with the maximum leg stroke (1.5 m) was used for the optimisation. Fitness with respect to generation is shown within Fig. 17. As shown, convergence requires further generations as the length of the actuator stroke increases. Furthermore, the total fitness of the system has been significantly improved through the increase in actuator stroke.
Comparison of fitness progression for varying actuator stroke with respect to generation.

Results show that the fitness increase is much larger when the leg length is doubled from 0.4 m to 0.8 m than when it is increased from 0.8 m to 1.5 m. In the former case, the fitness improves more than 50%. In the latter case, this increase is approximately 5%.
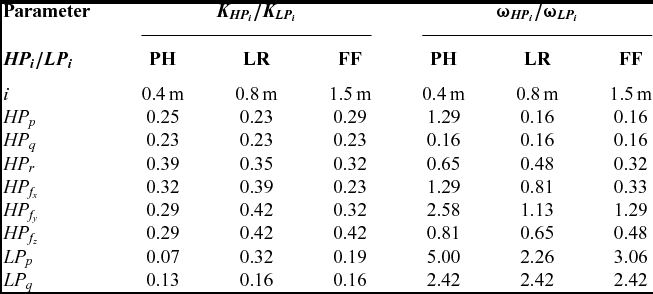
Table 6 displays tuned filter parameters from the three optimisation cases, where actuator length was varied. For all actuator lengths, both motion gain (K HPi , K LPi ) and (ω HPi , ω LPi ) were tuned for all axes.
Optimised filter settings for three actuator lengths

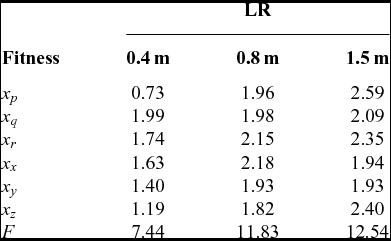
As shown, the additional actuator length did not lead to changes in the motion parameters in all axes. In particular, the filter parameters in the pitch axis were found to remain constant. The fitness with respect to each axis, shown in Table 7, helps to explain why this has occurred. For the 0.4 m case, lowest fitness is found in roll, lateral and heave axes (x p , x y , x w ). As the actuator length increases, these are the axes that see largest improvement. The additional travel available is primarily utilised by these axes and, as a result, other axes’ parameters only experience limited change.
Fitness with respect to axis for all tasks

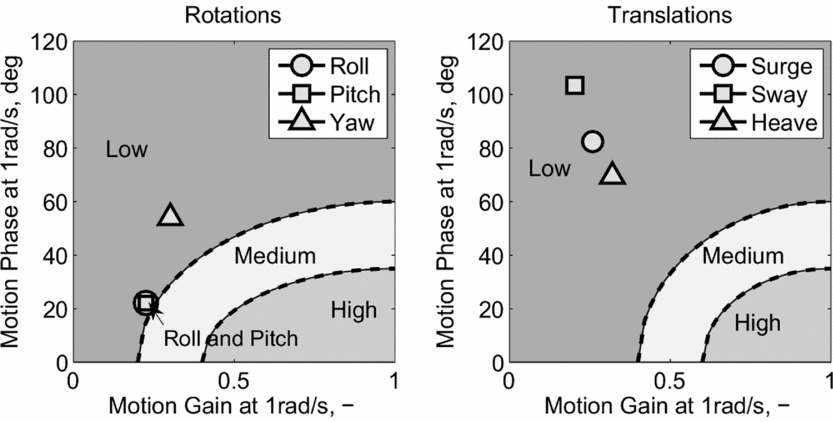
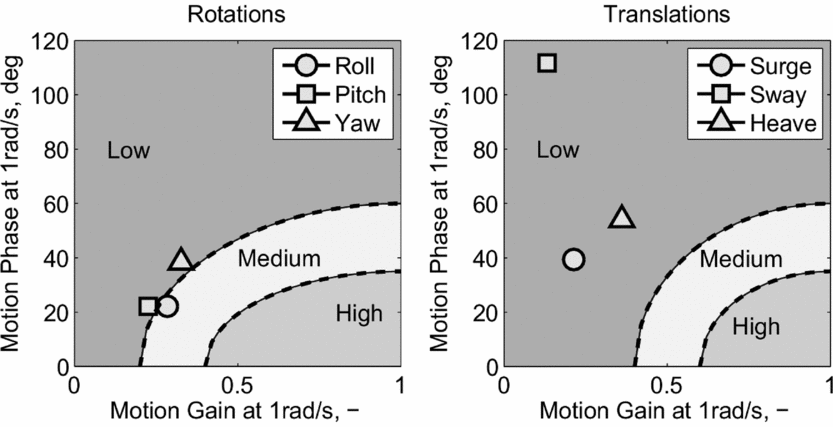
Figures 18 and 19 display results obtained with respect to Schroeder fidelity boundaries. As shown, all motion parameters (with the exception of the roll for the 1.5 m case) are contained within the ‘low-fidelity’ region. Although the overall fitness of the motion cases has significantly improved, a further increase in actuator stroke length (or platform size) would be required to reach the medium- and high-fidelity regions.
Filter parameters with respect to Schroeder fidelity boundaries, 0.8 m actuator stroke

Filter parameters with respect to Schroeder fidelity boundaries, 1.5 m actuator stroke

In the future, a definition of the flying task could help to determine the required motion platform size and dimensions. Analysis here has shown the dependency of actuator stroke on maximum fitness of the platform configuration for specific application to the lateral reposition task. When the objective fitness is related to a specific level of fidelity, either given by objective measures or by subjective opinion, this can be used to define the requirements of the motion platform for specific applications. For example, if it is determined that a certain minimum roll fitness is required for a specific task, a motion platform capable of achieving this fitness would be required. The methods outlined in this paper could be used at the design and commissioning stage for future simulation platforms.
4.4 Discussion
The study has highlighted the difference between motion optimised for forward flight and low-speed flight tasks. For the forward flight task, the motion filter parameters obtained reflect the current OMCT boundaries better than for the low-speed tasks. When the rotorcraft is operated in the low-speed regime, high motion rates at low amplitude have led to a reduction in available g-tilt motion. The g-tilt following the optimisation was much larger for the forward flight cases. When using the OMCT boundaries for objective comparison, it appears that the parameters used for the tuning process may have to be refined. In particular, the large phase distortion found at approximately 1 rad/s in the surge channel is in strong disagreement with the OMCT boundaries.
The use of the OMCT boundaries has yet to be fully investigated in rotorcraft simulation. As stated earlier in this paper, the current ‘fidelity boundaries’ have been defined through the comparison of motion filter settings in nine simulators, configured for simulation of large fixed-wing transport aircraft. The large differences between the OMCT and Schroeder fidelity boundaries at 1 rad/s suggests further investigation must be completed in rotorcraft simulation.
Schroeder(Reference Schroeder4) showed that motion fidelity reduces with motion settings allowable using current OMCT fidelity boundaries. This was shown during the completion of a number of rotorcraft flying tasks and in multiple axes. Hodge et al(Reference Hodge, Perfect, Padfield and White5) also found that pilots reported very objectionable deficiencies when using motion washout that would meet the current OMCT boundaries. It is recommended that similar studies are conducted to evaluate the OMCT boundaries in rotorcraft flying tasks.
During this study, constant parameters in the fitness function (i.e. K 1 i , K 2 i , K 3 i ) were all independent from motion axes. These parameters were set using values determined from exploratory testing in the simulator. Pilots’ subjective feedback was used to obtain the values. However, in future application, it is more appropriate to assign parameters which are dependent upon each axis (i.e. K 1 i , K 2 i , K 3 i vary with respect to i). Using other objective criteria, the motion in all axes do not have the same fidelity boundaries. Schroeder fidelity boundaries, for example, are separated between rotational and translational motion, the latter requiring higher motion gain for medium and high fidelity. The OMCT boundaries are likewise different for each axis. For example, roll and yaw filters with the same parameters would not necessarily both satisfy the ‘fidelity’ region. This should be considered during the future development of the optimisation process and parameters.
Analysis of the fitness obtained with respect to available actuator travel highlighted the non-linearity of hexapod motion platforms. When the expected utilisation of the motion platform for a specific simulator is known, detailed design appraisal can be undertaken to determine the requirements of the motion platform. This is not in terms of hardware capabilities (as contained in current standards(1)), but in terms of motion achievable during the intended use. As shown in the analysis contained in this paper, for the lateral reposition task, doubling the actuator travel from an initial value of 0.4 m was found to result in a 50% increase in fitness. However, a further increase from 0.8 m to 1.5 m was found to give only 5% increase. This analysis can be extended to platform designs. The geometry of hexapod platforms, including actuator lengths and attachment points, can be modified. Moreover, the increase in fidelity offered by additional degrees of freedom, provided by novel motion system configurations, can be investigated. An example of such a system is a hexapod motion platform which is fixed to a lateral and longitudinal track. The system can provide significantly more translational specific force cueing than a standard hexapod system but is significantly more costly and requires a large facility for operation. The benefit and required size of such a system can be investigated using techniques introduced in this research.
One goal of this research is to reduce the dependency on pilot subjective opinion during the tuning process of motion platforms. Other simulator systems (e.g. models, visual systems, and so on) are (usually) tuned without the need for pilot-in-the-loop testing. Pilots provide the final clearance for the system to be used for training. It is envisaged that objective methods could significantly reduce the required pilot testing time for motion tuning. The method presented in this paper can be used as a starting point in the tuning process. Through the use of recorded vehicle trajectories, initial motion settings can be determined using the optimisation process. Piloted assessment can follow, providing comments and tuning improvements as required. The capture of parasitic effects such as system noise and (undesired) vibrations are not currently included and could cause significant pilot discomfort. These factors must be investigated using pilot-in-the-loop testing.
In this investigation, data recorded from simulation has been used. Whilst flight test data may also be used, it is also possible to use generic task trajectories rather than from piloted flights. These could be obtained through the use of pilot/vehicle task-based modelling techniques, using methods outlined in Refs Reference Heffley37 and Reference Hess, Zeyada and Heffley38. The use of generic trajectories rather than specific recorded data would allow the process to be conducted virtually. This would allow tuned parameters to be determined prior to the first simulator flights.
5.0 CONCLUSIONS
This paper has presented a new methodology to tune rotorcraft motion systems. The application of an optimisation method has been demonstrated using a hexapod motion platform. Data used in the optimisation process represented a number of different flight conditions typical of rotorcraft operations. The following are the key conclusions from the work:
-
1. A fitness function has been developed and applied to a research simulator. The relationship of this function to both previous objective criteria and human motion sensors has been discussed. The progression of fitness with respect to motion gain and phase parameters, as a function of a single axis, has been shown to correlate with Schroeder’s fidelity boundaries.
-
2. The fitness function has been used within a genetic algorithm optimisation technique to tune motion filters. It was shown that the optimisation procedure can be successfully applied to determine parameters of the motion washout algorithm. The method was applied to simultaneously tune 16 independent parameters using standard computer hardware. As a result, it was found to be suitable for motion platform tuning.
-
3. The optimisation process was used to tune the motion platform for three tasks. Trajectories flown in the AVES were used. Tuned motion with highest fitness was found for the hover task and lowest for the forward flight task. The hover task featured significantly lower roll attitude and angular acceleration, and lower lateral specific forces. As a result, lower platform motion requirements for roll/lateral motion led to overall higher fidelity motion.
-
4. Comparison of optimised motion parameters with current objective criteria, Schroeder and the OMCT boundaries showed low fidelity following the process. This was due to the restricted platform travel used during the investigation. Translational motion was severely restricted in the investigation. Restriction in translational motion led to corresponding low fidelity rotational motion (due to the structure of the fitness function).
-
5. Modifications to the actuator leg stroke revealed non-linear changes in the overall fitness between the 0.4 m and 1.5 m strokes. When increasing the leg stroke from 0.4 m to 0.8 m, fitness was found to increase by 50%. However, by increasing the actuator leg length further, from 0.8 m to 1.5 m, only a 5% increase was found. The large change was caused by a large increase in roll axis fitness, which was possible due to the increased travel. Roll break frequency could be significantly reduced. This demonstrates how the optimisation procedure could be used during the motion platform design process by evaluating different configurations. The results could have important implications on the use of small motion platforms for pilot training, since it is shown that there is potentially a limit beyond which increases in actuator stroke provide little additional benefit in terms of motion fidelity.
The results described in this paper form part of ongoing research to develop processes for motion optimisation. Whilst the methods and functions presented here have been considered against previous research, they have not been extensively validated. This will be conducted in planned simulation test campaigns. Piloted campaigns will be performed to determine whether the objective fitness correlates with the pilots perception of the motion during flying tasks. At the current stage of the research, the benefit of the motion tuning technique has yet to be fully demonstrated.
Once results from piloted investigations in AVES have been obtained and validation of the objective tuning process has been conducted, it is recommended that the method is employed on other simulation devices. This would determine whether the process may be applied generally to simulation devices (e.g. in the same way as the OMCT process) or if further considerations must be made.
ACKNOWLEDGEMENTS
The author wishes to thank Robert Wilson, who helped to design and build the motion toolbox. The author also wishes to extend thanks to this paper’s reviewers for their detailed and thoughtful comments.
APPENDIX
MISSION TASK ELEMENTS
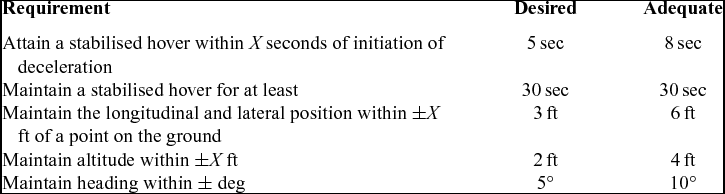
The following section outlines the performance requirements for both the hover and lateral reposition tasks.
Precision hover MTE
The precision hover MTE is designed to check the ability of the vehicle to transition into a stabilised hover. This is performed at a reasonable amount of aggression. The manoeuvre is initiated in a stable hover condition. The pilot then initiates a 45° transition at 6-10 knots. The pilot is required to translate to a designated point whereby they initiate a deceleration followed by a stabilised hover, which is completed using task requirements shown in Table 8.
Precision hover performance requirements (Cargo/Utility, Good-Visual-Environment(35))

Lateral reposition MTE
The lateral reposition manoeuvre is designed to expose the HQ deficiencies in the roll and heave axis during moderately aggressive manoeuvring. Whilst completing this manoeuvre, it it also possible to check the undesirable coupling between the roll and other axes. The manoeuvre starts at a stabilised hover at a point that is clearly defined by a series of visual references. A lateral acceleration is initiated and the aircraft is laterally repositioned 400 ft along the course. Upon reaching the desired end point, the pilot is required to re-stabilise the aircraft in a hover condition. The position is defined by visual references. This should be completed within the specified manoeuvre time. ADS-33(35) states that it is a moderately aggressive manoeuvre. During testing, the aggression was found to be larger than desired. For this reason, the aggression was slightly reduced by increasing the time to complete the manoeuvre. Performance requirements used during this investigation are shown in Table 9.
Lateral reposition performance requirements, modified from Ref. 35