

Introduction
Strenuous exercise increases the production of reactive oxygen species (ROS) in the body, causing an increase in oxidative stressReference Powers and Hamilton1. As oxygen consumption increases, there is the potential for the electron transport chain to become overwhelmed and electrons to leak into the mitochondrial space, where they can react with components of the cell and give rise to ROS. These ROS can damage the mitochondria and other parts of the cell, rendering the cell no-functional. Free radical damage is associated with the destruction of cell membranes and aggregation of membrane compoundsReference Matsuki, Tamura, Ono, Watari, Goitsuka, Yamanobe, Hiraga, Kubo, Takagi and Hasegawa2. The generation of ROS during exercise is probably a cause of muscular disturbances, inflammation and pain in performance animalsReference Avellini, Chiaradia and Gaiti3.
The extent of damage done by ROS to the exercising subject is unknown. Free radical damage leads to higher levels of oxidation products in blood and tissueReference Singh4. These products may lead to further damage of muscle cells as well as generation of biologically active compounds able to propagate the peroxidation chain or enter inflammatory pathwaysReference Dekkers, van Doornen and Kemper5.
Chiardia et al. Reference Chiaradia, Avellini, Rueca, Spaterna, Porciello, Antonioni and Gaiti6 reported that malondialdehyde (MDA) content increased in horses as a response to exercise. MDA is a short-chain fatty acid and is often used as an indicator of oxidative stress. In the experiment, ten stallions were trained over a period of 3 months and then underwent a series of physical exercise bouts of increasing intensity. The horses were sampled before exercise, immediately after limbering up, after the exercise bouts and 18 h after exercise. MDA content increased dramatically after strenuous exercise as compared with MDA levels during a limbering up period, suggesting that lipid peroxidation is related to the intensity of exercise. Also, the elimination of lipid peroxidation products was shown to be a slow processReference Chiaradia, Avellini, Rueca, Spaterna, Porciello, Antonioni and Gaiti6.
Matsuki et al. Reference Matsuki, Tamura, Ono, Watari, Goitsuka, Yamanobe, Hiraga, Kubo, Takagi and Hasegawa7 proposed that, in exercised horses, phospholipid hydroperoxides are the primary products of peroxidation and disrupt cellular homeostasis by activating phospholipase A. This causes an accumulation of lysophospholipids in muscle membranes. End products of peroxidation, particularly MDA, are associated with polymerization and aggregation of membrane compounds and reduction of cellular function. Exercised Thoroughbreds demonstrated that peroxidation of phosphatidylethanolamine (PE) was increased before exercise and post-exercise as compared with resting controls, and peroxidized PE showed an increasing tendency from pre-exercise to 10 min post-exercise to 24 h post-exercise. Total MDA (both free and protein bound) increased in all four horses at 10 min and 24 h post-exerciseReference Matsuki, Tamura, Ono, Watari, Goitsuka, Yamanobe, Hiraga, Kubo, Takagi and Hasegawa7. The authors concluded that muscular PE was particularly susceptible to oxidative stress due to exercise, peroxidized phospholipids were able to activate phospholipase and total MDA increased largely because of an increase in protein-bound MDA, supporting the supposition that MDA is highly reactive to proteinsReference Matsuki, Tamura, Ono, Watari, Goitsuka, Yamanobe, Hiraga, Kubo, Takagi and Hasegawa7.
There is increased interest in providing supplemental dietary antioxidants to exercising subjects to reduce free radical levels in the body and therefore reduce the damage done to the animal. However, the benefits of these supplements are controversial. The purpose of this study was to determine whether exercising horses supplemented with vitamin E above 1989 NRC recommendations had decreased measures of oxidative stress in blood parameters, both over the course of a training programme and following a single strenuous bout of exercise.
Materials and methods
Animals
Eight untrained healthy Thoroughbred geldings between the ages of 3 and 10 years were used in a complete repeated measures (crossover) design. Prior to this study, horses had been untrained for a minimum of 1 year. Untrained horses were used in order to monitor the response of the animals to supplementation as fitness level improved. All horses were maintained between body condition scores of 4.5–5.0 using the Henneke systemReference Henneke, Potter, Kreider and Yeates8. All animal procedures were conducted within the guidelines of, and approved by, the University of Florida Institutional Animal Care and Use Committee.
Diets and adaptation
Prior to being divided into treatment groups, all horses were put on the control diet for 3 weeks and familiarized with the treadmill. A control baseline SET was performed at the end of the adaptation period. Subsequently, the animals were divided into control and vitamin E-supplemented groups and acclimated to the respective diets for 7 weeks to achieve a consistent level of vitamin E in both blood and tissue. The horses on the control diet were fed a 12% crude protein textured oat-based feed at a rate of 1.25% of body weight and ad libitum coastal Bermuda grass hay. Vitamin E content of the grain was 80 IU kg DM− 1, as recommended by the NRC (1989) for horses undergoing moderate to intense levels of work9. The horses receiving vitamin E supplementation were given the same diet as the control but were supplemented with 3000 IU vitamin E day− 1 in the form of dl-α-tocopheryl acetate. This level was chosen based on a prior work demonstrating that a basal diet containing 44 IU vitamin E kg DM− 1 or 124 IU vitamin E kg DM− 1 were not sufficient to prevent decreases in plasma and muscle α-tocopherol status due to repeated exercise trainingReference Siciliano, Parker and Lawrence10. However, 344 IU vitamin E kg DM− 1 maintained vitamin E status in the blood and muscle. Supplementation of 3000 IU day− 1 placed all vitamin E-supplemented horses above 300 IU kg DM− 1 of concentrate.
The horses were fed the concentrate mixture twice daily. Once training began, the amount of concentrate fed was increased from 1.25% of body weight to 1.5% of body weight divided equally between the feedings. The treatment group received supplementation as a daily evening top dressing (68.2 g of a vitamin E premix containing 44 IU vitamin E g− 1). The premix was composed of dl-α-tocopheryl acetate mixed with a rice meal carrier. The control group received 68.2 g of a placebo (rice meal feed). In addition, all horses received ad libitum access to coastal Bermuda grass hay. The horses were housed at the University of Florida in 4 × 4 m stalls or in an adjacent dry lot turnout paddock. The use of the dry lot paddock eliminated grazing and helped control dietary intake. The horses were rotated daily in groups of four, with four being kept in stalls and four being kept in the turnout paddock. On days of blood sampling, all horses were kept in stalls beginning on the evening prior to collection to eliminate variations in temperature and climate.
Washout and crossover period
Prior to the crossover, all horses underwent a 15-week washout period during which they were turned out to pasture, fed the control diet and left untrained. The horses were then crossed over and the experiment repeated, beginning with the adaptation period to enable the horses to be used as their own control. Due to mechanical problems with the treadmill, the adaptation period for the second half of the experiment lasted 10 weeks rather than 7 weeks. During the extra 3 weeks, the horses were fed their respective diets and left untrained. Blood was collected both at the end of 7 weeks and at the end of 10 weeks of adaptation, and all analyses were run and statistically compared to ensure that there were no baseline differences between weeks 7 and 10 due to the difference in times on treatment diets. The horses followed the exercise schedule performed in the first half of the experiment.
Exercise protocols
The training and SET were conducted at the University of Florida Veterinary Medicine Teaching Hospital in a climate-controlled room equipped with a treadmill (Sato I, Sweden). The training period consisted of 8 weeks of gradually increasing workloads. Treadmill exercise was performed 3–4 days per week, depending on the availability of the treadmill. For the first 3 days, the horses trotted at 4 m s− 1 for 0.6 km on a flat surface, cantered at 8 m s− 1 for 1.0 km on a flat surface, and cooled down by trotting at 4 m s− 1 for 0.6 km on a flat surface. The gallop distance was increased by 0.5 km every 3 days so that, by the end of 3 weeks, the horses were performing the following exercise: trotting at 4 m s− 1 for 0.6 km, cantering at 8 m s− 1 for 3.0 km and trotting at 4 m s− 1 for 0.4 km, all on a flat surface. Starting on week 5, the gallop phase was performed twice a week on a flat surface and twice a week on a 6° incline for the remainder of the study. A SET was performed at the end of each 8-week conditioning period using the protocol as follows: 4 m s− 1 for 2 min on a flat surface, 8 m s− 1 for 1 min at a 6° incline, 9 m s− 1 for 1 min, 10 m s− 1 for 1 min, 11 m s− 1 for 1 min and 12 m s− 1 until they would not continue with moderate persuasion.
Tissue sampling
Baseline blood samples were taken following the 7-week adaptation period. Once training began, blood samples were taken immediately prior to and immediately following exercise at the end of weeks 2, 5 and 8. At the end of the fifth week, before exercise and after exercise, samples were taken on 2 days, one during which the horses ran on the flat and one during which the horses ran on the incline for the first time. This provided a way to compare different exercise intensity levels when horses were at the same fitness level. Following the eighth week, all horses performed a SET with blood collected immediately before and immediately after exercise. Blood was collected by jugular puncture in EDTA tubes. Whole blood was immediately pipetted from the tubes and put on ice until storage at − 80 °C. Plasma was separated and stored at − 80 °C. All blood samples were taken, and exercise training/SET performed, a minimum of 5 h following completion of concentrate meal and almost 24 h after receiving supplementation (vitamin E supplement was top dressed to evening feed following completion of exercise).
Blood analysis
Thiobarbituric acid-reactive substances analysis
Plasma samples were thawed and diluted 1:100 with deionized (DI) water. Thiobarbituric acid-reactive substance (TBARS) assay was performed as described by Armstrong et al. Reference Armstrong, Hiramitsu and Ueda11 and YagiReference Yagi12. These procedures had been previously validated for use in horse blood. Working standards were prepared from the stock standard (100 nM 1,1,3,3-tetramethoxypropane) each time the procedure was run. One hundred microlitres of sample or known amount of standard was mixed with an equal amount of 8.1% sodium dodecyl sulphate. The denatured plasma was incubated with TBA/buffer reagent (37 mM, pH 3.5) at 95°C for 60 min according to company recommendations (Zeptomatrix; Buffalo, NY, USA). The tubes were covered with glass marbles to prevent evaporation. The tubes were cooled in ice water for exactly 10 min and then allowed to reach room temperature. Reactions were quantified on a fluorescent spectrofluorometer at the following parameters: excitation of 535 nm, emission of 552 nm, high sensitivity, slit width of 5 nm. Multiple readings of each sample were taken. A standard curve was plotted and used to calculate sample values. For post-exercise blood samples, plasma proteins were analysed using a plasma refractometer. A ratio was calculated from pre-exercise plasma proteins divided by post-exercise plasma proteins. This number was multiplied by the post-exercise TBARS concentration to adjust for plasma volume. Data were reported as both adjusted and unadjusted values.
Trolox-equivalent antioxidant capacity analysis
The trolox-equivalent antioxidant capacity (TEAC) assay was run as described by MillerReference Miller13 and had been previously validated in horse blood. Prior to beginning the assay, metmyoglobin was synthesized by mixing an equal volume of 0.4 mM myoglobin and potassium ferricyanide (0.74 mM K3Fe(CN)6). Metmyoglobin reagent was applied to a Sephadex G50 column and eluted with phosphate-buffered saline (PBS). The concentration of the purified metmyoglobin was calculated using the Whitburn equation:
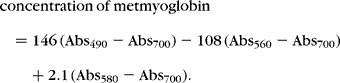
The metmyoglobin was diluted with PBS to a final concentration of 70 mM. Assay stock solutions were prepared fresh and included 5 mM 2,2-azinobis-(3-ethylbenzothiazoline-6-sulphonic acid) (ABTS reagent), 2.5 mM Trolox and 0.15% H202 in PBS. Final reactions were performed in disposable cuvettes in the presence of 1.5 mM ABTS, 250 μM metmyoglobin and 40 μl of sample. Reactions were initiated by the addition of 20 μl of H2O2. Cuvettes were inverted once and placed immediately on a spectrophotometer where they were read every 20 s for 4 min at 600 nm. Results were reported as a percentage of inhibition. Unknown value/2.5 × 100 = percentage of inhibition. TEAC concentration was adjusted by plasma protein ratio for post-exercise samples as described in the above section. Data are reported both as adjusted and unadjusted values.
Glutathione (reduced, oxidized and total) analysis
All glutathione assays were run as described by Browne and ArmstrongReference Browne and Armstrong14 and had been previously validated for horse blood. Whole blood was diluted ten fold with DI water and mixed with an equal volume of meta-phosphoric acid (MPA) precipitating reagent (2 mM MPA, 5 M NaCl, 7 mM EDTA). The sample/extraction solution was centrifuged at 800 × g for 15 min, and the supernatant was saved and frozen at − 80°C. The extracted samples were diluted 1:20 with respective buffers. For reduced glutathione assays, 100 μl of the extracted, diluted samples was added to 2.0 ml gultathione buffer (100 mM NaPO4, 4 mM EDTA, pH 8.0). Subsequently, 100 μl of 0.1% o-phthaldialdehyde (OPT) in methanol (protected from light) was added to the tubes and incubated at room temperature for at least 17 min. Fluorescence was measured at emission 420 nm, excitation 350 nm, with high sensitivity and slit width of 5 nm. Results were reported in mg dl− 1/%RBC. For total glutathione, the same procedure was followed except that the extracted, diluted sample was dissolved in 2.0 ml of glutathione disulphide (GSSG) buffer (100 mM NaOH) and allowed to incubate at room temperature prior to addition of OPT. Oxidized glutathione was determined by calculation: (total glutathione − reduced glutathione = oxidized glutathione).
Vitamin E analysis
Vitamin E was analysed in plasma samples at the initial date (following the adaptation period but prior to the beginning of any exercise) and on week 8 pre-exercise (Michigan State University Diagnostic Center for Population and Animal Health; East Lansing, MI, USA). Vitamin E was extracted from the plasma and analysed by high-performance liquid chromatography (HPLC).
Statistical analysis
The blood data for vitamin E, TBARS, oxidized, reduced and total glutathione, as well as percentage of reduced glutathione and TEAC, were analysed by ANOVA with repeated measures over time according to treatments. The regression relationship between each of the blood parameters and time was generated for each treatment group over the total sampling times. Analyses were performed with SAS version 6.12 (SAS Inc., Chicago, IL, USA) using proc GLM for the ANOVA and proc mixed for the ANOVA for measures repeated over time. All analyses with P < 0.05 were considered statistically significant.
Results
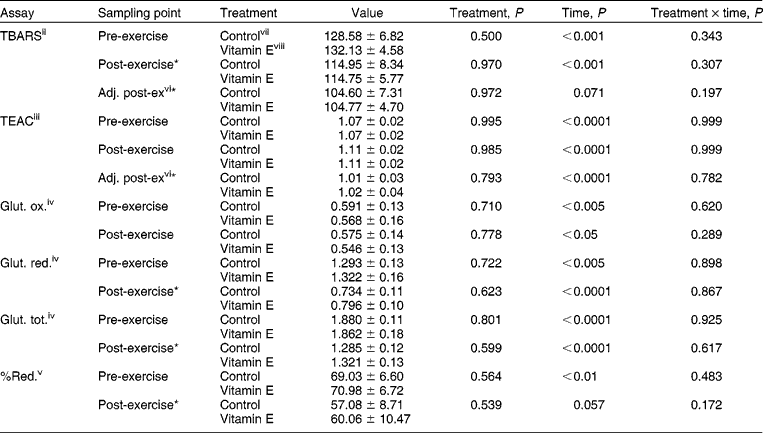
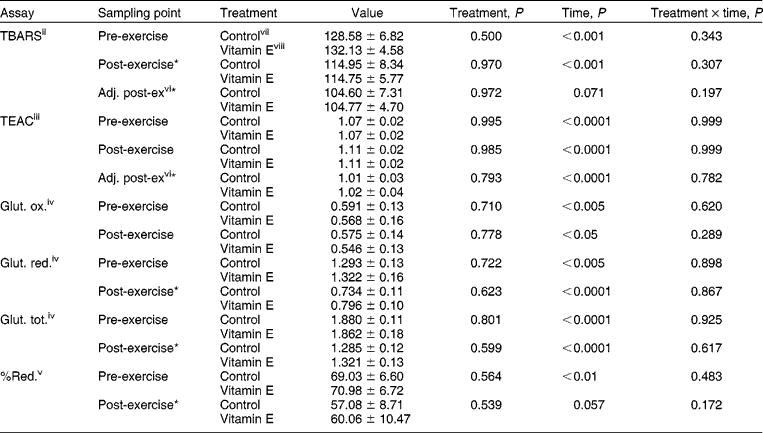
No differences in plasma vitamin E between control and vitamin E-supplemented horses were observed at any time. Vitamin E supplementation did not result in a treatment effect in TBARS, TEAC or glutathione indices measured. However, there was a significant time effect in all of these measures indicating that these variables changed in some manner over the 8-week training period. Table 1 summarizes data collected pre- and post-exercise over the 8-week training period.
Treatment and time effects on plasma variables in control and vitamin E-supplemented exercised horses over the course of an 8-week training periodi
*Post-values of this variable are significantly lower (P < 0.05) than pre-samples.
i Values are reported as means ± SEM.
ii Thiobarbituric acid-reactive substances: values are reported in mmol l− 1.
iii Trolox-equivalent antioxidant capacity: values are reported in arbitrary TEAC units.
iv Glut. ox., Glut. red., Glut. tot. indicate oxidized glutathione, reduced glutathione and total glutathione, respectively; values are reported in mgdl− 1%rbc− 1.
v %Red. indicates the percentage of glutathione existing in the reduced form.
vi Post-exercise values were adjusted for plasma volume by total plasma protein ratio.
vii Concentrate provided 80 IU vitamin E kg DM− 1.
viii Concentrate provided 80 IU vitamin E kg DM− 1 + 3000 IU supplemental vitamin E.
Thiobarbituric acid-reactive substance
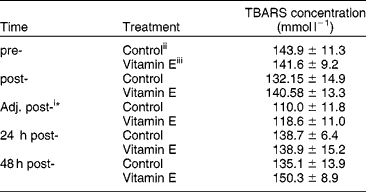
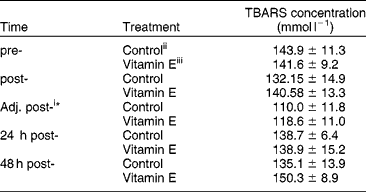
Upon closer examination, the TBARS concentrations remained relatively constant throughout the feeding trial in both control and vitamin E-supplemented horses. A decline in plasma TBARS concentration at week 8 was observed for both groups of horses in the pre-exercise samples. This resulted in the significant time effect. The cause of this reduction is unknown but may reflect a sampling error. When pre- and post-samples taken during the training period were analysed, plasma TBARS concentrations remained unaffected by treatment. The concentration of TBARS (both when adjusted for plasma volume using a plasma protein ratio or left unadjusted) was, however, lower post-exercise as compared with pre-exercise for both control and vitamin E-supplemented horses (P < 0.0001). The effect of vitamin E supplementation on lipid peroxidation was examined following a SET (Table 2). Post-exercise samples showed a decrease in TBARS content in both control and vitamin E-supplemented horses. These values returned to baseline within 24 h and remained unchanged at 48 h. No differences between control and vitamin E-supplemented horses were observed at any time point.
Effect of vitamin E supplementation on plasma thiobarbituric acid-reactive substances (TBARS) concentration in horses following strenuous exercise (SET)
*Values are lower than pre-exercise values, P < 0.05.
i Post-exercise values were adjusted for plasma volume by total plasma protein ratio.
ii Concentrate provided 80 IU vitamin E kg DM− 1.
iii Concentrate provided 80 IU vitamin E kg DM− 1+3000 IU supplemental vitamin E.
Trolox-equivalent antioxidant capacity
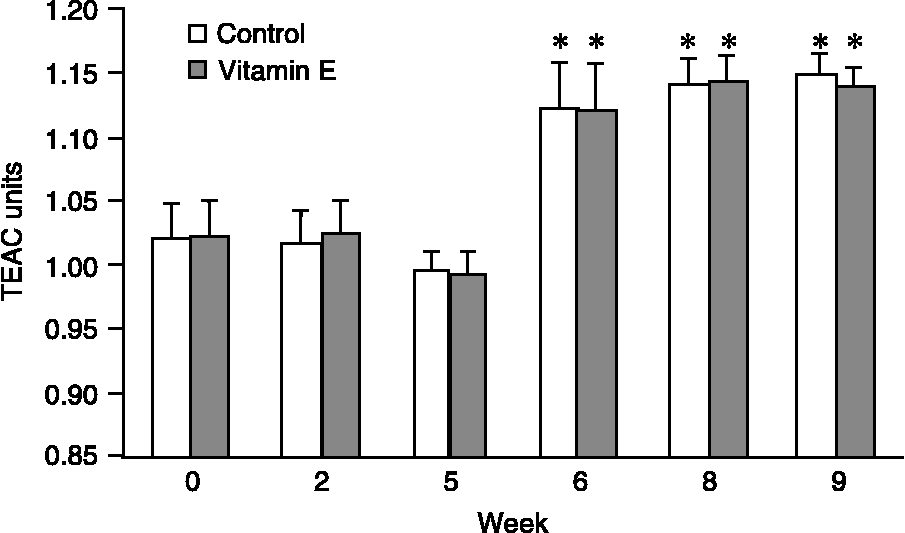
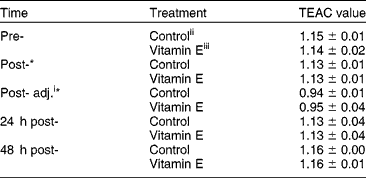
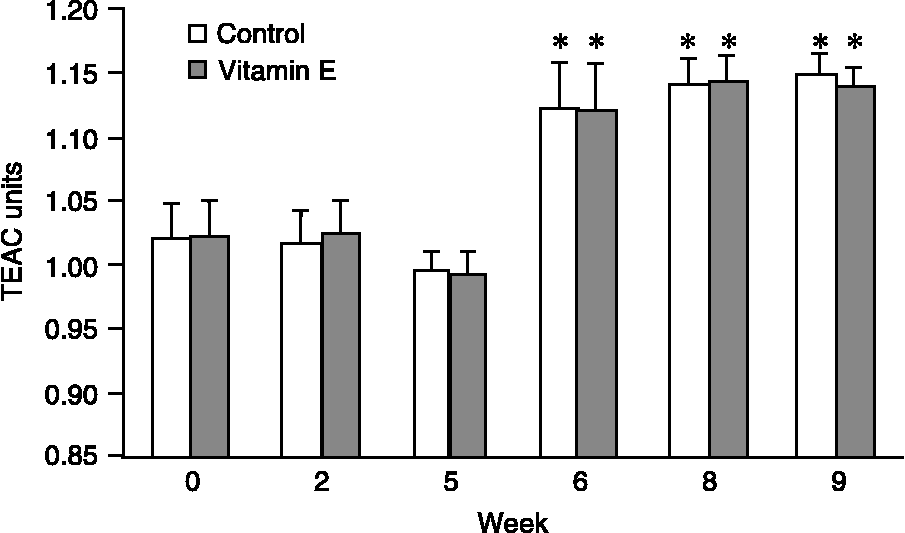
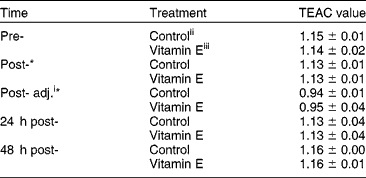
There were no significant differences in TEAC values between treatment groups in pre- and post-exercise samples collected during the training phase. However, the pre-exercise TEAC values increased in both control and vitamin E-supplemented horses after 5 weeks of moderate exercise and remained higher throughout the rest of the study (P < 0.05; Fig. 1). Post-exercise samples when adjusted for plasma volume were again lower (P < 0.001) than pre-exercise samples. Moderate exercise performed during the training phase resulted in unadjusted post-exercise TEAC values being slightly elevated as compared with pre-exercise samples (Table 1). However, following a SET, the post- and adjusted post-TEAC values were lower than pre-exercise values (P < 0.05) but returned to baseline values by 48 h post-exercise (Table 3). No significant differences were found in TEAC values between treated and control horses following the SET (Table 3).
Trolox equivalent antioxidant capacity (TEAC) values for pre-exercise samples show no difference between control and vitamin E-supplemented horses but increase with improved fitness. TEAC values are reported in arbitrary TEAC units and increase over time in horses undergoing an exercise training programme. * Indicates significantly different time points as compared with week 0 (P < 0.05)
Plasma Trolox-equivalent antioxidant capacity (TEAC) concentrations before and after strenuous exercise
*Values are lower than pre-exercise values, P < 0.05.
i Post-exercise values were adjusted for plasma volume by total plasma protein ratio.
ii Concentrate provided 80 IU vitamin E kg DM− 1.
iii Concentrate provided 80 IU vitamin E kg DM− 1+3000 IU supplemental vitamin E.
Glutathione
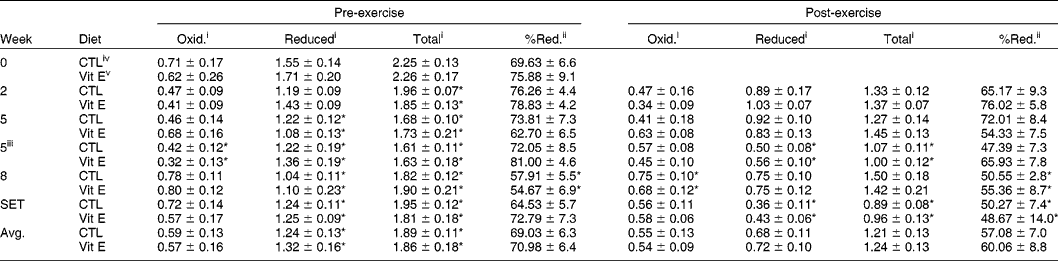
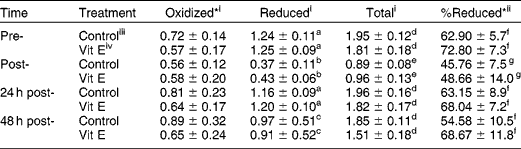
Vitamin E supplementation did not significantly affect oxidized, reduced or total glutathione levels of horses during the training period (Table 4). However, vitamin E did cause a significant elevation in the percentage of reduced glutathione in response to the SET as compared with the control diet (P < 0.006; Table 5). This effect is attributed to lower plasma oxidized glutathione levels in vitamin E-treated horses (P < 0.03).
Effect of vitamin E supplementation on glutathione levels (mg dl−1/%RBC) in horses undergoing moderate exercise (means and SEMs reported)
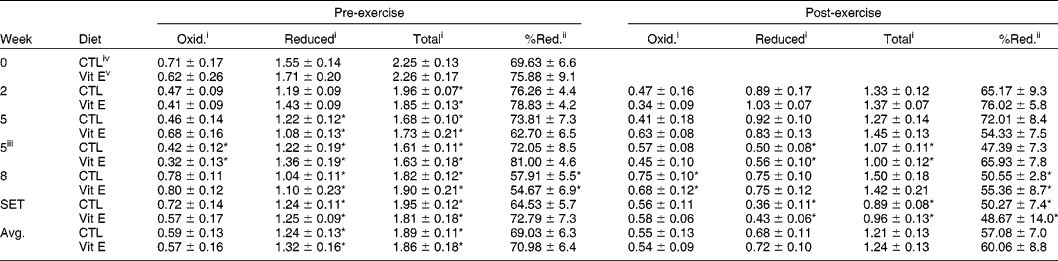
CTL, control. *Significant differences in time points (P < 0.05) as compared with time 0 (pre-exercise) or time 2 (post-exercise).
i Values are reported in mg.dl− 1.%rbc− 1.
ii Values are calculated as a percentage of total glutathione existing in the reduced form.
iii Horses were trained on a 6° incline.
iv Concentrate provided 80 IU vitamin E kg DM− 1.
v Concentrate provided 80 IU vitamin E kg DM− 1+3000 IU supplemental vitamin E.
Effect of vitamin E supplementation on glutathione measures taken at time points during a standard exercise test (means and SEMs reported)
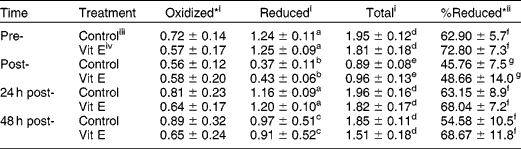
*Significant differences exist between treatments over time points, P < 0.05. a,b,c,d,e,f,g Means within a column lacking a common superscript differ, P < 0.05.
i Values are reported in mg dl− 1 %rbc− 1.
ii Values were calculated as a percentage of total glutathione existing in the reduced form.
iii Concentrate provided 80 IU vitamin E kg DM− 1.
iv Concentrate provided 80 IU vitamin E kg DM− 1+3000 IU supplemental vitamin E.
Reduced and total glutathione decreased in pre-exercise blood samples after 2 weeks of exercise training (P < 0.05; Table 4). This decrease persisted throughout the remainder of the study. Exercise also caused an immediate drop in reduced, total and percentage of reduced glutathione, with post-exercise values being lower than pre-exercise values (P < 0.01). Exercise did not affect oxidized glutathione concentrations. The SET resulted in post-exercise values for reduced, total and percentage of reduced glutathione being lower than pre-exercise values (P < 0.01; Table 5). Oxidized glutathione again was not affected by exercise. Similarly, at week 5 of the training phase when the horses underwent a more rigorous form of exercise (exercise on a 6° incline as opposed to flat), post-exercise concentrations of reduced and total glutathione were lower as compared with week 2 values (P < 0.01). This was also the case for SET data.
Discussion
Vitamin E supplementation did not increase circulating levels of the nutrient. Vitamin E was fed to horses at a concentration approximately three fold higher than the 1989 NRC recommended level for horses in moderate to intense training (80 IU kg DM− 1). Blood samples were monitored for circulating vitamin E content at the beginning and end of the 8-week training period. No differences in plasma vitamin E between control and vitamin E-supplemented horses were observed. Vitamin E is primarily stored in adipose, muscle and liver tissue. Circulating vitamin E reaches a saturation point and can only be increased at most three to four fold by supplementationReference Blatt, Leonard and Traber15. Humans given 100 IU α-tocopherol/kg body weight (for an average of 5–7 g total) showed increased plasma values of α-tocopherol approximately four fold above baseline at 6 h, which decreased to three fold above baseline at 24 h. Possible reasons for the inability to raise plasma levels higher include: (i) decreasing efficiency of intestinal absorption, (ii) saturation of tocopherol transfer protein (TTP) that limits hepatic α-tocopherol metabolism and (iii) redistribution of plasma α-tocopherol into tissue (particularly adipose tissue)Reference Blatt, Leonard and Traber15. Blatt et al. Reference Blatt, Leonard and Traber15 compared the distribution of vitamin E from the blood into other tissue compartments to perfusion of fat-soluble drugs. Tissues were subdivided into rapidly perfused central compartments (heart, lungs, brain, kidney, liver), slowly perfused peripheral compartments (other organs, muscle, skin) and very slowly perfused compartments (adipose tissue). Vitamin E concentrations in rats reach equilibrium more quickly in blood and tissue, which are rapidly perfused and have lower lipid content and greater tocopherol regulatory protein (TRP) function. However, this rate of equilibrium is not representative of the tissues' final concentration due to tissue redistribution. Redistribution to adipose tissue is thought to be significant, since approximately 90% of the body's total vitamin E is in adipose tissue. The final equilibrium concentration of vitamin E in tissues probably depends on TRP functions, tissue lipid content, vitamin E uptake and efflux, oxidative stress, vitamin E metabolism and interactions between vitamin E and other antioxidantsReference Blatt, Leonard and Traber15. Therefore, it is possible that our control horses were at a sufficient level of supplementation such that additional vitamin E could not further elevate plasma levels, but this is not necessarily representative of tissue levels of vitamin E in the two groups.
When examining oxidative stress measures, vitamin E supplementation did not appear to alter lipid oxidation levels in this study. Plasma TBARS is a measure of lipid peroxidation in the body. The TBARS assay primarily measures MDA, a short-chain fat group that is formed from damaged cell membranes. It has been criticized in previous studies for assay variability and its reflection of other parameters in the body independent of oxidative stress. In this study, there was no significant difference between treatment and control groups at any sample point over the training period.
The concentration of TBARS when adjusted for plasma volume using a plasma protein ratio was, however, lower post-exercise as compared with pre-exercise for both control and vitamin E-supplemented horses during both the training phase and SET. This was an unexpected finding and it is possible that this is due to increased clearance in the body directly after exercise. MDA was observed to have a short half-life and is therefore cleared quickly from the bodyReference Siu and Draper16. It is also possible that a longer duration of exercise yields greater TBARS concentrations. It has been shown that horses undergoing endurance exercise (140 km race) have elevated levels of TBARS post-exercise, and these concentrations remain elevated 16 h post-exerciseReference Marlin, Fenn, Smith, Deaton, Roberts, Harris, Dunster and Kelly17. Possibly an increase in TBARS concentrations is more common in low-intensity but long-duration exercise that relies more on free fatty acids as an energy source as opposed to the sprint-type training that our animals performed. It is also possible that the adjustment for plasma volume using plasma proteins was not appropriate. Van Beaumont et al. Reference Van Beaumont, Strand, Petrofsky, Hipskind and Greenleaf18 in 1973 concluded that there may be a net loss of plasma proteins as a result of exercise, and thus plasma protein concentration may not be a reliable way to adjust for plasma volume. Contrary to this, a more recent study by Lindinger and colleagues showed that total plasma proteins in exercising horses are directly correlated to plasma volumeReference Lindinger, McCutcheon, Ecker and Geor19. Plasma concentration of TBARS was lower (P < 0.05) post-SET as compared with pre-exercise concentrations when adjusted for plasma volume, but not when left unadjusted. However, during the training phase, both unadjusted concentrations and adjusted concentrations were significantly lower post-exercise when compared with pre-exercise concentrations.
Plasma antioxidant capacity as measured by TEAC was unaffected by vitamin E supplementation. Exercise did, however, cause antioxidant status of the blood to decrease. Post-exercise TEAC values were lower than pre-exercise TEAC values for both the control and treatment groups when values were adjusted for plasma volume. Immediately upon completion of the SET, TEAC values were low in both control and supplemented animals (P < 0.05). These values returned to baseline within 24 h and remained constant at 48 h.
An interesting finding is that the moderate exercise performed during the training phase resulted in unadjusted post-exercise TEAC values being slightly elevated as compared with pre-exercise samples. This is potentially due to mild exercise causing an activation of the body's antioxidant system. However, following the SET, the TEAC values were significantly lower than pre-exercise values but returned to resting levels by 24 h post-exercise. This possibly indicates that strenuous exercise taxes the antioxidant system enough to decrease its radical scavenging abilities. A study on similarly exercised horses showed that horses exercising at 8 m s− 1 on a 6° incline (similar to our highest-intensity training exercise) had an oxygen consumption of 63 ml min− 1 kg− 1, whereas horses running at 12 m s− 1 on a 6° incline (maximum effort in our SET prior to fatigue) had an oxygen consumption of 150 ml min− 1 kg− Reference Kavazis, Kivipelto, Choe, Colahan and Ott20. Therefore, oxygen consumption increased dramatically between our training exercise and SET exercise, and this possibly explains the horses having a different response post-training exercise versus post-SET exercise. Therefore, intensity of exercise must be taken into account when examining the antioxidant capacity of exercising subjects.
Furthermore, training was shown to increase the antioxidant capacity of the animals regardless of treatment group (P < 0.05). Following 5 weeks of training, horses had significantly elevated TEAC values pre-exercise as compared with week 0 (initial value). This indicates that fitness level must be taken into consideration when comparing antioxidant capacities of exercising subjects. Our results are supported by another study using exercising horses, which showed significant increases in citrate synthase activity in the middle gluteus muscle following an intense exercise regime (27% higher activity after week 1 and 42% higher after week 2). This was accompanied by an increase in capillary density following 5 weeks of trainingReference Essen-Gustavsson, McMiken, Karlstrom, Lindholm, Persson and Thornton21. Therefore, training is shown to cause adaptations that may improve the antioxidant status of the exercising subject.
In this study, glutathione analyses lend the most support to the theory of supplementing additional vitamin E to exercising horses to reduce oxidative stress. Glutathione participates in the body's antioxidant defence by serving as a sink for electrons during the reduction of hydrogen peroxide to water. More glutathione in the reduced form may allow for efficient quenching of newly formed free radicals. Intracellular glutathione rapidly oxidizes to GSSG in the presence of hydrogen peroxide and hydroperoxides, but rapidly reduces back to glutathione if oxidative stress is not severeReference Sastre, Asensi, Gasco, Pallardo, Ferrero, Furukawa and Vina22. Therefore, high levels and percentages of reduced glutathione are indicative of improved antioxidant potential. Total, reduced and oxidized glutathione were measured in the blood of horses fed control and excess vitamin E and maintained on a moderate exercise regime. Vitamin E supplementation did not appear to affect oxidized, reduced or total glutathione status in the blood of moderately exercising horses, nor did it affect the percentage of total glutathione that was in the reduced form. Vitamin E-supplemented horses did, however, have a significant elevation of percentage of reduced glutathione in response to the SET as compared with the control diet, due to lower plasma oxidized glutathione levels in vitamin E-treated horses. These results suggest that vitamin E may enhance or spare the glutathione redox system, particularly during intense exercise.
Exercise training also influenced glutathione parameters. Reduced and total glutathione decreased in pre-exercise blood samples after 2 weeks of exercise training and stayed lower throughout the remainder of the study. The drop in reduced and total glutathione during week 5 (first run on the incline) and the drop in reduced, total and percentage of reduced glutathione following the SET indicate that strenuous exercise caused the horses to utilize their reduced glutathione stores to a greater extent as compared with milder exercise. Marlin et al. Reference Marlin, Fenn, Smith, Deaton, Roberts, Harris, Dunster and Kelly17 found a similar trend in endurance horses. When blood was collected from 40 competitive endurance horses both before and after a 140 km race, all glutathione measures (reduced, total and oxidized) decreased significantly post-exercise. The results of the present study agree with their findings.
Implications
When all of our results are taken together, this study clearly supports the premise that training enhances the antioxidant status of the animal, and therefore future studies trying to compare antioxidant supplementation benefits should take into consideration the fitness level and expected workload of the subjects. From analysing the data collected in this study, it appears that vitamin E may have an effect on the body's ability to handle oxidative stress. Blood glutathione data showed favourable effects of vitamin E supplementation. It is possible that training somewhat mutes many of the effects of antioxidant supplementation, simply because increasing fitness will increase the natural antioxidant capacity of the body, as shown by our TEAC data. However, a single strenuous bout of exercise, such as our SET, is sufficient to show the beneficial effects of vitamin E supplementation on glutathione parameters measured.