I. INTRODUCTION
As one of the most efficient portable energy storage systems at the moment, rechargeable lithium-ion batteries based on electrochemical intercalation materials are crucial to realize electric vehicles which are able to reduce the CO2 emissions by petroleum-fueled internal combustion engine vehicles.Reference Tarascon and Armand1 To meet the challenging requirements, extensive research has been underway on cathode materials since they are the bottleneck, hindering improvements with regard to energy density, cell voltage, capacity, cyclic performance, lifetime, etc.Reference Whittingham2–Reference Goodenough4 Olivine-structured LiMPO4 (M = Fe, Mn, Co, and Ni) with a theoretical specific capacity of around 170 mAh g−1 has recently attracted increasing interest as a promising cathode material for rechargeable lithium-ion batteries due to as well low cost as safety benefits.Reference Padhi, Nanjundaswamy and Goodenough5–Reference Wolfenstine and Allen8 However, the electrochemical performance of pristine phosphates still needs to be improved, even though there has been huge progress in the case of LiFePO4.Reference Padhi, Nanjundaswamy and Goodenough5 Here, poor rate capabilities caused by low electrical conductivity and low ionic diffusivity have been overcome by nanosizing and carbon coating.Reference Huang, Yin and Nazar9,Reference Zane, Carewska, Scaccia, Cardellini and Prosini10 In contrast, the other olivine-structured materials with a single transition metal ion (M = Mn, Co, and Ni) have not reached commercial applicability so far. For example, there are severe issues of capacity fading for LiMnPO4 because of the Jahn–Teller effect of Mn3+ ions.Reference Yamada, Hosoya, Chung, Kudo, Kinokuma, Liu and Nishi6,Reference Yonemura, Yamada, Takei, Sonoyama and Kanno11,Reference Rudisch, Grafe, Geck, Partzsch, Zimmermann, Wizent, Klingeler and Büchner12 Besides other issues, the commonly used electrolytes are instable at the high operating voltages of LiCoPO4 and LiNiPO4 versus lithium.Reference Li, Jin, Wei, Zhou and Yan13–Reference Xu15 More recently, solid solutions of multicomponent olivine-structured phosphates are getting more and more attention due to their enhanced energy density or increased rate capability compared to their single component counterpart. The LiFe1−xMnxPO4 system has been studied from the beginning as a route to exploit the higher potential of the Mn2+/Mn3+ couple versus lithium compared to Fe2+/Fe3+.Reference Padhi, Nanjundaswamy and Goodenough5,Reference Yamada, Takei, Koizumi, Sonoyama and Kanno16,Reference Yamada, Kudo and Liu17 The synthesis and extensive investigation of LiFe1/3Mn1/3Co1/3PO4 (LFMC) have been recently done by several groupsReference Chen, Vacchio, Wang, Chernova, Zavalij and Whittingham18–Reference Chen, Chen, Hsu, Lee, Lin, Yeh and Shih21 and the results imply that the electrochemical performance is strongly affected by the synthesis conditions and synthesis methods. In this study, we report on the synthesis of LiFe1/3Mn1/3Co1/3PO4 by a microwave-assisted hydrothermal method and study the resulting morphologies upon systematic variation of the pH value and the transition-metal-ion concentration (C M) in the reactant. Hydrothermal technology is a suitable tool to meet the requirements of a size- and shape-controlled synthesis for battery materials.Reference Yoshimura and Byrappa22 In case of the olivine-type phosphates, it has been utilized since the pioneering work in the group of Whittingham et al.Reference Yang, Zavalij and Whittingham23 to synthesize a broad range of mixed transition metal compoundsReference Chen, Wang and Whittingham24 and to manipulate the particle morphology by changing the synthesis parameters, in particular the pH value.Reference Delacourt, Poizot, Morcrette, Tarascon and Masquelier25–Reference Huang, Yan, Zhao, Zhang, Guo, Chang, Kong and Han31 The microwave-assisted approach accelerates the crystallization kinetics, shortens the reaction time, and improves the efficiency of the techniqueReference Bilecka and Niederberger32 and it has successfully been applied for all LiMPO4 (M = Fe, Mn, Co, Ni) materials.Reference Manthiram, Murugan, Sarkar and Muraliganth33,Reference Murugan, Muraliganth, Ferreira and Manthiram34
Our systematic investigations of the synthesis products depending on the initial pH value and transition metal ion concentration of the reactant show that two evolutionary routes coexist during the crystal growth and compete with each other after the nuclei have been stably formed. The morphologies of the products are determined by the interplay of these two competing routes. In addition, the morphology is quantitatively analyzed by means of first principles methods, using the Hartman–Perdok approach. A crystalline and agglomeration phase diagram is constructed. Furthermore, the magnetic and electrochemical properties are reported.
II. EXPERIMENTAL AND THEORETICAL METHODS
LFMC has been hydrothermally synthesized by means of a microwave-assisted approach. Firstly, LiCH3CO2•2H2O, Fe(CH3CO2)2, Mn(CH3CO2)2•4H2O, Co(CH3CO2)2•4H2O, and (NH4)2HPO4 were dissolved in deionized water under stirring in an off-stoichiometric ratio of 9:1:1:1:3 with respect to the ratio of Li, Fe, Mn, Co, and P. All chemicals were analytically pure and were used directly without purification. The concentration of the transition metal ions (C M) in the solution was adjusted to a value between 0.03 and 0.12 mol/L. Then, either diluted ammonia or acetic acid (100%) was separately added drop-wise under stirring to adjust the pH value of the solution, starting around 6, in the range from 5 to 11. 15 mL of the solution was transferred into a 30 mL quartz vial of the microwave furnace (Anton Paar Monowave 300). The reaction temperature of 220 °C was reached within a ramping time of 10 min and kept for 20 min before the sample was cooled down below 55 °C. The gained precipitate was rinsed six times with distilled water and ethanol, respectively, to remove residual precursors and solvents. The resulting powder was dried in air at 70 °C for 24 h under ambient pressure.
The products were studied by x-ray powder diffraction by means of a Siemens D500 (Germany), utilizing Cu Kα1 and Cu Kα2 radiation (λ1/2 = 1.54056/1.54433 Å). The diffraction patterns were taken in the range from 10 to 80° with a step size of 0.02° and an integration time of 1 s per step. The morphology of the products was determined with a Zeiss LEO 1530 scanning electron microscope (SEM; Germany). The temperature dependence of the static magnetic susceptibility χ = M/B was measured after cooling in zero magnetic field (ZFC) in an applied external magnetic field of B = 0.5 T from 2 to 350 K by means of a Quantum Design MPMS XL5 SQUID magnetometer.
For electrochemical studies, the electrode material has been prepared from a slurry of 75 wt% pristine powder, 20 wt% carbon black (Timcal), and 5 wt% polyvinylidenfluoride (PVDF) binder (Solvay Plastics) with 1-methyl-2-pyrrolidone (NMP) as a solvent (Sigma–Aldrich) (see Ref. Reference Jähne, Neef, Koo, Meyer and Klingeler35). The slurry was pasted on an Al-mesh (diameter ∼10 mm), dried for 24 h at 70 °C in a vacuum oven, and pressed. The cells were assembled inside a glove box under argon atmosphere (O2/H2O < 2 ppm). The positive LFMC electrode was separated by two pieces of Whatman borosilicate glass fiber from the negative electrode which consisted of a metallic lithium disk on a nickel current collector (diameter ∼8 mm). As electrolyte, a 1 M LiPF6 salt solution in a 1:1 mixture of ethylene carbonate (EC) and dimethyl carbonate (DMC) was used. Cyclic voltammetry (CV) measurements were carried out by using a VMP3 multichannel potentiostat (Bio-Logic) in a climate chamber at 298 K. The scan rate was fixed at 0.1 mV s−1 in the voltage range from 2.60 to 5.25 V.
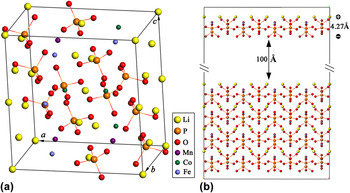
To study the growth process and the morphology in detail, the attachment energies and slice energies of different growth layers with thickness d hkl have been calculated based on density-functional theory with the SIESTA implementation.Reference Payne, Teter, Allan, Arias and Joannopoulos36 The total energy ultrasoft pseudopotentialReference Vanderbilt37 method was used. The cutoff energy of the plane-wave basis function was set to be 400 eV, yielding a convergence for the total energy of better than 0.01 eV/atom. All energy calculations were carried out as described in detail in Ref. Reference Wang, Fang, Zhang, Liu, Boughton, Wang and Zhao38 with the generalized-gradient approximation (GGA) using the Perdew–Burke–Ernzerhof modelReference Perdew, Burke and Ernzerhof39 for electron exchange and correlation. Based on an experimental LiFePO4 structure (ICSD-161479), we have constructed a repeated supercell containing 84 atoms (12 LiFePO4 f.u.) with lattice vectors A = a i, B = (b j + c k), and C = (−b j + 2c k), where a = 10.307 Å, b = 5.989 Å, and c = 4.700 Å are the lattice constants of the conventional unit cell of LiFePO4. The supercell was used to define the positions for the well mixed Fe2+, Mn2+, and Co2+ ions in LFMC [Fig. 1(a)]. For the attachment energy calculations, we took the {101} slice as an example. Firstly, a slab consisting of five growth slices was constructed and then the top {101} slice with the interplanar distance d hkl = 4.276 Å was shifted to 100 Å away from the slab surface to eliminate the interaction between the slab and the slice [Fig. 1(b)]. Lattice energies of the slab and the separated slice were calculated based on this model, and then the attachment energies,Reference Majchrowski, Borowiec and Michalski40 defined as the energy released on attachment of a growth slice to a growing crystal surface, have been deduced.
(a) LFMC supercell, and (b) slab consisting of four growth slices and one separated slice.

III. RESULTS AND DISCUSSION
A. Structure and morphology analysis
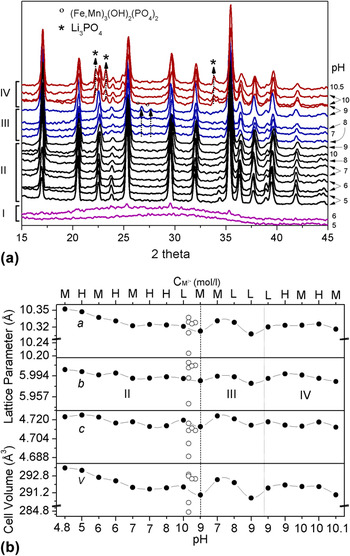
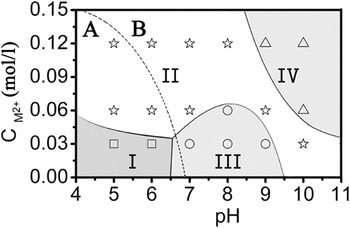
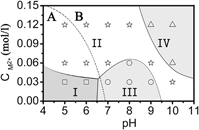
Figure 2(a) shows the x-ray diffraction (XRD) patterns of the as-prepared products synthesized at different pH and C M values. Except for two samples, made at C M = 0.03 mol/L and pH 5 and 6, all materials are crystalline and the main peaks in the XRD patterns can be assigned to olivine-structured LFMC with space group Pnma. The synthesized materials can be merged into four groups (see regimes I–IV at the left ordinate in Fig. 2) and a crystalline phase diagram (see Fig. 3) can be deduced with respect to the corresponding pH and C M values. The four groups are: regime I with noncrystalline material [marked with squares in Fig. 2(a)], regime II exhibiting pure LFMC (stars), region III where LFMC appears with (Fe,Mn)3(OH)2(PO4)2 impurities (circles), and region IV comprising LFMC with Li3PO4 impurities (triangles). The synthesis phase diagram shows that the pH value and precursor concentration are fundamental parameters for the microwave-assisted hydrothermal synthesis of LFMC. At a low transition metal precursor concentration of C M = 0.03 mol/L and pH ≤ 6.5 (region I), amorphous material is the main constituent of the as-prepared product. Increasing the pH value in the regime 6.5 < pH < 9.5 at fixed C M = 0.03 mol/L yields crystalline LFMC with however (Fe,Mn)3(OH)2(PO4)2 impurities (region II), which disappear upon further increase of pH, i.e., at pH ≥ 10. The crucial effect of precursor concentration is evident as well: At pH ≥ 10 and C M ≥ 0.06 mol/L, Li3PO4 appears in addition to the main phase LFMC. Note, that the promotion of a Li3PO4 impurity phase at high pH values has also been observed for the synthesis of LiMnPO4 in Ref. Reference Chen, Chen, Hsu, Lee, Lin, Yeh and Shih21. Finally, there is an extended region (II), where phase pure synthesis of LFMC is observed, roughly ranging from top-left (low pH, high C M) to bottom-right (high pH, low C M) in Fig. 3.
(a) XRD patterns of the as-prepared LFMC samples. Left: regimes I–IV (see the text and Fig. 3), right: pH-values at which the synthesis was done, (b) comparison of the lattice parameters and unit cell volumes of our samples made at different pH and C M values (solid circles) with literature data (open circles, see the text). Synthesis regions with pure LFMC (II), LFMC with (Fe,Mn)3(OH)2(PO4)2 impurities (III), and LFMC with Li3PO4 impurities (IV) are separated by the two dashed lines.

Crystalline and agglomeration phase diagram with respect to the pH and C M values. I: noncrystalline phase marked with squares, II: pure LFMC marked with stars, III: LFMC with (Fe,Mn)3(OH)2(PO4)2 impurities marked with circles, and IV: LFMC with Li3PO4 impurities marked with triangles. The dominating continuous single crystal growth route (labeled A) and the agglomeration route (labeled B) are separated by the two dashed lines.

The lattice parameters of all crystalline samples are refined by the GSAS programReference Larson and Dreele41 [see Fig. 2(b)] and compared to the previous reported results [marked with open circles in Fig. 2(b)]. The average lattice parameters of our samples are a = 10.331 Å, b = 5.993 Å, and c = 4.723 Å, which results in V = 292.45 Å3. These values are in good agreement with Ref. Reference Chen, Vacchio, Wang, Chernova, Zavalij and Whittingham18 (a = 10.337 Å, b = 6.008 Å, c = 4.717 Å, V = 292.95 Å3), Ref. Reference Chen, Chen, Hsu, Lee, Lin, Yeh and Shih21 (a = 10.329 Å, b = 6.017 Å, c = 4.711 Å, V = 292.79 Å3), Ref. Reference Zhang, Sun and Zhou20 (a = 10.328 Å, b = 6.012 Å, c = 4.711 Å, V = 292.54 Å3), and Ref. Reference Park, Kim, Gwon, Seo, Kim and Kang42 (a = 10.326 Å, b = 6.011 Å, c = 4.713 Å, V = 292.53 Å3), but larger than those reported in Ref. Reference Wang, Yu, Li, Yang, Mcbreen and Huang43 (a = 10.208 Å, b = 5.945 Å, c = 4.689 Å, V = 284.64 Å3) and Ref. Reference Gwon, Seo, Kim, Kim and Kang19 (a = 10.310 Å, b = 5.990 Å, c = 4.701 Å, V = 290.26 Å3). The lattice parameters of our samples are comparable to the average lattice parameters (a = 10.338 Å, b = 6.009 Å, c = 4.718 Å, V = 293.10 Å3) Ref. Reference Chen, Vacchio, Wang, Chernova, Zavalij and Whittingham18 of the end members LiFePO4, LiMnPO4, and LiCoPO4, which is an indication of complete solubility of the ions Fe, Mn, and Co. We find that the lattice parameters and unit cell volume of the pure LFMC [see region II in Fig. 2(b)] are a function of the synthesis pH values, decreasing with increasing pH from 4 to 7, then increasing from 7 to 10. While there are clear effects on the lattice parameters in the impurity region III, and the effects in region IV with Li3PO4 impurities are negligible. We also note that the synthesis C M values have no clear effect on the lattice parameters. Manthiram et al.,Reference Manthiram, Murugan, Sarkar and Muraliganth33 Chen et al.,Reference Chen, Vacchio, Wang, Chernova, Zavalij and Whittingham18 and Younesi et al.Reference Younesi, Malmgren, Edström and Tan44 have shown that the materials synthesized by low temperature processes as sol–gel or hydrothermal reactions show better electrochemical performance after high temperature annealing, indicating that there are possibly defects in these materials prior to annealing. Therefore, we assume that the lattice parameters of our samples might be reverted to the normal values and the electrochemistry performance could be improved after additional thermal treatment.
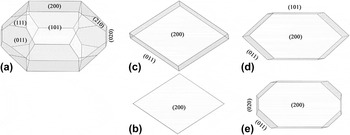
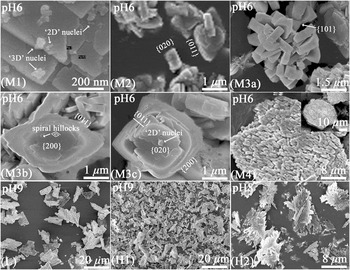
To assess the growth mechanism and to draw conclusions regarding the relation of synthesis conditions to shape and morphology of the products, the morphology of the olivine-structured LFMC crystals is quantitatively analyzed from first principle calculations, using the Hartman–Perdok approach.Reference Hartman and Perdok45 In general, the external morphology of a crystal is determined by its internal crystal structure, by the growth conditions, and by the potential presence of impurities. Based on the work of Bravais, Friedel, Donnay, and Harker (BFDH), predictions of the morphology of grown crystals can be made by considering the respective geometry of the crystal lattice.Reference Docherty, Clydesdale, Roberts and Bennema46 For such simulation, it is supposed that the larger the interplanar distance d hkl of a crystal face {hkl} is, the more relevant {hkl} is for the crystal morphology. From this supposition, a series of possible growth faces {hkl} can be determined from the crystal lattice symmetry. For LFMC, the morphologically most relevant growth forms are {200}, {101}, {210}, {011}, {111}, and {020}. Hence, the BFDH law predicts that the most important crystal growth forms of LFMC are the pinacoids {200} and {020}, followed by the orthorhombic prisms {101}, {210}, and {011}, and the tetragonal dipyramid {111}. All these forms are shown in Fig. 4(a), which displays a Wulff plot generated from the BFDH list of faces and center-to-face distances. This result can be compared to the size and shape of the actually grown material as seen in the SEM images for selected phase-pure LFMC samples in Fig. 5. The SEM images show three general kinds of single particles with regular external shapes as seen in Figs. 5-M2, 5-M3b, and 5-M3c, respectively. In the images, layered growth traces on the surface possibly initiated from step sources are clearly observed, indicating a single crystalline nature of the primary particles. In the following, we compare the predicted morphologies from the Wulff plot simulation of the BFDH morphology, as displayed in Fig. 4, with the actual SEM images. The single crystal with rhombic shape (Fig. 5-M3b) is formed by the pinacoid {200} followed by the orthorhombic prism {011}, while the square shape [e.g., Figs. 5-M3c and 5-M2] is formed by the pinacoid{020} followed by the orthorhombic prism {101}. In addition to the above-mentioned simulations, the Miller indices of the existing faces can be determined by applying the law of constancy of interfacial angles as well. The images in Fig. 5 show that the {200}, {101}, {011}, and {020} faces are developed whereas the {210} and {111} faces are not observed in our experiments, which is in contrast to the predictions of the basic BFDH simulations.
Predicted morphologies (a) from Wulff plot simulations applying the BFDH law, and (b–e) from the attachment energy model of Hartman and Perdok theory (HPT).

SEM images of LFMC obtained under different pH values (see the text) and M-ion concentrations (C M). L: C M = 0.03 mol/L; M: C M = 0.06 mol/L; H: C M = 0.12 mol/L.

Hence, to predict the shape of a crystal more accurately, the energy of the system must be taken into account. Most notably, the attachment energy model of Hartman and PerdokReference Dekkers and Woensdregt47 makes use of the actual magnitude of molecular interactions to estimate the relative growth rates of crystal faces. In this model, the growth rate of a crystal face is assumed to be proportional to its attachment energy, i.e., faces with the lowest attachment energies are the slowest growing ones and, therefore, have the highest morphological relevance. The attachment energy E att is defined as the energy released on attachment of a growth slice to a growing crystal surface. E att is computed as: E att = E latt–E slice, where E latt is the lattice energy of the crystal, E slice is the energy of a growth slice with thickness d hkl, and the growth rate is proportional to E att. The attachment energy method attempts to obtain crystal habits under nonequilibrium growth conditions by simulation. In our work, the attachment energy is calculated based on the first principle method for a series of slices {hkl} that we have determined by performing a Donnay–Harker prediction.
The Hartman–Perdok approach starts with the search of periodic bond chains (PBCs), which are uninterrupted periodic chains of strong bonds between the crystalline units, such as atoms, molecules, or clusters, formed during crystallization. Crystal faces can be classified either as F faces, which contain at least two nonparallel PBCs in a slice of thickness d hkl, or as S faces containing only one PBC, or as K faces containing no PBC at all. The F faces are the slowest to grow according to the layer mechanism and therefore are the dominant faces present on actual growth forms. According to the crystal structure of LFMC [Fig. 1(a)], five main PBCs can be traced, which are shown in Fig. 6. They can be represented by the following crystal directions:
 $$\lt 001 \gt:{\rm{Li}}(x,y,z) - {\rm{P}}{{\rm{O}}_4}(x,y,z) - {\rm{M}}(x,y,z - 1) - {\rm{P}}{{\rm{O}}_4}(x + {1 \mathord{\left/ {\vphantom {1 2}} \right. \kern-\nulldelimiterspace} 2}, - y + {1 \mathord{\left/ {\vphantom {1 2}} \right. \kern-\nulldelimiterspace} 2}, - z + {1 \mathord{\left/ {\vphantom {1 2}} \right. \kern-\nulldelimiterspace} 2}) - {\rm{Li}}(x + 1,y,z)\quad {\rm{,}}$$
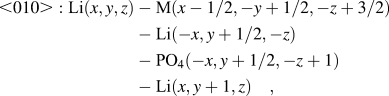 $$\lt 010 \gt :{\rm{Li}}(x,y,z) - {\rm{M}}(x - {1 \mathord{\left/ {\vphantom {1 2}} \right. \kern-\nulldelimiterspace} 2}, - y + {1 \mathord{\left/ {\vphantom {1 2}} \right. \kern-\nulldelimiterspace} 2}, - z + {3 \mathord{\left/ {\vphantom {3 2}} \right. \kern-\nulldelimiterspace} 2}) - {\rm{Li}}( - x,y + {1 \mathord{\left/ {\vphantom {1 2}} \right. \kern-\nulldelimiterspace} 2}, - z) - {\rm{P}}{{\rm{O}}_4}( - x,y + {1 \mathord{\left/ {\vphantom {1 2}} \right. \kern-\nulldelimiterspace} 2}, - z + 1) - {\rm{Li}}(x,y + 1,z)\quad {\rm{,}}$$
 $$\lt 011 \gt :{\rm{Li}}(x,y,z) - {\rm{P}}{{\rm{O}}_4}(x,y,z) - {\rm{P}}{{\rm{O}}_4}( - x,y + {1 \mathord{\left/ {\vphantom {1 2}} \right. \kern-\nulldelimiterspace} 2}, - z + 1) - {\rm{Li}}(x,y + 1,z + 1)\quad {\rm{,}}$$
 $$\lt 0 - 11 \gt :{\rm{Li}}(x,y,z) - {\rm{P}}{{\rm{O}}_4}( - x,y - {1 \mathord{\left/ {\vphantom {1 2}} \right. \kern-\nulldelimiterspace} 2}, - z + 1) - {\rm{P}}{{\rm{O}}_4}(x,y - 1,z) - {\rm{Li}}(x,y - 1,z + 1)\quad {\rm{,}}$$
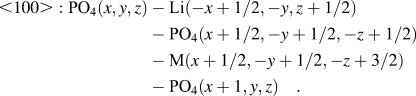 $$\lt 100 \gt:{\rm{P}}{{\rm{O}}_4}(x,y,z) - {\rm{Li}}( - x + {1 \mathord{\left/ {\vphantom {1 2}} \right. \kern-\nulldelimiterspace} 2}, - y,z + {1 \mathord{\left/ {\vphantom {1 2}} \right. \kern-\nulldelimiterspace} 2}) - {\rm{P}}{{\rm{O}}_4}(x + {1 \mathord{\left/ {\vphantom {1 2}} \right. \kern-\nulldelimiterspace} 2}, - y + {1 \mathord{\left/ {\vphantom {1 2}} \right. \kern-\nulldelimiterspace} 2}, - z + {1 \mathord{\left/ {\vphantom {1 2}} \right. \kern-\nulldelimiterspace} 2}) - {\rm{M}}(x + {1 \mathord{\left/ {\vphantom {1 2}} \right. \kern-\nulldelimiterspace} 2}, - y + {1 \mathord{\left/ {\vphantom {1 2}} \right. \kern-\nulldelimiterspace} 2}, - z + {3 \mathord{\left/ {\vphantom {3 2}} \right. \kern-\nulldelimiterspace} 2}) - {\rm{P}}{{\rm{O}}_4}(x + 1,y,z)\quad {\rm{.}}$$
The main PBCs in LFMC (a) <010>, <001>, <011>, and  $\left\langle {0\bar 11} \right\rangle$ parallel to the {200} slices and (b) <100> parallel to the {010} slices.

Table I lists the {hkl} faces of the grown crystal, their interplanar distances d hkl, the calculated attachment energies (E att), and the PBCs parallel to the {hkl} faces. From Table I, we can see that four F faces can be defined, which have at least two noncollinear PBCs within their corresponding slice boundaries with a thickness of d hkl. Among them, the {200} faces are parallel to four strong PBCs, <001>, <010>, <011>, and  $\left\langle {0\bar 11} \right\rangle$; the {101} faces are parallel to <010> and
 $\left\langle {10\bar 1} \right\rangle$; the {011} faces are parallel to
 $\left\langle {0\bar 11} \right\rangle$ and <100>; and the {020} faces are parallel to <001> and <100>, respectively. Furthermore, the {210} and {111} faces are parallel to only one strong PBC, which defines them as S faces. Generally, the F faces of crystals are well developed, since there are no strong PBCs running across these faces, and therefore they have a slow growth rate. However, S faces only appear in certain as-grown crystals because only one strong PBC is parallel to them and their fast growth rate can be easily disturbed by dynamic factors of the crystal growth.
{hkl} faces of the grown LFMC crystals, their attachment energy E att, interplanar distances d hkl, PBCs parallel to them, and the experimentally observed faces.

From the calculated attachment energies, we suggest that the order of morphological relevance of the different faces should be {200} > {011} > {101} > {020}. Indeed, in our experiments, the {200} and {011} faces are usually well developed [see Figs. 5-M3b and 5-M3c], while the {020} faces appear only rather occasionally [see Figs. 5-M2 and 5-M3c].
Our analysis suggests that two evolutionary routes are involved in the forming process of the LFMC powder samples. In the early stage of the growth process, “2D-nuclei” as well as “3D-nuclei” are formed [Fig. 5-M1], initially driven by a localized supersaturation (σ ∼ C M).Reference Wang, Sun, Zhang, Yu, Liu, Hu, Guo and Geng48 In particular, the “2D-nuclei” can be related to the layer-like growth of the {200} and {020} faces, apparent in Figs. 5-M3b and 5-M3c. Both kinds of nuclei grow larger by the attachment of atoms to edges and kinks of growing surfaces.Reference Wang, Zhang, Wang, Yu, Zhang, Wang and Ba49 In the following, we will refer to this process as route A, i.e., the continuous growth of primary particles. With increasing volume of the particles, additional {011} faces appear [Figs. 4(c) and 5-M2]. The final morphologies vary a lot depending on whether the {101} faces appear or not. The crystals without {101} faces tend to form rhombic and square shapes [Figs. 5-M3b and 5-M3c], as predicted in Fig. 4(c) for the former case. In addition to the individual growth, the primary particles agglomerate due to Van der Waals and Coulomb forces which is referred to as route B, i.e., agglomeration. The outcome of this process is seen in Fig. 5 from M2 to M4. The two evolutionary routes A and B coexist and compete with each other after a stable “3D-nucleus” is formed. The morphological variety of the products may hence be associated with the competition between the two routes, depending on pH and C M. Indeed, the dominating regimes of routes A and B can be separated in the phase diagram, which is illustrated by the dashed line in Fig. 3. High C M is favorable for agglomeration, whereas low C M favors the continuous single particle growth. The dominance of route A at pH < 7 may be explained by the acidity of the solution which induces positively charged surfaces and hence inhibits agglomeration of the primary particles. At pH = 6 and C M = 0.06 mol/L, single particles can be observed in different growth states from “2D-nuclei” with sizes of ∼40 nm [Fig. 5-M1], crystallites up to 700 nm [Fig. 5-M2], to several μm long crystals [Figs. 5-M3b and 5-M3c]. The size of the rhombic-shaped crystals [Fig. 5-M3b] and the square-formed single crystals [Fig. 5-M3c] is about 4.5 × 3.3 µm and 2.7 × 2.7 µm, respectively. One factor for the dominance of route B in the corresponding synthesis regime could be the occurrence of the {101} face. As evident from Fig. 1(b), the {101} surface terminates with either positively charged Li+ or negatively charged O2−. Under these circumstances, strong chemical bonds can be formed between the Li+-charged {101} surfaces of one primary particle and the O2−-charged {101} surfaces of another one in the reaction solution. If, however, {101} faces do not appear, the aforementioned single particle growth forms mainly prevail because there is no facilitation of agglomeration by oppositely charged surfaces. The size of aggregates at pH = 6 ranges from ∼5.5 µm [Fig. 5-M3a] to 17 µm [Fig. 5-M4] up to ∼43 µm [inset in Fig. 5-M4] at C M = 0.12 mol/L. The largest primary particles at the highest precursor concentration are only ∼0.3 µm big because route A is suppressed by the dominating route B. At pH = 9, the largest single crystallites are ∼0.3 × 0.1 µm and the observed aggregates are ∼10 µm big. Figure 5-M3a shows the same morphology with the traditional hydrothermal formed LFMC heated at 200 °C for two days using ascorbic acid as the reductant.Reference Chen, Vacchio, Wang, Chernova, Zavalij and Whittingham18
In summary, route A (“continuous growth”) dominates the process at low C M and low pH value, while route B (“agglomeration”) prevails at high C M and/or high pH value. Quantitatively, dispersed crystals appear at pH < ∼7 while a strong tendency to agglomeration is found at pH > ∼7. The results hence imply the isoelectric point of LFMC being around pH 7.
B. Magnetic properties
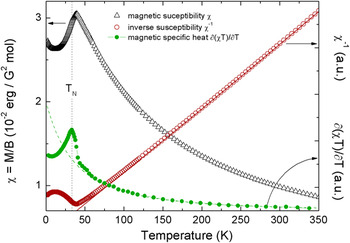
Figure 7 shows the temperature dependence of the static magnetic susceptibility and its inverse of a typical LFMC sample (i.e., from regime II in Fig. 3) at temperatures between 2 and 350 K, measured in an external magnetic field of B = 0.5 T. The data show paramagnetic Curie–Weiss-like behavior at high temperatures and a long range antiferromagnetically ordered ground state. The susceptibility peak maximum appears at 39.0(5) K. The magnetic specific heat c magn ∼ ∂(χΤ)/∂T exhibits a pronounced lambda-like maximum from which we deduce T N = 33.0(5) K. At high temperatures, the data are well described by the modified Curie–Weiss law χ(T) = χ 0 + C/(T − θ), with Curie constant C, Weiss temperature θ, and a temperature-independent contribution χ0 = −3 × 10⁻⁴ emu/(G2 mol). T N as well as the extracted Curie temperature θ = −75(5) K are in between the respective values of the pure compounds LiMPO4 with M = Fe (T N ≈ 52 K, θ ≈ −120 K), M = Co (≈21 K, ≈−52 K), and M = Mn (≈34 K, ≈−65 K).Reference Chen, Wang, Hu, Lin, Dou and Nigam50–Reference Nie, Ouyang, Chen, Zhong, Du, Liu, Shi and Lei56 The effective magnetic moment of the M2+-ions deduced from the Curie–Weiss analysis amounts to p eff = 5.51(2) μB. This value agrees well with the value of 5.47 μB which is theoretically predicted if the spin and a reduced (pseudo-) orbital momentum l = 1 are considered. The latter reflects partial quenching of the orbital momentum of electrons in t 2g−orbital states by the crystal field.
Temperature dependence of the static magnetic susceptibility M/B (left ordinate), the inverse susceptibility, and the magnetic specific heat (both right ordinate) of LFMC from 2 to 350 K measured at B = 0.5 T. Lines reflect a Curie–Weiss approximation, T N has been deduced from the magnetic specific heat ∂(χΤ)/∂T (see the text).

C. Electrochemical properties
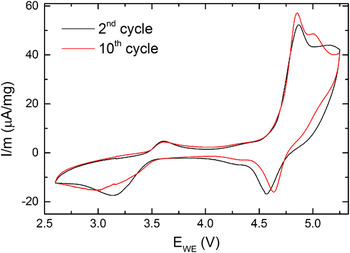
The electrochemical properties are studied by CV in the potential range between 2.60 and 5.25 V at a scan rate of 0.1 mV s−1. Figure 8 shows the CV curve of one exemplary sample, synthesized at pH 9 and C M = 0.12 mol/L, consisting of highly agglomerated rods with sub-μm dimensions. The data show two distinct areas of electrochemical activity with redox pairs at 3.6 V/3.1 V and 4.9 V/4.6 V, which are most likely associated with the oxidation/reduction of Fe2+/Fe3+ and Co2+/Co3+, respectively. At potentials exceeding 4.5 V, there is also a strong irreversible oxidative contribution caused by electrolyte decomposition,Reference Xu15 which partially overlays the Co2+/Co3+ oxidation. Nevertheless, the Co2+/Co3+ activity is significant, as evident from the pronounced reduction peak at 4.6 V. The absence of visible Mn2+/Mn3+ redox peaks in the CV, expected in the potential range around 4.1 V, is probably due to the sluggish kinetics of the Mn2+/Mn3+ couple, induced by the Jahn–Teller effect of Mn3+.Reference Yonemura, Yamada, Takei, Sonoyama and Kanno11,Reference Nie, Ouyang, Chen, Zhong, Du, Liu, Shi and Lei56
Exemplary CV curve of one sample synthesized at pH 9 and C M 0.12 mol/L, showing Fe2+/Fe3+ and Co2+/Co3+ redox peaks at 3.6 V/3.1 V and 4.9 V/4.6 V respectively.

The work of Zhang et al.Reference Zhang, Sun and Zhou20 shows electrochemical activity of all redox couples in LiFe1/3Mn1/3Co1/3PO4 with increasing working potentials for Fe2+/Fe3+ and decreasing ones for Co2+/Co3+. We cannot draw accordant conclusions because our pristine materials still suffer from the low intrinsic electronic conductivity and ionic diffusivity of the olivine-type phosphates. In particular, this is reflected in the huge overpotential gap between the Fe2+/Fe3+ oxidation and reduction peak and the broadening of the latter one. We emphasize in this context that the materials used for our electrochemical characterization were not subject to carbon coating or any postsynthesis treatment as the present work aims at elucidating growth mechanisms and morphology-related effects. Furthermore, all synthesized samples either show particle dimensions >1 µm or are part of agglomerates of several μm sizes (see Sec. III. A), which lead to quite similar results in CVs.
IV. CONCLUSIONS
We report the synthesis of LiFe1/3Mn1/3Co1/3PO4 by using the microwave-assisted hydrothermal technique at different pH and different transition-metal-ion concentrations in the reactant. The morphology of the products has been analyzed by first principle calculations using the Hartman–Perdok approach, which are discussed against actual size and shape of the produced materials. The growth mechanism under different pH and C M values is discussed. In addition, the magnetic properties of the products are studied and the electrochemical properties are initially evaluated by the CV measurements.
ACKNOWLEDGMENTS
The authors thank I. Glass for experimental assistance. Support by the Bundesministerium für Bildung und Forschung (project 03SF0397) and by Deutsche Forschungsgemeinschaft (KL1824/2, KL1824/5) is gratefully acknowledged. KW acknowledges support by the European Commission through FP7 Marie Curie Grant PIIF-GA-2012-331476 LiCrystG.