


INTRODUCTION
Most studies in fisheries biology have focused on the main species targeted by fishing operations. However, this single-species approach is restrictive for multi-species fisheries, such as the Mediterranean bottom trawl fishery (Caddy, Reference Caddy1999). Studying the fish assemblage structure in relation to environmental variables and the characterization of seasonal changes are among the suggested new approaches in the study of exploited populations (Gislason et al., Reference Gislason, Sinclair, Sainsbury and O'Boyle2000).
Demersal fish and epifaunal assemblages on circalittoral soft bottoms have been extensively studied in the Mediterranean Sea, especially in the western basin (e.g. Demestre et al., Reference Demestre, Sánchez and Abelló2000; Biagi et al., Reference Biagi, Sartor, Ardizzone, Belcari, Belluscio and Serena2002; González & Sánchez, Reference González and Sánchez2002; Colloca et al., Reference Colloca, Cardinale, Belluscio and Ardizzone2003; Massutí & Reñones, Reference Massutí and Reñones2005). Although most of these works have been focused on the analysis of depth related trends, some geographical and seasonal distribution studies have also been conducted (Abelló et al., Reference Abelló, Carbonell and Torres2002; Massutí et al., Reference Massutí, Gordon, Moranta, Swan, Stefanescu and Merrett2004; Gaertner et al., Reference Gaertner, Bertrand, de Sola, Durbec, Ferrandis and Souplet2005; Moranta et al., Reference Moranta, Quetglas, Massutí, Guijarro, Hidalgo and Diaz2008). Information on such assemblages in the eastern Mediterranean is more limited, although they have been described for the southern Adriatic (Ungaro et al., Reference Ungaro, Marano, Vlora and Martino1998, Reference Ungaro, Marano, Marsan, Martino, Marzano, Strippoli and Vlora1999), the Ionian Sea (D'Onghia et al., Reference D'Onghia, Tursi, Maiorano, Matarrese and Panza1998; Madurell et al., Reference Madurell, Cartes and Labropoulou2004) and the southern (Kallianiotis et al., Reference Kallianiotis, Sophronidis, Vidoris and Tselepides2000) and northern Aegean Sea (Labropoulou & Papaconstantinou, Reference Labropoulou and Papaconstantinou2000).
Depth has been reported as the main factor influencing large scale faunal changes over the continental shelf and slope, and both physical (e.g. sediment and characteristics of water masses) and biological factors (resource availability, predator–prey relationships and interspecific competition) have been discussed as underlying causes responsible for this zonation (e.g. Haedrich et al., Reference Haedrich, Rowe and Polloni1980; Bianchi, Reference Bianchi1992; Carney, Reference Carney2005). The local conditions in such factors, as well as fishing activities, can also determine regional differences of demersal assemblages (e.g. Moranta et al., Reference Moranta, Quetglas, Massutí, Guijarro, Hidalgo and Diaz2008). It is especially relevant in areas such as the eastern Mediterranean with its particular environmental conditions, e.g. extremely oligotrophic, elevated deep water temperature and high salinity (Stergiou & Pollard, Reference Stergiou and Pollard1994).
The aim of the present paper is to compare the demersal fish assemblages between the Sea of Marmara, a small inland sea connecting the Mediterranean and the Black Seas where no information on this matter exists, and the most eastern part of the Mediterranean in the Aegean Sea. These areas are connected by the Dardanelles Strait, a biological corridor 62 km long with an average width of 4 km and maximum depth of 167 m. The observed differences are discussed in relation to the distinct environmental conditions in both areas.
MATERIALS AND METHODS
The study is based on several scientific surveys carried out on the continental shelf in the south-western part of the Sea of Marmara and the continental shelf and upper slope of the north-eastern Aegean Sea (Figure 1), on-board the RV ‘Yunus-S’ (31.8 m, 202 GT, 510 HP). During these surveys, sampling of demersal (and some pelagic) fish species and hydrographic conditions were undertaken.
Map of the study areas: north-eastern part of the Mediterranean (A), the south-western Sea of Marmara and the north-eastern Aegean Sea (B), showing the sampling stations. The 50, 100, 200 and 500 m isobaths are also shown.

Study area
The Sea of Marmara has a large continental shelf, especially in its southern part, with an average and maximum depths of around 500 and 1400 m, respectively. A two layered flow regime exists in the area, as a result of water exchange between the Mediterranean and the Black Sea. Black Sea waters (7–24°C and 22–26 psu) enter through the Bosphorus Strait in the upper layer (20–25 m), with a renewal time of about 5–6 months. Below there are the sub-halocline waters of the Marmara basin, which possess near constant temperatures (14.5–15.0°C) and higher salinity of 38.5–38.6 psu, with a renewal time of about 6–7 years, produced by the Mediterranean inflow via the Dardanelles undercurrent. Dissolved oxygen concentration declines with depth, from saturated levels at 30–50 m, being nearly exhausted in sub-halocline waters during August and September (Beşiktepe et al., Reference Beşiktepe, Ozsoy and Unluata1993). In the south-western Sea of Marmara, muddy bottoms are predominant, given the detrital inputs by rivers (e.g. Algan et al., Reference Algan, Balkıs, Çağatay and Sarı2004).
The North Aegean Sea is separated from the South Aegean by the Cyclades Islands. It is characterized by a wide shelf in the northern part and the North Aegean Trough, which extends from south-west to north-east (Kourafalou & Barbapoulos, Reference Kourafalou and Barbopoulos2003) and reaches 1600 m depth. Black Sea waters, flowing from the Dardanelles, are the most significant water mass input into the North Aegean Sea. These massive waters of 8.8–25°C and 31.8–38.3 psu affect the uppermost layer (20–30 m depth) and are modified, moving westward and southward, by mixing with the intermediate waters of Levantine origin, a warm and highly saline water originating from the South Aegean to the Levantine basins, extending down to 350–400 m depth (Theocharis & Georgopoulos, Reference Theocharis and Georgopoulos1993; Tokat, Reference Tokat2006; Pazi, Reference Pazi2008). Below there are very dense North Aegean Deep Waters (13.3°C and 39 psu). No anoxic events have been reported in this area. In the north-eastern Aegean Sea, biogenic and terrigenous sandy bottoms are dominant on the shelf, while the slope is characterized by silt and clay sediments (Sarı & Çağatay, Reference Sarı and Çağatay2001).
Sampling
Data collection was carried out during five periods: June and October 2006, and March, June and August 2007. Fish were collected with a bottom trawl net, with a 16 mm cod-end mesh size and an estimated vertical and horizontal opening of about 2 and 19.4 m, respectively. During each haul, the physical and chemical parameters were recorded in the water column, using a CTD SBE-19 SEACAST Profiler equipped with oximeter.
A total of 40 hauls were conducted during daylight hours: 16 in the Sea of Marmara at depths of 38–74 m, and 24 in the Aegean Sea at depths of 63–401 m (Table 1). Trawl duration ranged from 15–60 minutes, and mean towing speed was about 2.4 knots. The position at the start and the end of each trawl was recorded using a Global Positioning System (GPS). All samples were sorted, counted, weighted and identified to species level. Catches were standardized to a swept area (km2) in accordance with the methodology most commonly employed in studies of demersal megafaunal assemblages in the Mediterranean (e.g. Bertrand et al., Reference Bertrand, de Sola, Papaconstantinou, Relini and Souplet2002).
Sampling stations and hauls characteristics, with total number of species (S), abundance (A; individuals/km2) and biomass (B; kg/km2) of pelagic and demersal fish caught during the five surveys developed in the south-western Sea of Marmara (SM) and the north-eastern Aegean Sea (AS).

Data analysis
A standardized abundance data matrix of demersal fish species was created. In this matrix, species appearing only in one sample or considered as pelagic (e.g. Fischer et al., Reference Fischer, Bauchot and Schneider1987) were removed (see Results). Data were log(x + 1) transformed, and cluster analysis and non-metric multidimensional scaling (MDS) were applied in order to identify fish assemblages. The Bray–Curtis index was used as a between-haul similarity measure. The unweighted pair-group method with arithmetic mean (UPGMA) was used as the clustering algorithm. Similarity percentage analysis (SIMPER) was used to determine which species characterize the groups detected. All these analyses were carried out using the PRIMER package (Clarke & Warwick, Reference Clarke and Warwick2001).
The mean values of abundance (individuals.km−2), biomass (kg.km−2), mean fish weight (kg), species richness, Shannon–Wiener diversity index (H′; Shannon & Weaver, Reference Shannon and Weaver1949) and evenness (J′; Pielou, Reference Pielou1969) were estimated for each assemblage detected in the cluster analysis. Differences between groups for these indices were examined using a t-test.
Measures of depth (m), temperature (°C), salinity (psu) and dissolved oxygen (mg/l) were taken for each haul location by conductivity–temperature–depth casts. Depth profiles were plotted for these variables. The environmental conditions near the bottom were estimated by considering the values of temperature, salinity and dissolved oxygen within the 5 m water column above the bottom. Multi-variate analysis of variance (MANOVA) was used to test for differences in these parameters between the continental shelves of the two study areas. A t-test was performed to identify which variables caused the differences. Prior to parametric tests, the data were checked for the assumptions of normality and homogeneity of variances. When these assumptions were not met, data were log-transformed.
Canonical analysis was used to explore the relationships between fish species and the environmental variables. The species included in the analysis were those appearing within the 75% of similarity contribution to the shelf assemblages detected in both the north-eastern Aegean and south-western Marmara Seas. Before the application of direct gradient (canonical) analyses, the length of gradient of the response variables, which were the log-transformed standardized abundances per haul of selected fish species, was assessed by means of detrended correspondence analysis. The resulting gradients were short (below 2.5 SD units), and consequently a linear ordination method was used by applying redundancy analysis (RDA). The explanatory variables considered were depth, temperature, salinity and dissolved oxygen of water near the bottom. In RDA it is possible to specify co-variables (partial RDA), which allows testing of the effect of a particular explanatory variable after the variation explained by the co-variables is factored out. Details of the models used are found in Table 2. The significance of the explanatory variables was assessed by means of the Monte Carlo permutation-based test (Manly, Reference Manly1991). A tri-plot diagram with species, samples and environmental variables was created for the partial RDA with depth as co-variable. Salinity was found to be not significant and was removed from the final model.
Description of the redundancy analysis models used to test for the effects of explanatory variables. In all cases 999 unrestricted permutations were conducted to test the significance of the variables. DO, dissolved oxygen (mg/l).

RESULTS
A total of 47, 940 individuals (2393.5 kg), belonging to 91 species (47 families) were collected from the 40 hauls analysed (Table 3). In the Sea of Marmara, a total of 44 species (27,138 ind., 1028.4 kg) were collected, of which Merlangius merlangus, Merluccius merluccius and Serranus hepatus were the most frequent species between 38 and 72 m depth, followed by Raja clavata, Gobius niger and Arnoglossus laterna. Catches in the Aegean Sea comprised 83 species, 20,802 individuals and 1365.0 kg. Merluccius merluccius and Lophius budegassa were the most frequent species, with large bathymetric ranges (63–401 m), while Eutrigla gurnardus, Serranus cabrilla and Lepidotrigla cavillone were most frequent in the shallower parts (<100 m depth) and Phycis blennoides and Coelorinchus caelorhincus abundant at depths >100 m.
Fish species caught in the south-western Sea of Marmara and north-eastern Aegean Sea. Total number of individuals (N), total weight (W, kg), depth-range (D, m), the frequency of appearance (F, percentage of hauls in which the species was captured within this depth-range), number of hauls (n). The asterisks indicate species removed for the analysis (*, species caught in only one sample; **, pelagic species).

Considering the whole catch, M. merlangus was the most important species in the Sea of Marmara, both in terms of number of individuals and weight, followed by Trachurus trachurus and S. hepatus, in terms of abundance, and by R. clavata and M. merluccius, in terms of biomass (Table 3). In the Aegean Sea, the most important species in terms of abundance were Gadiculus argenteus, Mullus barbatus and C. caelorhincus, whereas in terms of biomass they were Micromesistius poutassou, M. merluccius, Scyliorhinus canicula, M. barbatus and L. budegassa (Table 3).
Cluster analysis indicated that the samples could be attributed to three main groups (Figure 2A). The first discernible cluster comprised deep-water samples (177–395 m) from the Aegean Sea (ASL: Aegean Sea Slope). The remaining shallow water samples were distinct between the Aegean Sea (69–100 m depth, ASH: Aegean Sea Shelf) and Sea of Marmara (SM, 38–72 m). The MDS confirmed the presence of these three groups of samples (Figure 2B).
According to the results of the SIMPER analysis (Table 4), the average similarity of the SM group was 61%, with M. merlangus, S. hepatus, M. merluccius, G. niger, A. laterna and E. gurnardus the main contributors to this similarity. The average similarity of the ASH group was 52%, and S. hepatus, Citharus linguatula, M. merluccius, M. barbatus, L. budegassa and L. cavillone were the main contributors. The ASL group (the average similarity = 61%) comprised mainly Lepidorhombus boscii, C. caelorhincus, P. blennoides, Argentina sphyraena, L. budegassa, M. merluccius and Trigla lyra. The average dissimilarities between the three groups were as follow: 60.6% between SM and ASH; 82.7% between SM and ASL; 78.4% between ASH and ASL.
Dendrogram (A) and two-dimensional non-metric multidimensional scaling ordination (B) based on fish standardized species abundance. Labels show the mean depths (m) and sampling period (JL06: July 2006; O06: October 2006; M07: March 2007; J07: June 2007 and A07: August 2007) for each sample. The samples were divided into three groups associated with bathymetric strata and areas. SM: 38-72 m in the south-western Sea of Marmara; ASH: 68-100 m in the north-eastern Aegean Sea; AS: 177-395 m in the north-eastern Aegean Sea.

Similarity percentage analysis results showing the mean abundance (A; individuals/km2), average within-group similarity (SIM), the percentage contribution to the similarity (SIM%), standard deviation of similarity (SIM/SD), the percentage contribution to within-group similarity (SIM%), and the accumulated SIM% (ΣSIM%). SM, shelf in the south-western Sea of Marmara; ASH, shelf in the north-eastern Aegean Sea; ASL, upper slope in the north-eastern Aegean Sea.

The comparisons for the ecological parameters between the assemblages detected revealed that the average values of abundance, biomass and mean fish weight were not significantly different. By contrast, mean species richness, diversity and evenness in SM were lower than in ASH (Table 5).
Mean values and standard errors of the abundance (individuals/km2), biomass (kg/km2), fish weight (kg), species richness (number of species; total species richness also shown), diversity and evenness indices for shelf groups resulting from the cluster analysis, and results of the t-test. SM, shelf in the south-western Sea of Marmara; ASH, shelf in the north-eastern Aegean Sea; n.s., not significant; SE, standard error; *P < 0.01; **P < 0.001.

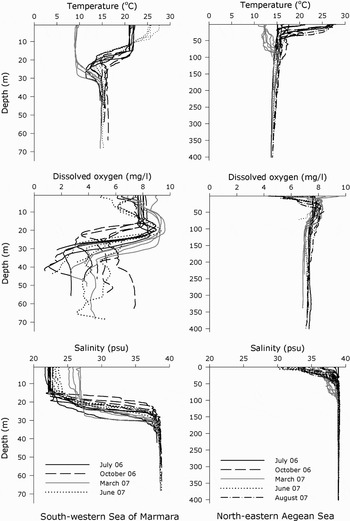
The vertical profiles showed that the variability of the values of temperature (T), dissolved oxygen (DO) and salinity (S) decreased with increasing depth, except in the case of DO in SM (Figure 3). The temperature near the bottom ranged from 14.4 to 16.3°C in the Sea of Marmara and from 13.7 to 16.2°C in the Aegean Sea, salinity from 37.9 to 38.8 psu in the Sea of Marmara and 38.6 to 39 psu in the Aegean Sea, and dissolved oxygen from 0.8 to 7.3 mg/l in the Sea of Marmara and from 6.5 to 7.7 mg/l in the Aegean Sea. MANOVA showed differences in the mean values of the environmental parameters between SM and ASH (Wilks' lambda = 0.237, P < 0.001) (Table 6). The t-test results showed that mean value of dissolved oxygen (t = 7.707, df = 28; P < 0.001) and salinity (t = 4.740, df = 28; P < 0.001) near the bottom, and depth (t = 5.918, df = 28; P < 0.001), were significantly higher in the ASH than in SM, whereas the mean values of temperature near the bottom were not significantly different between the two geographic areas studies (t = –0.832, df = 28; P = 0.412).
The vertical profiles of the water temperature, salinity and dissolved oxygen for each sample from 38 to 72 m depth in the south-western Sea of Marmara, and from 68 to 395 m depth in the north-eastern Aegean Sea.
Total mean values (±standard error) of the environmental variables on the continental shelf areas, and their mean (±standard error), minimum and maximum values by sampling period. DO, dissolved oxygen (mg/l); T, temperature (°C); S, salinity (psu); D, depth (m).

The RDA showed that dissolved oxygen, depth and temperature had a significant effect on the distribution of fish species. These variables explained 39.0% of the total variance of the selected species. Partial RDA models revealed that dissolved oxygen was the most important variable, and explained 10.4% of the total variance, whereas temperature and depth explained 9.7% and 7.4% of the total variance, respectively (Table 7). The RDA tri-plot, with depth as co-variable, showed that samples were continuously distributed along the dissolved oxygen and temperature gradients (Figure 4), although for this last variable two high extreme value samples and one low extreme value sample were present. Most of species abundances were positively correlated with dissolved oxygen, whereas M. merlangus, A. laterna, G. niger and Lesueurigobius friesii were negatively correlated with this variable. On the other hand the abundances of A. laterna, M. merlangius, R. clavata, C. linguatula, E. gurnardus and M. merluccius were positively correlated with temperature, whereas L. friesii, L. budegassa, S. cabrilla, Trachinus draco and S. canicula were negatively correlated to this variable. The short length of the arrows for S. hepatus and L. cavillone indicated that the abundances of these species were poorly explained by the variables in the model.
Redundancy analysis tri-plot for fish species, samples and environmental variables. Alat, Arnoglossus laterna; Clin, Citharus linguatula; Egur, Eutrigla gurnardus; Gnig, Gobius niger; Lfrie, Lesuerogobius friesii; Lcav, Lepidotrigla cavillone; Lbud, Lophius budegassa; Mmerlang, Merlangius merlangus; Mmerluc, Merluccius merluccius; Mbar, Mullus barbatus; Shep, Serranus hepatus; Rcla, Raja clavata; Scan, Scyliorhinus canicula; Tdra, Trachinus draco. DO and T are the dissolved oxygen and temperature near the bottom, respectively.

Results of the redundancy analysis model. The explained variance (EV%), the F statistic and the significance (P value) are indicated. DO, dissolved oxygen (mg/l); T, temperature (°C); S, salinity (psu); D, depth (m).

DISCUSSION
The North Aegean Sea and the Sea of Marmara are among the major bio-geographical sectors in the northernmost Mediterranean Sea. A decrease in species richness has been reported between both areas, from west to east (Garibaldi & Caddy, Reference Garibaldi and Caddy1998; Bianchi, Reference Bianchi2007). This is due to the barrier effect of different topography, morphology and hydrological conditions along the Turkish Straits System (Dardanelles, Sea of Marmara and Bosphorus). The high contrast of temperature and salinity between the North Aegean Sea and the Sea of Marmara and the existence of a two-layer flow structure of water masses along the Turkish Straits System, with sharp horizontal and vertical temperature and salinity contrasts, very strong vertical mixing and hydraulic adjustment processes along this system and oxygen stress (Beşiktepe et al., Reference Beşiktepe, Sur, Ozsoy, Latif, Oguz and Unluata1994), restrict the expansion of some Mediterranean species into the Sea of Marmara, more than the south-western expansion of Black Sea species. In this sense, 12 out of the 47 endemic species from the Black Sea are also present in the Sea of Marmara, whereas only 6 reach the Aegean Sea.
Our results support these biogeographical considerations, as clear differences were observed in the demersal fish species richness between both areas (83 in the Aegean Sea and 44 in the Sea of Marmara). Although almost all the species are also common in the rest of the Mediterranean Sea, M. merlangus and S. sprattus, two abundant species in the Black Sea which are considered as cold water relics originating from North Atlantic (Zaitsev & Öztürk, Reference Zaitsev and Öztürk2001), were more abundant in the Sea of Marmara.
Many studies have reported depth as the main factor determining faunal changes in the Mediterranean (e.g. Kallianiotis et al., Reference Kallianiotis, Sophronidis, Vidoris and Tselepides2000, Reference Kallianiotis, Vidoris and Sylaios2004; Labropoulou & Papaconstantinou, Reference Labropoulou and Papaconstantinou2000; Masutí & Reñones, 2005; Moranta et al., Reference Moranta, Quetglas, Massutí, Guijarro, Hidalgo and Diaz2008). In the present study, depth and also area appeared as important factors. Samples carried out on the upper slope were separated from those on the shelf, and within this last depth stratum, two geographical groups could be defined corresponding to samples carried out in the Aegean Sea and the Sea of Marmara. Fish assemblages from the continental shelf and slope from the North Aegean Sea were more similar to those in the Thracian Sea and the Central Aegean Sea, than to those in the southern part of the North Aegean trough (Kallianiotis et al., Reference Kallianiotis, Vidoris and Sylaios2004; Labropoulou & Papaconstantinou, Reference Labropoulou and Papaconstantinou2004), whereas the shelf of the Sea of Marmara was more similar to the Black Sea (Eryılmaz & Meriç, Reference Eryılmaz and Meriç2005).
Oceanographic characteristics, especially temperature and salinity, and bottom type play an important role for structuring assemblages on the continental shelf of the Aegean Sea (Stergiou et al., Reference Stergiou, Christou, Georgopoulos, Zenetos and Souvermezoglou1997). In the present study, dissolved oxygen and temperature have been identified as important factors affecting fish assemblages on the shelf areas. However, salinity did not show any influence, probably due to a common effect of the Mediterranean waters below 40 m depth for both areas. Merlangius merlangus and the small-sized species S. hepatus, L. friesii, G. niger and A. laterna were more abundant in the south-western Sea of Marmara, in which dissolved oxygen was lower than in the north-eastern Aegean Sea. Merlangius merlangus can tolerate low levels of oxygen saturation (Pihl Reference Pihl, Rylands and Tyler1989; Baden et al., Reference Baden, Loo, Pihl and Rosenberg1990; Petersen & Phil, Reference Petersen and Pihl1995) and in some areas its distribution has been fround to be negatively correlated with dissolved oxygen (Marshall & Elliott, Reference Marshall and Elliott1998). In the Black Sea, this species is distributed between 35 and 100 m depth (Çiloğlu et al., Reference Çiloğlu, Şahin, Gözler and Verep2002), being more abundant at 40–90 m depth, where it finds enough dissolved oxygen and a suitable temperature (Kara et al., Reference Kara, Kaya, Benli, Mater and Güven1999). Moreover, the population of M. merlangus was mostly composed of small specimens (mean fish weight was 48 and 35 g for the Aegean and Marmara Seas). The apparent affinity for hypoxia of these small-sized species and small individuals of large ones could be interpreted in terms of a sheltering strategy, as it seems that larger and potential predator species try to avoid such hypoxic areas (most of them being positively correlated to dissolved oxygen concentration). For example, the tolerance to hypoxia of coral gobies has been related to a reduced risk of predation and the potential losing of vital habitat space (Nilsson et al., Reference Nilsson, Hobbs, Munday and Östlund-Nilsson2004). The type of bottom could be another factor affecting the composition of fish assemblages in the two continental shelf areas. Fish inhabiting the south-western Sea of Marmara were species characteristic of muddy bottoms (e.g. L. friesii), while those in the north-eastern Aegean Sea have been related to sandy or muddy–sand bottoms (Demestre et al., Reference Demestre, Sánchez and Abelló2000; Calloca et al., Reference Colloca, Cardinale, Belluscio and Ardizzone2003; Ordines & Massutí, Reference Ordines and Massutí2009).
The mean abundance, biomass and mean fish weight of the two shelf assemblages did not show significant differences. However, diversity was significantly lower in the south-western Sea of Marmara than in the north-eastern Aegean Sea, and the inverse pattern was observed for evenness, revealing that the demersal ichthyfauna of the south-western Sea of Marmara was less homogeneous than that in the north-eastern Aegean Sea. In this sense, in the south-eastern Sea of Marmara, two species (M. merlangus and S. hepatus) accounted for nearly half of the total demersal fish abundance.
Diversity can be affected by different factors, such as the decrease of water quality (Guidetti et al., Reference Guidetti, Fanelli, Fraschetti, Terlizzi and Boero2002 and references therein), hypoxia (Keister et al., Reference Keister, Houde and Breitburg2000) and fishing pressure (i.e. Jennings et al., Reference Jennings, Greenstreet and Reynolds1999; Labropoulou & Papaconstantinou, Reference Labropoulou and Papaconstantinou2005), among others. The fishing exploitation can also affect the size-structure of these communities, by harvesting larger individuals and increasing the relative importance of small ones in the fish populations (Pauly et al., Reference Pauly, Christensen, Dalsgaard, Froese and Torres1998). The illegal fishing exploitation has dramatically reduced the abundance of commercial fish species during the last decades (Zengin & Mutlu, Reference Zengin, Mutlu, Öztürk, Kadıoğlu and Öztürk2000) and degenerated ecological conditions in the Sea of Marmara (Okuş et al., Reference Okuş, Yüksek, Uysal and Orhon1997). Hence, fishing pressure could be another reason to explain the lower diversity and higher importance of small-sized species and small individuals of large ones in the south-western Sea of Marmara with respect to the north-eastern Aegean Sea, where also some zones banned for bottom trawling have been established (e.g. Saros Bay; see Figure 1). This last area is important as reproduction and nursery grounds for demersal and pelagic resources (Coker et al., Reference Coker, Turkoglu and Satilmis2008), thus contributing to maintain more equilibrium in structured shelf assemblages.
As the main conclusion, our study supported the biogeographical differences between the Sea of Marmara and the Aegean Sea, in terms of demersal fish assemblages in the continental shelf areas, as a consequence of different geo-morphological, oceanographic and fishing impact conditions. The identification of these assemblages, and the main environmental causes affecting them, can be of great importance for fisheries management and the sustainability of regional fisheries in the area.
ACKNOWLEDGEMENTS
This work was supported by the Scientific and Technological Research Council of Turkey (TUBITAK, grant number 105Y039). The authors would like to acknowledge with thanks the research team of the project and crew of RV ‘Yunus-S’ for their help during the sampling study of the project. We would like to thank all members of the Centre Oceanogràfic de les Balears (Instituto Español de Oceanografía) for their valuable helps during the evaluation of this manuscript. The authors thank Professor B. Öztürk for his scientific comments. We also thank PhD student Volkan Demir for his technical help on the manuscript.



