Depressive disorders are among the most prevalent psychiatric disorders worldwide (Kessler et al., Reference Kessler, Berglund, Demler, Jin, Koretz and Merikangas2003; Kessler & Bromet, Reference Kessler and Bromet2013) and cause severe suffering and disability, and are associated with tremendous socio-economic costs (Greenberg, Fournier, Sisitsky, Pike, & Kessler, Reference Greenberg, Fournier, Sisitsky, Pike and Kessler2015; Whiteford et al., Reference Whiteford, Degenhardt, Rehm, Baxter, Ferrari, Erskine and Vos2013). One of the core characteristics of depression is anhedonia, a lack of interest or pleasure in typically enjoyable experiences. Anhedonia is a predictor of worse prognosis in terms of both the course and treatment of depression (McMakin et al., Reference McMakin, Olino, Porta, Dietz, Emslie, Clarke and Birmaher2012; Uher et al., Reference Uher, Perlis, Henigsberg, Zobel, Rietschel, Mors and Bajs2012). Based on neuroscientific findings, anhedonia has been increasingly conceptualized as arising from an underactive motivational approach system and associated deficits in reward processing (Davidson, Reference Davidson1998; Pizzagalli, Reference Pizzagalli, Iosifescu, Hallett, Ratner and Fava2008).
Deficits in neural response to rewards have been robustly observed in depression using an event-related potential (ERP) known as the reward positivity (RewP) that is evident as a relative positive deflection in the ERP following gain compared to loss feedback in simple gambling tasks (Proudfit, Reference Proudfit2015). The amplitude of the RewP correlates with activation of the mesocorticolimbic reward circuit, including the medial prefrontal cortex and ventral striatum (Becker, Nitsch, Miltner, & Straube, Reference Becker, Nitsch, Miltner and Straube2014; Carlson, Foti, Mujica-Parodi, Harmon-Jones, & Hajcak, Reference Carlson, Foti, Mujica-Parodi, Harmon-Jones and Hajcak2011). Further, amplitude of the RewP varies with individual differences in sensitivity to reward contingencies (Bress & Hajcak, Reference Bress and Hajcak2013). Critically, the RewP has repeatedly been found to be reduced in clinical depression (Brush, Ehmann, Hajcak, Selby, & Alderman, Reference Brush, Ehmann, Hajcak, Selby and Alderman2018; Foti, Carlson, Sauder, & Proudfit, Reference Foti, Carlson, Sauder and Proudfit2014; Liu et al., Reference Liu, Wang, Shang, Shen, Li, Cheung and Chan2014). Further, a reduced RewP has been linked to risk for depression (Kujawa, Proudfit, & Klein, Reference Kujawa, Proudfit and Klein2014), prospectively predicts first-onset depression in adolescents (Nelson, Perlman, Klein, Kotov, & Hajcak, Reference Nelson, Perlman, Klein, Kotov and Hajcak2016), and interacts with other risk factors to predict increases in depressive symptoms (Burani et al., Reference Burani, Klawohn, Levinson, Klein, Nelson and Hajcak2019). Thus, the RewP seems to capture the impairment in reward processing proposed to underlie anhedonia as a core symptom of depression (Foti et al., Reference Foti, Carlson, Sauder and Proudfit2014; Liu et al., Reference Liu, Wang, Shang, Shen, Li, Cheung and Chan2014).
A separate line of research using ERPs has found that depressed individuals are also characterized by blunted neural response to pleasant pictures, as indicated by smaller amplitude of the late positive potential (LPP). The LPP is a sustained positive potential that is larger following emotional stimulus content (Cuthbert, Schupp, Bradley, Birbaumer, & Lang, Reference Cuthbert, Schupp, Bradley, Birbaumer and Lang2000; Weinberg & Hajcak, Reference Weinberg and Hajcak2011). Variability in the LPP reflects reactivity to motivationally salient content (Grasso & Simons, Reference Grasso and Simons2011; Stockburger, Schmälzle, Flaisch, Bublatzky, & Schupp, Reference Stockburger, Schmälzle, Flaisch, Bublatzky and Schupp2009), especially when picture content relates to themes of survival (Weinberg & Hajcak, Reference Weinberg and Hajcak2010). Blunted LPP amplitudes to pleasant stimuli have been reported in adult depression (Foti, Olvet, Klein, & Hajcak, Reference Foti, Olvet, Klein and Hajcak2010; MacNamara, Kotov, & Hajcak, Reference MacNamara, Kotov and Hajcak2016; Weinberg, May, Klonsky, Kotov, & Hajcak, Reference Weinberg, May, Klonsky, Kotov and Hajcak2017; Weinberg, Perlman, Kotov, & Hajcak, Reference Weinberg, Perlman, Kotov and Hajcak2016), as well as in children with high depressive symptoms or at increased risk for depression (Kujawa, Hajcak, Torpey, Kim, & Klein, Reference Kujawa, Hajcak, Torpey, Kim and Klein2012; Nelson, Perlman, Proudfit, Klein, & Kotov, Reference Nelson, Perlman, Proudfit, Klein and Kotov2014), and have been shown to prospectively predict increases in depressive symptoms in adolescents (Levinson, Speed, & Hajcak, Reference Levinson, Speed and Hajcak2019; Sandre, Bagot, & Weinberg, Reference Sandre, Bagot and Weinberg2019). These findings demonstrate that the LPP is well-suited to index blunted emotional processing of pleasant stimuli in depression (Proudfit, Bress, Foti, Kujawa, & Klein, Reference Proudfit, Bress, Foti, Kujawa and Klein2015).
Both reward sensitivity as indexed by the RewP and emotional reactivity indexed by the LPP have been discussed as candidate mechanisms of anhedonia (Foti, Novak, Hill, & Oumeziane, Reference Foti, Novak, Hill, Oumeziane, Sangha and Foti2018). While alterations in both ERPs have been linked to depression separately, it is unclear if variability in the RewP and LPP index unique or overlapping variance in major depressive disorder (MDD). That is, it is unknown whether reductions in RewP and LPP might reflect distinct groups of depressed individuals. The primary goal of the current study was to determine whether the decreased RewP and LPP in depression are manifestations of the same underlying neurocognitive deficit (i.e. if they distinguish MDD from controls based on shared variance) – or if they are independent pathophysiological phenomena in depression (i.e. if blunted RewP and LPP index different variance within MDD). To this end, we first sought to replicate both a reduced RewP as well as reduced LPP to positive emotional stimuli in a relatively large sample of adults with current diagnosed depression (N = 83) in comparison to a group of adults without current or previous depression (N = 45). We then further examined whether the RewP and LPP were independently related to MDD status. In addition, we investigated the association of both ERPs with clinical measures of interest that have been linked to blunted reward processing in depression (Foti et al., Reference Foti, Carlson, Sauder and Proudfit2014). Specifically, we examined how each neural measure related to self-reported anhedonia and mood reactivity characteristic of melancholic depression. Since the current study included participants with a relatively wide age range, we further explored age as a moderator of these associations. Finally, we examined whether the RewP and LPP could be used together to improve the classification accuracy of MDD in the current study.
Methods
Participants
Participants were recruited from the community via online advertisement (i.e. on facebook.com), through the psychology clinic at Florida State University (FSU), word of mouth and community postings. Participants were included in the MDD group if they met diagnostic criteria for a current mood disorder, i.e. current MDD and/or persistent depressive disorder (PDD), and scored equal or higher than 13 on the BDI-II (Beck, Steer, & Brown, Reference Beck, Steer and Brown1996) for depressive symptoms in the past 2 weeks. Exclusion criteria for the MDD group were the presence of a lifetime diagnosis of a bipolar or psychotic disorder, or a current substance or alcohol use disorder, whereas the presence of other current comorbid disorders was assessed (see the ‘Results’ section), but did not lead to exclusion. Participants were included in the healthy control group if they never met diagnostic criteria for a mood disorder, did not currently meet criteria for any other psychiatric disorder, and scored not higher than 13 in the BDI-II.
Potential participants first underwent a SCID-based screening during initial telephone contact to increase odds of a potential fit with inclusion and exclusion criteria, before being invited to the lab for a full clinical interview. Groups were matched for age, gender and level of education. All participants had normal or corrected-to-normal vision, no history of head trauma or neurological disease, and were between 18 and 60 years of age. Prior to participation, volunteers received verbal and written explanations of aims and procedures of the study and provided informed written consent. The study was conducted in accordance with the ethical guidelines of the Declaration of Helsinki and approved by the Florida State University Institutional Review Board. All participants were reimbursed for study participation (i.e. $20 per hour) and received $7.50 for completing the reward task. Data were collected during a single visit of a 2-visit protocol, and the results from other assessed measures (e.g. eye-tracking and fMRI) will be analyzed and presented separately. The final study sample included 83 individuals with a current depressive disorder (MDD) and 45 healthy comparison participants (HC). For the reward task, four datasets (HC: n = 2, MDD: n = 2) had to be excluded due to bad data quality after visual inspection, resulting in available datasets of 81 MDD and 43 HC participants. Three participants chose not to perform the passive viewing task and two datasets (HC: n = 1, MDD: n = 1) were excluded due to bad data quality, resulting in a subsample of 80 MDD and 42 HC participants for the picture viewing task. Accordingly, EEG data of 78 MDD and 40 HC participants were available for analyses that combined from both tasks.
Measures
The presence of current and past mood disorders was assessed in all participants with the Structured Clinical Interview for DSM-5 (SCID-5-RV; First, Williams, Karg, and Spitzer, Reference First, Williams, Karg and Spitzer2015) by two Ph.D. level clinical psychologists. The SCID is a reliable interview (Lobbestael, Leurgans, & Arntz, Reference Lobbestael, Leurgans and Arntz2011) for current and past DSM-5 diagnoses. As part of the SCID assessment, we also determined impairment of mood reactivity, which is assessed as a core symptom of the melancholic subtype of depression and had previously been linked to a reduced RewP in depression (Foti et al., Reference Foti, Carlson, Sauder and Proudfit2014). Other past and present psychopathology was evaluated using the Mini-International Neuropsychiatric Interview (M.I.N.I.; Sheehan et al., Reference Sheehan, Lecrubier, Sheehan, Amorim, Janavs, Weiller and Dunbar1998), updated for DSM-5 (version 7.0.2). The M.I.N.I. is a highly reliable (Sheehan et al., Reference Sheehan, Lecrubier, Sheehan, Janavs, Weiller, Keskiner and Dunbar1997) structured interview that is widely used for evaluating diagnoses of psychiatric disorders. Participants in both groups further rated their depressive symptoms with the Beck Depression Inventory-II (BDI-II; Beck et al., Reference Beck, Steer and Brown1996). The total score derived from 21 items ranges from 0 to 63. The BDI-II is a well-validated measure of depressive symptom severity with good psychometric properties. In the current sample, internal consistency was good (Cronbach's α; MDD: α = 0.86; HC: α = 0.80). Further, participants completed the anhedonia subscale of the personality inventory for DSM-5 (PID-5; Krueger, Derringer, Markon, Watson, and Skodol, Reference Krueger, Derringer, Markon, Watson and Skodol2012), which encompasses eight items rated on a 4-point Likert scale. The Cronbach's α in the current sample was good to excellent (MDD: α = 0.90; HC: α = 0.87).
Electroencephalogram recording
The electroencephalogram (EEG) was recorded using an active electrode EEG-system (ActiCHamp, Brain Products GmbH) with 32 scalp electrodes positioned in accordance with the 10-20-system (ActiCAP, Brain Products GmbH). Electrode Cz served as a recording reference, a ground electrode was placed on the forehead, two of the electrodes were attached to the mastoids and the electrooculogram was recorded from four additional electrodes: two approximately 1 cm above and below the left eye, two at the outer canthi of both eyes. Continuous EEG signals were recorded at a sampling rate of 1000 Hz using a bandpass recording filter of 0.01–100 Hz.
EEG tasks
The doors task was administered using Presentation software (Neurobehavioral Systems, Albany, California). It consisted of three blocks of 20 trials, each beginning with the presentation of two identical images of doors. Participants were instructed to select the left or right door by clicking the left or right mouse button, respectively. Participants were informed that they could either win $0.50 or lose $0.25 on each trial, that they would earn their total winnings, and to try to win as much money as possible. The images of the doors were presented until participants made a selection. Then, a fixation cross was displayed for 1000 ms, followed by the feedback stimulus presented for 2000 ms. A gain was indicated by a green arrow pointing upward, while a loss was indicated by a red arrow pointing downward. Then, another fixation cross was presented for 1500 ms, followed by the prompt ‘Click for next round’, until participants responded with a button click to initiate the next trial. Across the 60 trials, gains and losses were equally frequent and presented pseudo-randomly.
The picture viewing task comprised 60 pictures selected from the International Affective Picture System (IAPS; Lang, Bradley, and Cuthbert, Reference Lang, Bradley and Cuthbert2008); 30 pleasant images (e.g. erotic and affiliative images) and 30 neutral images (e.g. objects, humans with neutral facial expression; specific IAPS picture numbers are listed in the Appendix). Normative IAPS ratings indicated that the 30 pleasant images were rated as more pleasant (valence M = 6.76, s.d. = 0.34) than the 30 neutral images (valence M = 5.36, s.d. = 0.53; p < 0.001), but also normative arousal ratings were higher for pleasant pictures (arousal M = 6.22, s.d. = 0.56) than for neutral pictures (arousal M = 3.10, s.d. = 0.75; p < 0.001). All pictures were presented in random order across three blocks of 20 trials. Each trial began with a fixation cross with a random duration of 500–900 ms. Then pictures were presented for 1500 ms, spanning approximately 15 by 20 degrees of visual angle. After picture offset, a blank screen was presented for a 500–900 ms ITI. Participants were instructed to focus on the screen and simply view the pictures. All participants completed the doors task first and the passive viewing task second.
Data analysis
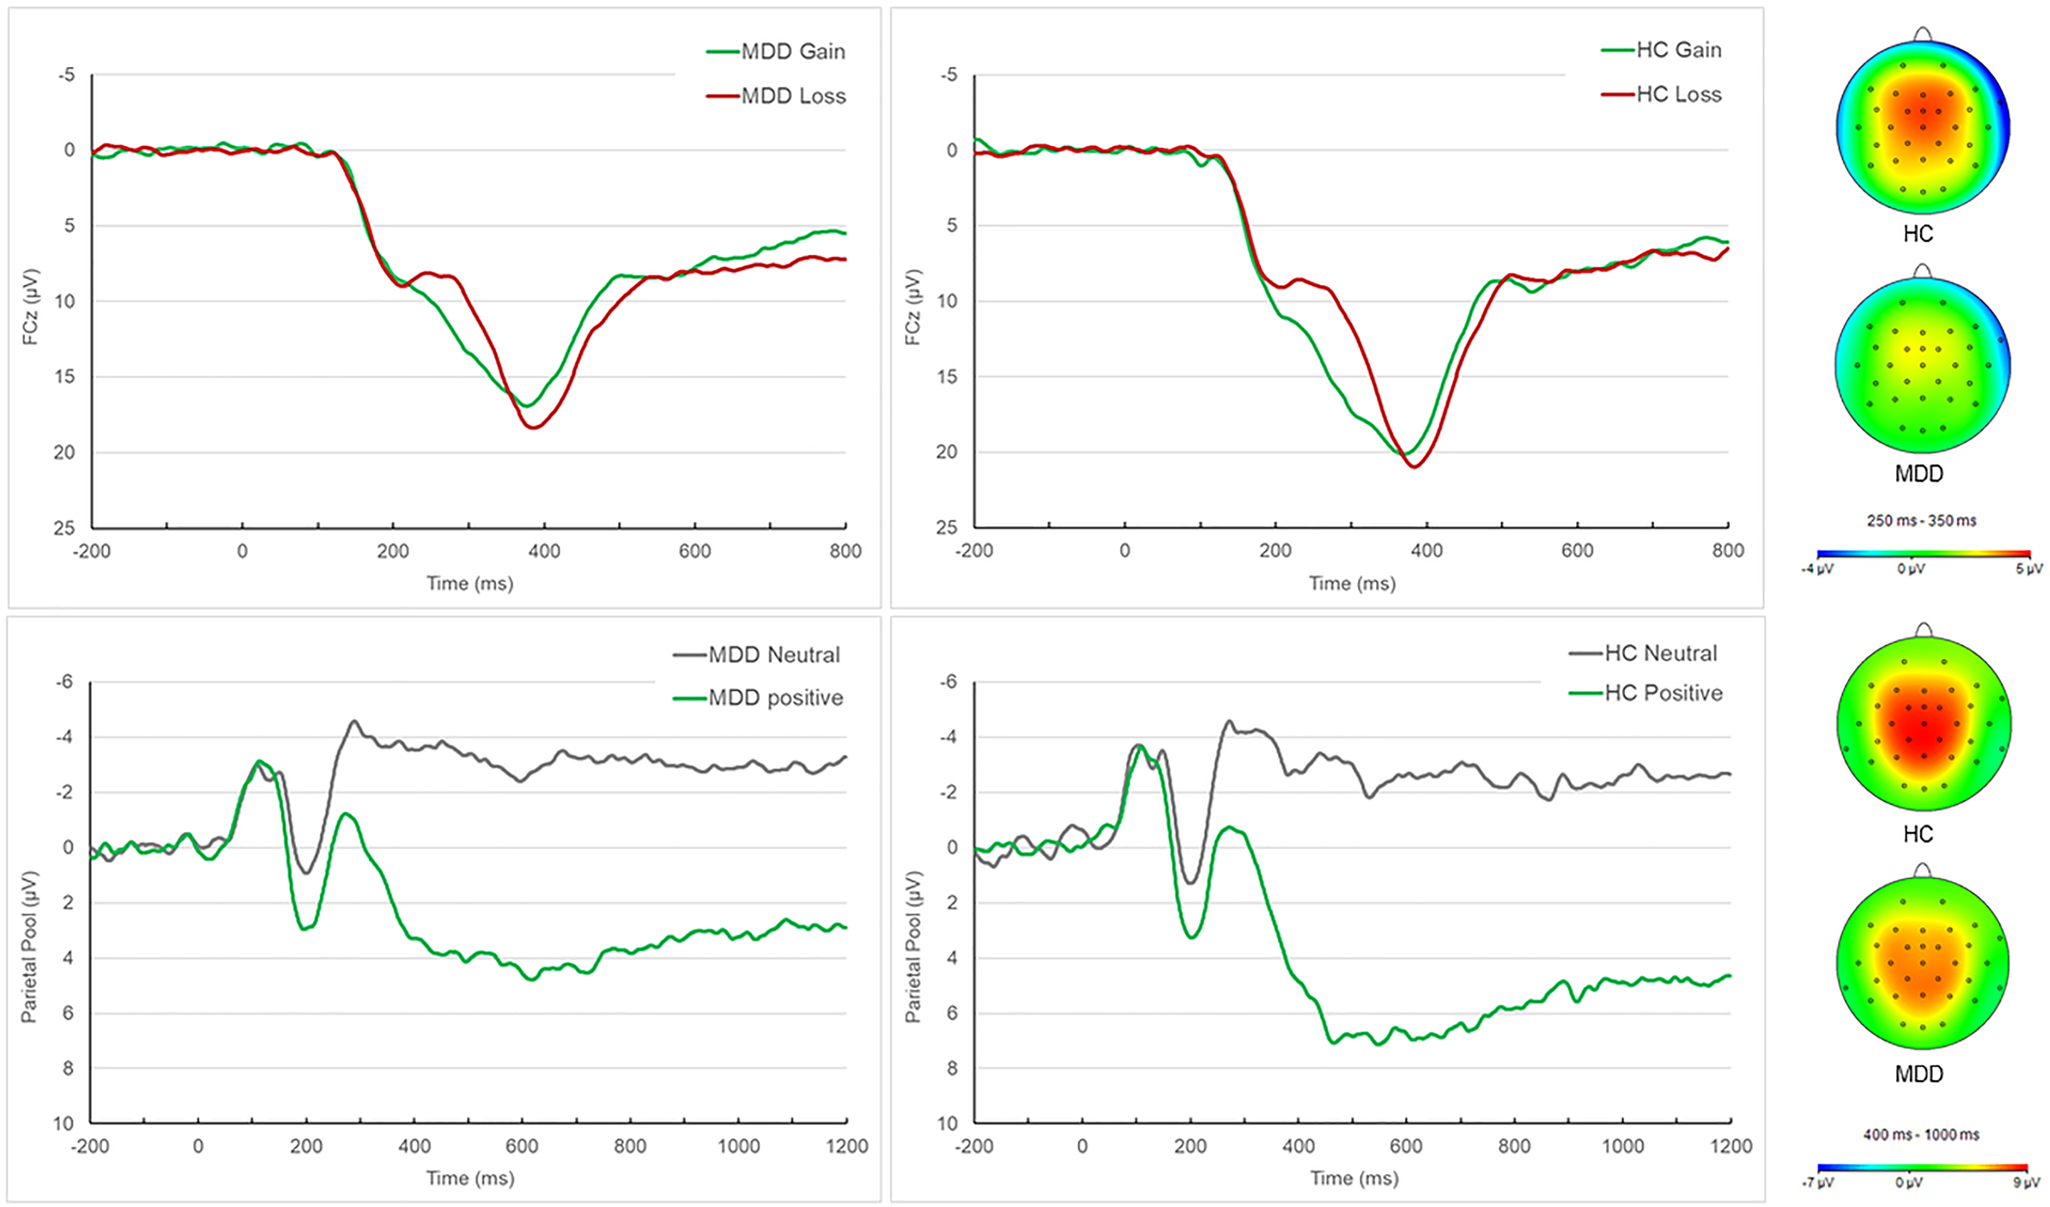
EEG data were processed using Brain Vision Analyzer, Version 2.1 (Brain Products, Gilching, Germany). Data were referenced to the average of the mastoid electrodes and filtered from 0.01 to 30 Hz (Butterworth, 4th order). For the doors task, feedback-locked epochs were extracted with a duration of 1000 ms, beginning 200 ms before feedback presentation, and corrected for eye movement artifacts using the algorithm developed by Gratton, Coles, and Donchin (Reference Gratton, Coles and Donchin1983). Segments that contained voltage steps >50 mV between sample points, a voltage difference of 175 mV within a 400 ms interval, or a maximum voltage difference of <0.5 mV within 100 ms intervals were automatically rejected. Additional artifacts were identified and removed based on visual inspection. Baseline-correction was applied using the 200 ms pre-stimulus interval. In accordance with previous studies, feedback-locked ERPs were averaged separately for gains and losses and scored as mean amplitudes from 250 to 350 ms after feedback presentation at electrode FCz (e.g. Foti et al., Reference Foti, Carlson, Sauder and Proudfit2014). For the picture-viewing task, epochs from 200 ms before until 1200 ms after picture onset were extracted. Processing steps were identical to those described above – with the exception that stimulus-locked averages were calculated separately for pleasant and neutral images, and the LPP was quantified at a parietal electrode-pool (Pz, Cz, CP1 and CP2) as the mean amplitude from 400 to 1000 ms after picture-onset (e.g. Weinberg et al., Reference Weinberg, Perlman, Kotov and Hajcak2016).
All statistical analyses were conducted with IBM SPSS Statistics, version 23.0 (IBM, Armonk, NY). A significance level of α = 0.05 was applied to all analyses, no corrections for multiple comparisons were applied. Demographic and self-report data were analyzed with t tests, with the exception of gender, analyzed with a χ2 test.
Group comparison of the feedback-locked ERPs from the doors task was performed using binary logistic regression with the ERPs to gain and loss simultaneously entered as independent predictors of diagnostic group status (MDD, HC). Group differences in the LPP were analogously examined with a logistic regression with the LPP to pleasant and neutral pictures entered as independent predictors. Finally, a combined binary logistic regression was performed, with ERPs for gain and loss feedback, and for pleasant and neutral pictures simultaneously entered as predictors of depression status. For correlational and classification analyses, we determined residualized difference measures for the RewP and LPP by saving the unstandardized residuals in linear regressions predicting gain ERP from loss ERP (i.e. RewPresid) and predicting LPP to pleasant images from LPP to neutral images (i.e. LPPresid), respectively. To investigate the utility of both ERPs to predict MDD status, receiver operating characteristic (ROC) analyses were performed using RewPresid and LPPresid as indicators. First, the predictive utility of both ERPs was assessed independently, then in combination applying an in series (i.e. ‘or’) approach (Meyer, Nelson, Perlman, Klein, & Kotov, Reference Meyer, Nelson, Perlman, Klein and Kotov2018; Nelson et al., Reference Nelson, Perlman, Klein, Kotov and Hajcak2016). Both ERPs were continuous measures; therefore, sensitivity, specificity, positive and negative predictive value, and accuracy were calculated based on a range of cutoffs (−0.5, −1.0 and −1.5 standard deviations from the mean). Finally, within the MDD group, Pearson correlations were performed to examine the relation of RewPresid and LPPresid with the variables: age, BDI-II, PID-5 anhedonia and the symptom of impaired mood reactivity assessed with the SCID. As the current sample encompassed a much wider age range than previous studies, we further explored age as a moderator of these associations, by analyzing moderated linear regression using model 1 of the process macro for SPSS (version 3.1; Hayes, Reference Hayes and Little2017). Both predictors were mean-centered before entered into the regression, significant interactions were probed using the Johnson–Neyman technique.
Results
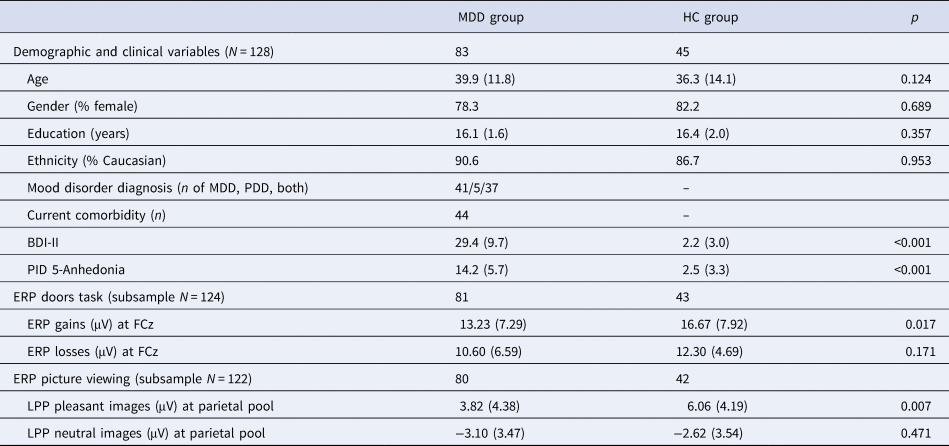
Demographic and clinical characteristics of the MDD and HC groups are presented in Table 1. No significant group differences were present with respect to age, gender ratio, ethnicity or educational level, all p > 0.124. In the MDD group, 43 individuals (51.8%) were currently taking psychotropic medication (antidepressants, n = 36; anxiolytics, n = 15; anticonvulsants, n = 7; stimulants, n = 5; other n = 7), 44 individuals (53.0%) met diagnostic criteria for one or more comorbid psychiatric diagnoses, as follows: generalized anxiety disorder (n = 21), social anxiety disorder (n = 15), specific phobia (n = 4), panic disorder (n = 16), agoraphobia (n = 5), obsessive-compulsive disorder (n = 7), post-traumatic stress disorder (n = 4), eating disorders (n = 8). Of the participants currently meeting diagnostic criteria for MDD, the following DSM-5 subtypes were present: with anxious distress (n = 62), with mixed features (n = 2), with melancholic features (n = 48), with atypical features (n = 10). Within those with current PDD, both the DSM-5 subtype with anxious distress (n = 32) and with atypical features (n = 15) were evident. Within the MDD group, 36 individuals reported impaired mood reactivity during the current episode.
Demographic and clinical variables and ERP data for the groups of participants with a current diagnosis of depression (MDD) and participants without current psychiatric disorder (HC)

BDI-II, Beck Depression Inventory-II; LPP, late positive potential.
Note: Means are displayed, standard deviations are in parentheses.
ERP results
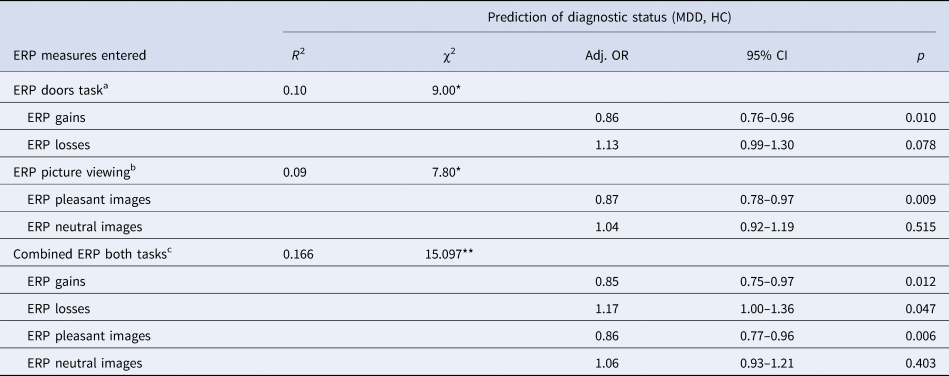
Figure 1 presents the grand average ERP waveforms for the doors task and picture viewing task; mean values of ERPs are presented in Table 1. Results of the logistic regression using ERPs from the doors task as predictors of diagnostic depression status indicated a significant model (see Table 2 for statistics). Reduced ERP to gains emerged as a significant predictor of depression status; in contrast, the ERP to loss was at trending significance in the opposite directionFootnote 1Footnote †. The analogous logistic regression with the picture viewing ERPs as predictors of depression also showed a significant model (Table 2) wherein reduced LPP to pleasant images predicted depression status, whereas the LPP to neutral pictures did not. The logistic regression using ERPs from both tasks as independent predictors of depression status yielded a significant prediction model (Table 2), wherein both the ERP to gain feedback and in the opposite direction loss feedback, as well as the LPP to pleasant pictures were significant independent predictors of depression status, while the LPP to neutral pictures was notFootnote 2.
Top panel: Grand average waveforms for gain and loss trials and headmaps displaying the scalp distribution for the gain-loss difference during the time interval from 250 to 350 ms following feedback in the group of participants with current depressive disorder (MDD) and the healthy participants group (HC). Bottom panel: Grand average waveforms for pleasant and neutral images and headmaps displaying the scalp distribution for the pleasant-neutral difference during the time interval from 400 to 1000 ms following picture presentation in the group of participants with current depressive disorder (MDD) and the healthy participants group (HC).

Results of the logistic regression analyses predicting diagnostic status (MDD, HC) from ERPs of both experimental tasks
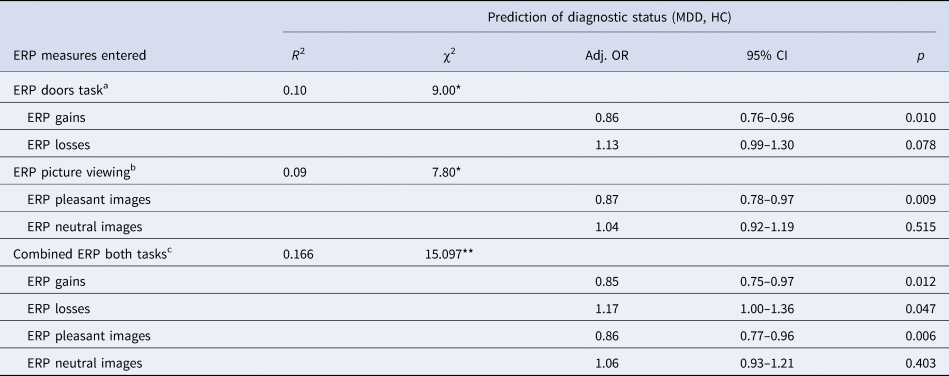
Adj. OR, adjusted odds ratio.
Note: Logistic regression was used to predict the dichotomous dependent variable diagnosis of depression (0 = absent, 1 = present).
The Nagelkerke R 2 and χ2 statistics are reported for the logistic regression models.
a Subsample doors task, MDD: n = 81, HC: n = 43.
b Subsample picture viewing task, MDD: n = 80, HC: n = 42.
c Subsample combined tasks, MDD: n = 78, HC: n = 40.
**p < 0.01, *p < 0.05.
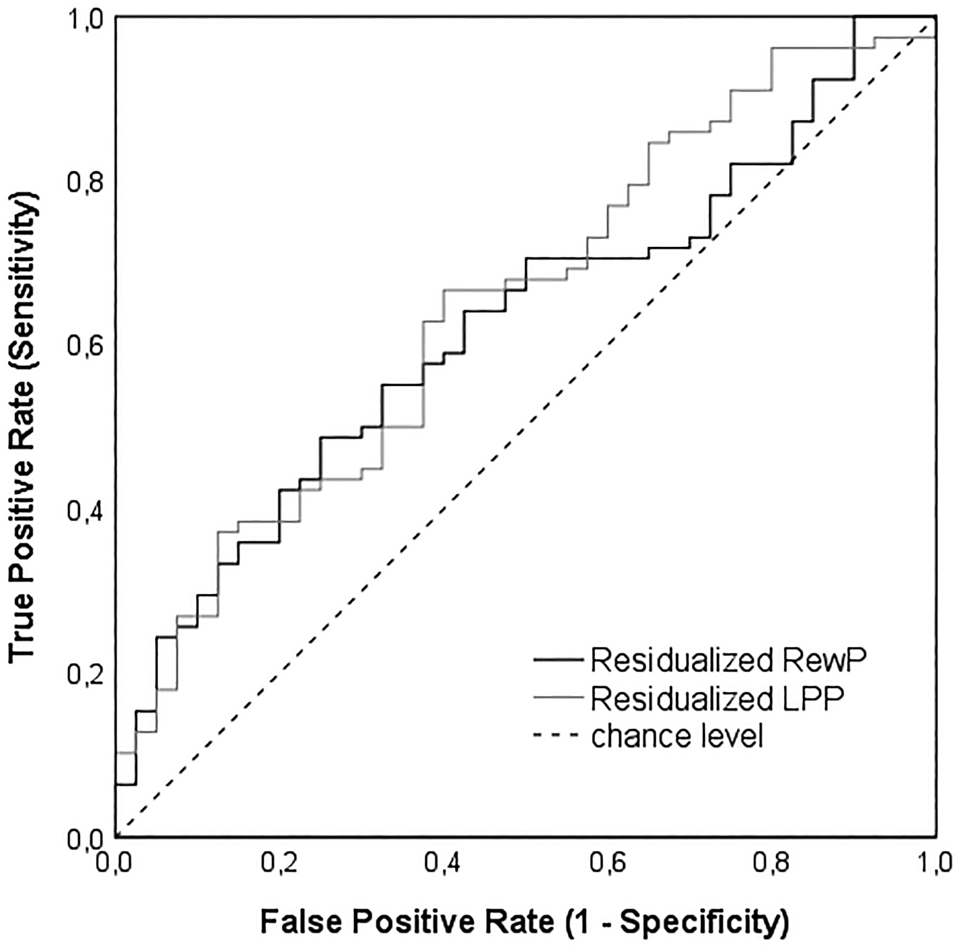
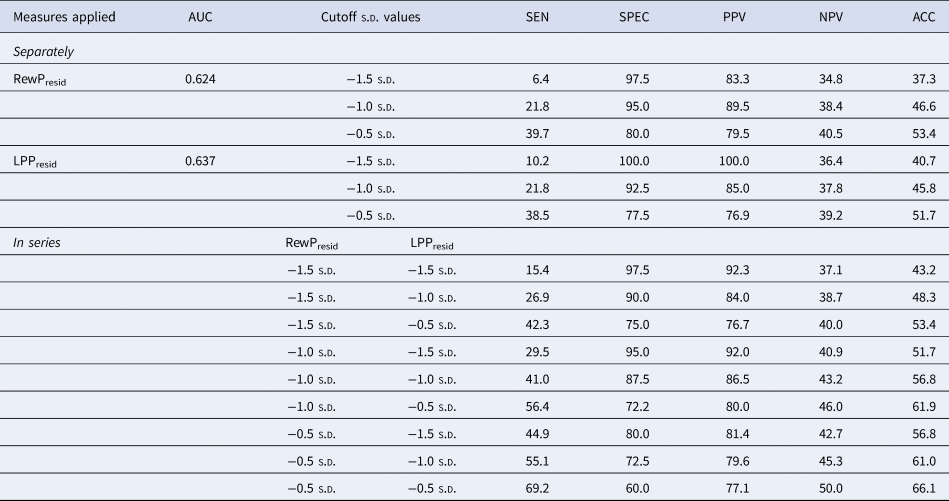
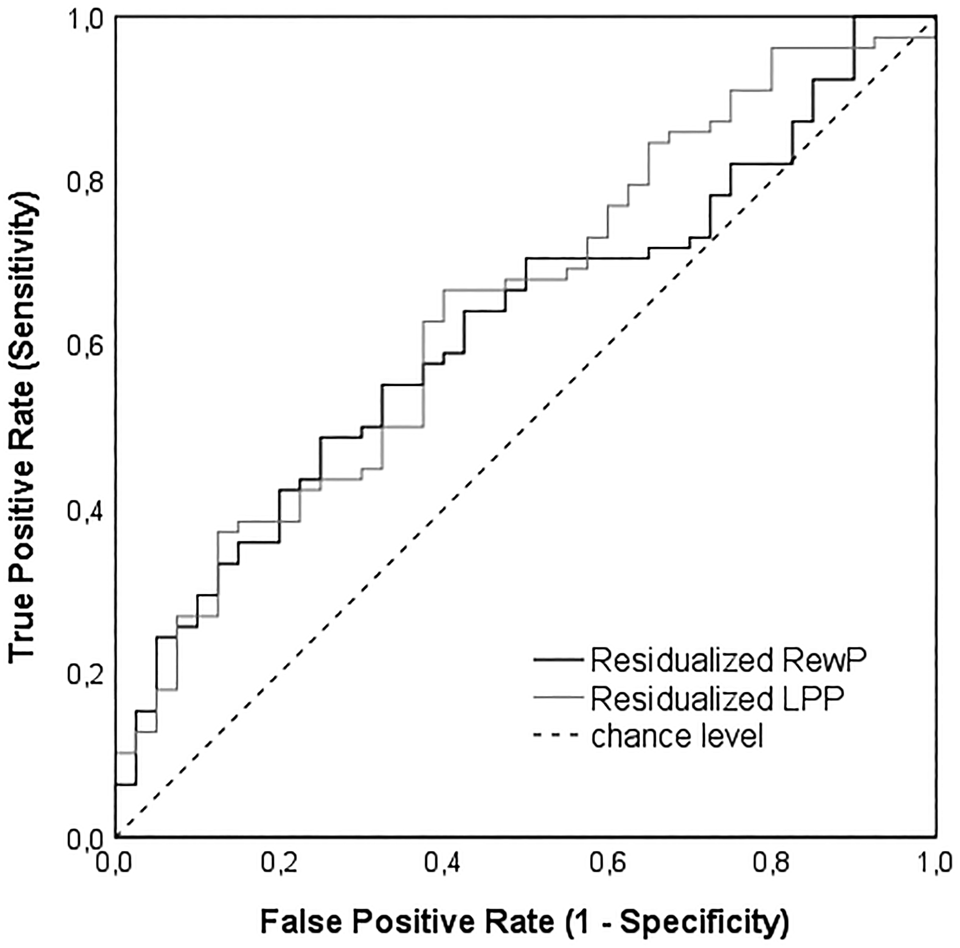
Results of the ROC analyses for the RewPresid and LPPresid as separate classifiers of depression status are presented in Table 3 and Fig. 2. Both ERP measures provided high specificity but relatively low sensitivity. The highest achieved classification accuracy for each measure alone was 53.4% for the RewPresid and 51.7% for the LPPresid at the −0.5 s.d. thresholds, respectively. Classification results for both ERPs employed in series are also presented in Table 3. Using both measures in series, classification accuracy increased considerably to 66.1% at the −0.5 s.d. threshold for both measures. Similarly, sensitivity was substantially increased, while specificity was moderately decreased.
ROC curves for the RewPresid and LPPresid as independent predictors of diagnostic group status (MDD: n = 78, HC: n = 40).
Sensitivity, specificity, positive predictive value, negative predictive value and accuracy for residualized ERP response to gain feedback (RewPresid) and residualized ERP to pleasant pictures (LPPresid) predicting diagnostic depression status (HC, MDD) applied separately and in series i.e. using the ‘or’ approach
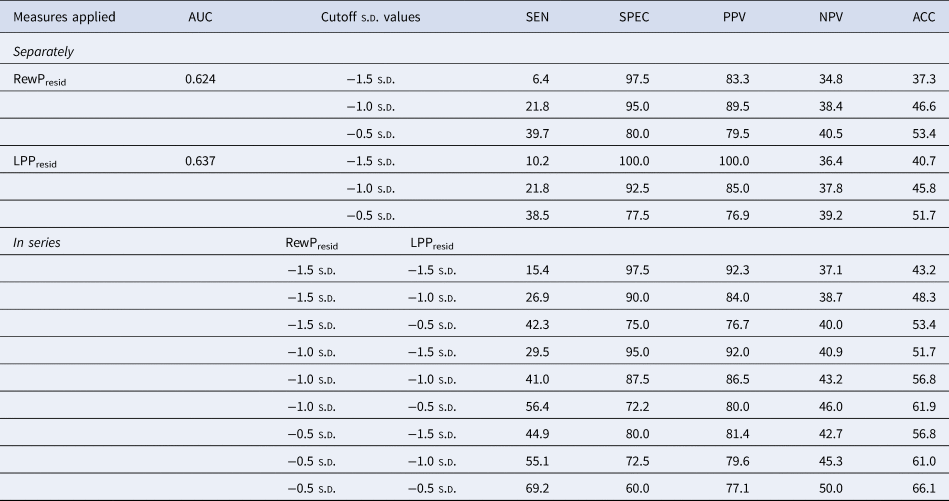
SEN, sensitivity; SPEC, specificity; PPV, positive predictive value; NPV, negative predictive value; ACC, accuracy.
Note: Subsample combined tasks, N = 118 (MDD: n = 78, HC: n = 40).
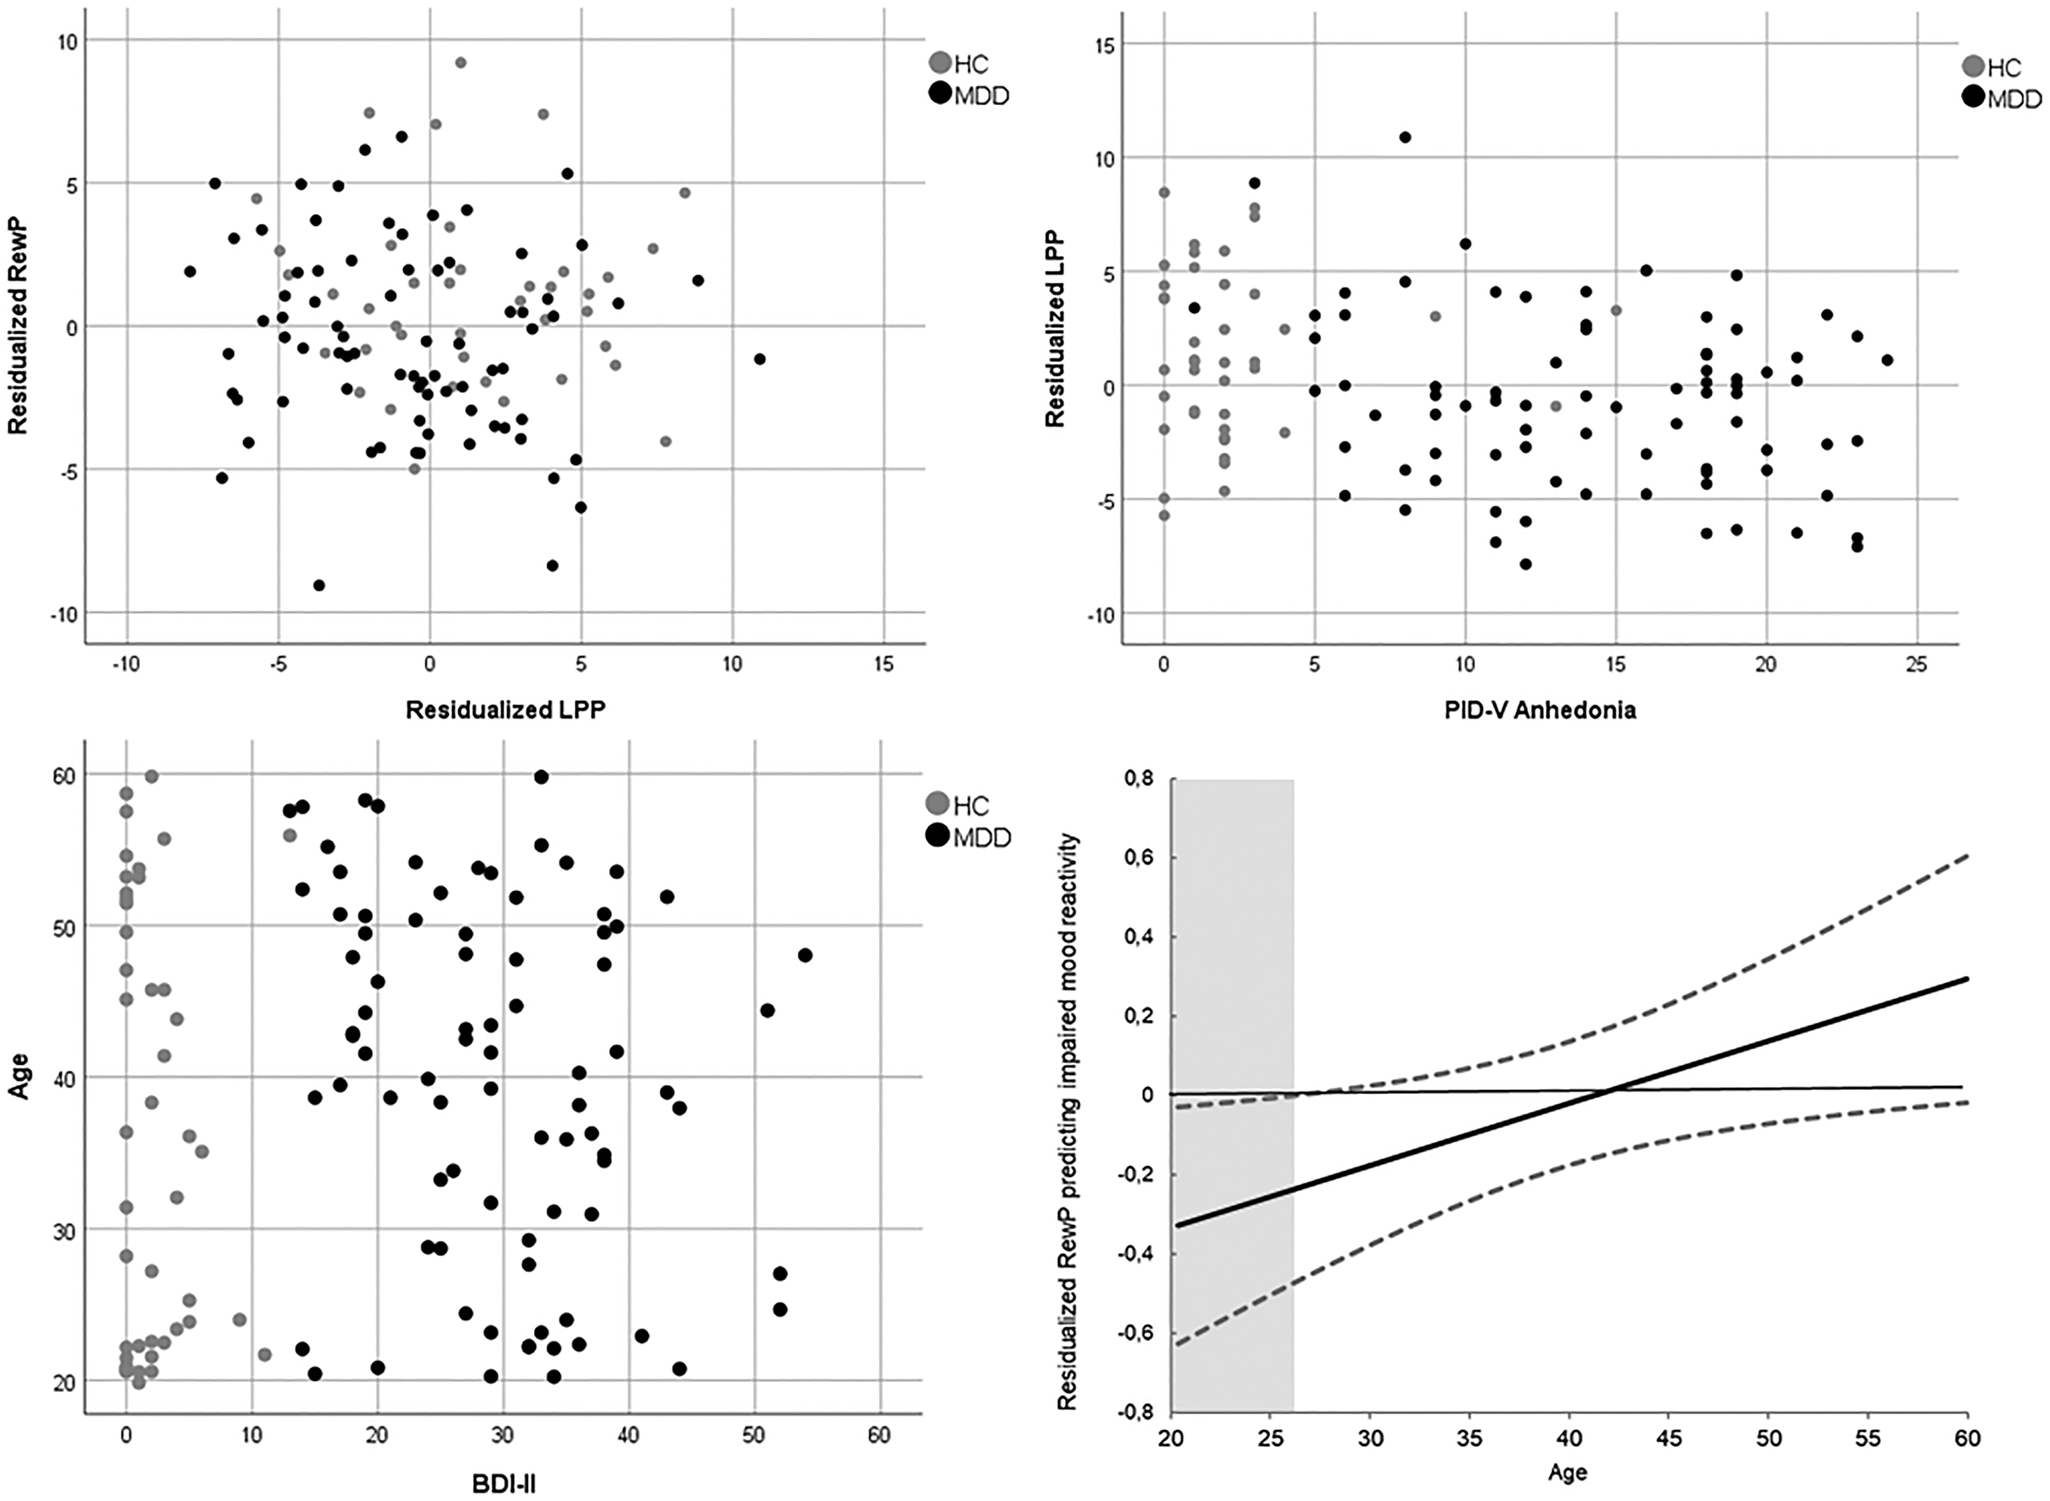
Correlations between the main variables of interest in both groups are presented in Fig. 3 and in the online Supplementary Materials (Table S1 and Figure S1). Consistent with the observation that the LPP and RewP predicted unique variance in MDD diagnoses, there were no significant correlations between the residualized LPP and RewP, in the MDD group, r = −0.142, p = 0.216, the HC group, r = −0.07, p = 0.677, or across both groups, r = −0.06, p = 0.532. Within the MDD group, LPPresid was significantly associated with self-reported severity of anhedonia, r = −0.225, p = 0.045, whereas there was no correlation with the other measures of interest (i.e. age, BDI, lack of mood reactivity; all p > 0.359). Also, the association of LPPresid with anhedonia was not moderated by age (p = 0.451). For RewPresid, analyses within the MDD group did not indicate significant associations with the investigated measures (all p > 0.151). However, results of the moderation analysis, presented in Table 4, indicated a significant logistic regression model, wherein age moderated the association of RewPresid with mood reactivity. This model indicated that RewPresid predicted impaired mood reactivity only at younger ages, i.e. in the lowest 19.8% of participants in the current study, which corresponds to an age of 26.2 years or below (Fig. 3).
Left top panel: Scatterplot of RewPresid and LPPresid in the group of participants with current depressive disorder (MDD) and the healthy participants group (HC) (MDD: n = 78, HC: n = 40); right top panel: scatterplot of LPPresid with PID-V anhedonia score in MDD and HC group (MDD: n = 80, HC: n = 42). Left bottom panel: Scatterplot of age and BDI-II in MDD and HC group (MDD: n = 83, HC: n = 45); right bottom panel: probability of impaired mood reactivity as predicted by RewPresid moderated by age in the MDD group (n = 81).

Results of the logistic regression predicting lack of mood reactivity within the MDD group from RewPresid including age as moderator

Note: The Nagelkerke R 2 and χ2 statistics are reported for the logistic regression model. Subsample doors task, MDD: n = 81. *p < 0.05.
Discussion
In the current study, adults with a current depressive disorder were characterized by overall blunted neural response to reward feedback as compared to a healthy group of participants. This finding replicates with previous ERP studies of reward processing in MDD (Brush et al., Reference Brush, Ehmann, Hajcak, Selby and Alderman2018; Foti et al., Reference Foti, Carlson, Sauder and Proudfit2014; Liu et al., Reference Liu, Wang, Shang, Shen, Li, Cheung and Chan2014) and further replicates the reduced RewP in MDD within a larger clinical sample relative to past studies. Moreover, we were able to show that this blunted reward responsivity was not associated with overall symptom severity and independent from medication status or current comorbidity. In contrast to some previous studies (Foti et al., Reference Foti, Carlson, Sauder and Proudfit2014; Liu et al., Reference Liu, Wang, Shang, Shen, Li, Cheung and Chan2014), we did not find a direct association with self-reported anhedonia. However, blunted neural reward responses were associated with impaired mood reactivity, a core symptom of the melancholic subtype of depression, only in younger MDD participants. This finding is generally consistent with a previous study (Foti et al., Reference Foti, Carlson, Sauder and Proudfit2014) reporting an overall association between RewP and mood reactivity in a sample of younger adults with MDD. In comparison, the current sample included a larger group of participants with depression spanning a wider age range. The current findings suggest that the association between impaired mood reactivity and the RewP may only be evident among younger depressed individuals – and that the specific phenotype related to alteration in reward responsivity needs further elucidation. It is also worth noting that age is at least partially related to potential illness duration, which might be a potential factor that could impact the association between reward sensitivity and mood reactivity in depression over time. While these data are generally in line with a recent meta-analysis indicating more robust association of blunted RewP with depression in adolescent than adult samples (Keren et al., Reference Keren, O'Callaghan, Vidal-Ribas, Buzzell, Brotman, Leibenluft and Stringaris2018), further investigation is needed to elucidate this potential change in relationship between the RewP and anhedonia with age.
The current study also found a significantly blunted LPP to pleasant images in adults with MDD compared to the healthy control group. This finding is in line with previous reports of reduced LPP to pleasant images in adult depression (Foti et al., Reference Foti, Olvet, Klein and Hajcak2010; MacNamara et al., Reference MacNamara, Kotov and Hajcak2016; Weinberg et al., Reference Weinberg, Perlman, Kotov and Hajcak2016; Weinberg et al., Reference Weinberg, May, Klonsky, Kotov and Hajcak2017). Moreover, the blunted response to pleasant pictures was associated with self-reported severity of anhedonia among those with MDD – and this association was invariant with respect to age. While previous research has mostly linked anhedonia in depression to impaired neural measures of reward processing (e.g. the reward positivity), the association between anhedonia and reduced neural reactivity to pleasant stimuli represents a promising avenue for further research on anhedonia and the pathophysiology of depression.
Critically, abnormalities in the RewP and LPP were independently related to MDD status. That is, reduced neural activity to reward and pleasant pictures predicted unique variance in the MDD group – and both measures could be leveraged together to better distinguish individuals with current depression from healthy individuals without a history of depression. Although depression has been associated with both a blunted RewP and LPP in previous research (Proudfit et al., Reference Proudfit, Bress, Foti, Kujawa and Klein2015), no study to date had simultaneously assessed both neural measures in the same individuals with clinical depression. Consistent with the fact that both measures were uniquely related to MDD status, the RewP and LPP were uncorrelated in the current study. These data point toward the existence of two distinct aberrant neurocognitive processes in the pathophysiology of depression, indexed by reductions in the RewP and the LPP to pleasant pictures. While both these measures are inherently linked to the broad construct of anhedonia (i.e. through their association with reward and positive emotional stimuli), they appear to represent two dissociable sub-phenomena (Foti et al., Reference Foti, Novak, Hill, Oumeziane, Sangha and Foti2018). This further suggests the possibility that two independent subtypes of depression might exist that could be defined based on neurophysiological dysfunctions. The differential associations of both ERPs with clinical characteristics identified in the current study further support this notion. Thus, the study was able to demonstrate that blunted reward processing and diminished reactivity to pleasant images are indicators of two independent deficits in MDD (Proudfit et al., Reference Proudfit, Bress, Foti, Kujawa and Klein2015): reward insensitivity and emotional disengagement may be important and distinct endophenotypes related to MDD – a possibility that will need to be further explored in future studies.
Consistent with the notion that the LPP and RewP were associated with unique variance in MDD, signal detection analyses further confirmed that the ability to classify MDD participants increased when both the residualized RewP and LPP were utilized in combination. Specifically, when RewP and LPP were applied in series (i.e. in an ‘or’-based fashion), sensitivity and overall classification accuracy was improved. This likely indicates that both ERP measures, as indicative of different neurocognitive alterations, can be leveraged to identify different individuals with depression. Of note, both tasks are brief, and thus it would be feasible to integrate them into clinical assessments, even on a regular basis. In this way, ERPs could have significant clinical utility, and might potentially be leveraged for novel screening and prevention efforts (Hajcak, Klawohn, & Meyer, Reference Hajcak, Klawohn and Meyer2019).
The current study has limitations worth noting. The sample of participants was fairly homogeneous in sex and ethnicity; thus, it remains unclear whether the current results would generalize to more diverse samples. The pleasant pictures used for eliciting the LPP differed from neutral pictures on normative ratings of both valence and arousal. Although previous research would suggest that the current results would generalize to unpleasant pictures (Foti et al., Reference Foti, Olvet, Klein and Hajcak2010; Weinberg et al., Reference Weinberg, Perlman, Kotov and Hajcak2016), it is not possible to definitively say whether deficits in emotional reactivity to pleasant stimuli in MDD participants would generalize to unpleasant pictures. Finally, the study was cross-sectional in nature; thus, it is unknown if the observed alterations in RewP and LPP in current depression are state-dependent, or if they persist after symptom remission. We are currently following participants from this study to examine how both the RewP and LPP relate to the persistence or remission of specific symptoms of depression.
In summary, the current study found that the RewP and LPP were both independently reduced in MDD – suggesting that reward insensitivity and emotional disengagement may reflect unique deficits or neurophysiological sub-types in depression. This possibility was further corroborated by differential associations of the RewP and LPP with clinical characteristics within the depressed group. Our data suggested an age-limited association between a reduced RewP and mood reactivity, and a more general association between a reduced LPP to pleasant pictures and anhedonic severity.
Supplementary material
The supplementary material for this article can be found at https://doi.org/10.1017/S0033291719003659
Acknowledgements
The authors wish to thank Dr Kristen Schmidt for contributing her clinical expertise.
Financial support
Portions of this study were funded by Google LLC. The funding source had no influence on study conduction or result evaluation.
Conflict of interest
The authors declare no conflicts of interest.
Appendix
Pictures used in the current study (IAPS numbers):
Rewarding images: 4599, 4604, 4606, 4607, 4608, 4611, 4623, 4624, 4641, 4643, 4650, 4651, 4652, 4656, 4658, 4659, 4660, 4664, 4668, 4670, 4676, 4680, 4683, 4687, 4689, 4693, 4694, 4695, 4697, 4698.
Neutral images: 7025, 7150, 7491, 7175, 7055, 7010, 7034, 7002, 7185, 7161, 7041, 7000, 7004, 5471, 5740, 7547, 7500, 7081, 7061, 7546, 7490, 7096, 5390, 7504, 7095, 7510, 7165, 5726, 7489, 5750.