Introduction
Terrestrial analogue studies are used to better understand the nature and rates of geological and biological processes on Earth in order to interpret and validate information from orbiting or surface missions on extraterrestrial bodies. These terrestrial analogue data complement the interpretation of missions such as Mars-Express, SMART-1, Chandrayaan-1, Lunar Reconnaissance Orbiter (LRO), Mars Exploration Rovers and Mars Reconnaissance Orbiter (MRO), and help to prepare for future lunar and planetary Lander missions. International cooperation in terrestrial analogue activities provides a logical early step to implementing international Moon–Mars missions (see ILEWG Reports and ICEUM Declarations 2006–2010 (ICEUM 9, 10, 11); Foing Reference Murray, Muller, Neukum, Werner, van Gasselt, Hauber, Markiewicz, Head, Foing and Page2008; Foing et al & ICEUM participants (Reference Murray, Muller, Neukum, Werner, van Gasselt, Hauber, Markiewicz, Head, Foing and Page2008b, Reference Murray, Muller, Neukum, Werner, van Gasselt, Hauber, Markiewicz, Head, Foing and Pagec, Reference Murray, Muller, Neukum, Werner, van Gasselt, Hauber, Markiewicz, Head, Foing and Paged, Reference Murray, Muller, Neukum, Werner, van Gasselt, Hauber, Markiewicz, Head, Foing and Pagee); MEPAG Report 2007; COSPAR Planetary Exploration Committee (PEX) Report 2010).
Surface science versus remote sensing
Surface science is one of the primary objectives of recent and future Mars and Moon missions. The geological record of Mars indicates a diversity of water-modified environments, including potential ancient habitable environments. Hydrated minerals on Mars trace the history of surface water and the global atmosphere and a long-term climate cycle (Christensen et al. Reference Christensen, Bandfield, Hamilton, Ruff, Kieffer, Titus, Malin, Morris, Lane and Clark2001; Bibring et al. Reference Bibring, Langevin, Mustard, Poulet, Arvidson, Gendrin, Gondet, Mangold, Pinet and Forget2006). Recent Moon missions advanced our knowledge on surface composition (Lucey et al. Reference Lucey, Blewett and Hawke1998; Jolliff et al. Reference Jolliff, Gillis, Haskin, Korotev and Wieczorek2000) and the bombardment history and indicated the presence of H2O and hydroxyl species on the lunar surface (Feldman et al. Reference Feldman, Maurice, Lawrence, Little, Lawson, Gasnault, Wiens, Barraclough, Elphic and Prettyman2001; Pieters et al. Reference Pieters, Goswami, Clark, Annadurai, Boardman, Buratti, Combe, Dyar, Green and Head2009). Science investigations include a wide range of activities from global mapping to microscopic scale. Significant new science results will be obtained from coordinated multi-instrument operations on the surface. In-situ investigations of rocks and soil or sample return missions both require the development of systematic multi-instrument protocols, characterization diagnostics and methods to merge data from various instruments. Remote sensing/ground truth validation will enhance the science exploitation of future missions.
Mars research context
Orbital remote sensing has revealed a complex geologic record of planet Mars that formed in response to processes that include volcanism, weathering/erosion, sedimentation, glaciation, polar ice cap processes, fluid/rock interactions and tectonism and others. Six spacecraft have unveiled a new face of Mars history (Mars Global Surveyor (MGS), Mars Odyssey, Mars-Express (MEX), the two Mars Exploration Rovers (MER) and MRO). Various minerals have been identified both from the orbit or from the Martian surface (Klingelhofer et al. Reference Klingelhöfer, Morris, Bernhardt, Schröder, Rodionov, de Souza, Yen, Gellert, Evlanov, Zubkov, Foh, Bonnes, Kankeleit, Gütlich, Ming, Renz, Wdowiak, Squyres and Arvidson2004; Squyres et al. Reference Squyres, Grotzinger, Arvidson, Bell, Calvin, Christensen, Clark, Crisp, Farrand, Herkenhoff, Johnson, Klingelhöfer, Knoll, McLennan, McSween, Morris, Rice, Rieder and Soderblom2004; Bibring et al. Reference Bibring, Langevin, Gendrin, Gondet, Poulet, Berthé, Soufflot, Arvidson, Mangold, Mustard and Drossart2005; Gendrin et al. Reference Gendrin, Mangold, Bibring, Langevin, Gondet, Poulet, Bonello, Quantin, Mustard, Arvidson and Le Mouélic2005; Poulet et al. Reference Poulet, Bibring, Mustard, Gendrin, Mangold, Langevin, Arvidson, Gondet and Gomez2005). For instance, the Gusev area has been studied both by the MER rover and MEX orbiter (Greeley et al. Reference Greeley, Foing, McSween, Neukum, Pinet, van Kan, Werner, Williams and Zegers2005; Parker et al. Reference Parker, Zegers, Kneissl, Ivanov, Foing and Neukum2010). Recent results revealed the timing and duration of hydrologic activity on Mars and the evolution of sedimentary processes through time. Water, an important ingredient for life, could also be trapped as underground ice. MEX high-resolution stereo camera HRSC images have been used to determine that volcanic activity continued until recent times (Neukum et al. Reference Neukum, Jaumann, Hoffmann, Hauber, Head, Basilevsky, Ivanov, Werner, van Gasselt, Murray and McCord2004). They indicate recent periglacial tropical activity (Murray et al. Reference Murray, Muller, Neukum, Werner, van Gasselt, Hauber, Markiewicz, Head, Foing and Page2005; Head et al. Reference Head, Neukum, Jaumann, Hiesinger, Hauber, Carr, Masson, Foing, Hoffmann and Kreslavsky2005a, Reference Head, Neukum, Jaumann, Hiesinger, Hauber, Carr, Masson, Foing, Hoffmann and Kreslavskyb), possibly the result of erratic variations of Mars obliquity. The past conditions of Mars may have eventually allowed life to develop (McKay & Stoker Reference McKay and Stoker1989). However, today, a combination of solar ultraviolet radiation, the extreme dryness of the soil and the oxidizing nature of the soil chemistry provides a toxic environment to biological and organic material on the surface or the near subsurface. Understanding the complex interactions between organic compounds and the soil mineralogy is vital for the potential detection of past or present life on Mars.
Moon research context
On the Moon we can study geological processes shaping the surface due to impacts, volcanism and space weathering. Recent lunar orbiters SMART-1 (Foing et al. Reference Foing, Racca, Marini, Evrard, Stagnaro, Almeida, Koschny, Frew, Zender, Heather, Grande, Huovelin, Keller, Nathues, Josset, Malkki, Schmidt, Noci, Birkl, Iess, Sodnik and McManamon2006, Reference Foing, Racca, Josset, Koschny, Frew, Almeida, Zender, Heather, Peters, Marini, Stagnaro, Beauvivre, Grande, Kellett, Huovelin, Nathues, Mall, Ehrenfreund and McCannon2008a, b, c, d, e), Selene Kaguya (Kato et al. Reference Kato, Sasaki, Tanaka, Iijima and Takizawa2008; Haruyama et al. Reference Haruyama, Matsunaga, Ohtake, Morota, Honda, Yokota, Torii and Ogawa2008, Reference Haruyama, Ohtake, Matsunaga, Morota, Honda, Yokota, Abe, Ogawa, Miyamoto and Iwasaki2009; Ono et al. 2009), Chandrayaan-1 (Goswami et al. Reference Goswami2008; Pieters et al. Reference Pieters, Goswami, Clark, Annadurai, Boardman, Buratti, Combe, Dyar, Green and Head2009), Chang'E1 and LRO (Chin et al. Reference Chin, Brylow, Foote, Garvin, Kasper, Keller, Litvak, Mitrofanov, Paige, Raney, Robinson, Sanin, Smith, Spence, Spudis, Stern and Zuber2007; Vondrak et al. Reference Vondrak, Keller, Chin and Garvin2010) have studied impact processes and surface morphologies such as terraces, ejecta, central peaks for a number of craters of various sizes and ages in different locations. Bulk crustal composition provides constraints on the origin and evolution of the Moon, the lunar crusts and the large basins (such as the South Pole-Aitken Basin, SPA) (Jolliff et al. Reference Jolliff, Gillis, Haskin, Korotev and Wieczorek2000). Measurements from orbit and existing lunar samples will enhance our knowledge on absolute chronology of the Moon and on the early or late heavy bombardment in the Solar System. The survival of exogenous ices and organics at lunar poles is also relevant in the astrobiology context.
Rationale for terrestrial campaigns
Extreme environments on Earth often provide similar terrain conditions to landing/operation sites on the Moon and Mars. In order to maximize scientific return of space missions, it is important to rehearse mission operations in the field and through simulations. Terrestrial field research campaign in support of future planetary missions often include investigations of the geological, geochemical, biological and environmental context of a site; in-situ analysis, drilling of cores and sampling. This approach allows the demonstration of remote control field rovers; improvement of instrument performance; and evaluating crew operations and Extra Vehicular Activity (EVA) technologies. In this paper, we describe the planning and protocol development for both in-situ and post-mission lab-analysis for the astrobiology research campaign at MDRS (MDRS website; http://desert.marssociety.org).
EuroGeoMars astrobiology field demonstration
The campaign EuroGeoMars 2009 was conducted in Utah (MDRS crew 76 and 77) and had four sets of objectives:
• Technology demonstration: a set of instruments were deployed, tested and assessed, and training was provided to scientists using them in subsequent rotations.
• Research aspects: a series of field science and exploration investigations were conducted in geology, geochemistry, biology and astronomy, with synergies with space missions and research from planetary surfaces and Earth extreme environments.
• Human crew-related aspects, i.e. (a) evaluation of the different functions and interfaces of a planetary habitat, (b) crew time organization in this habitat, (c) evaluation of man–machine interfaces of science and technical equipment.
• Education, outreach, communications, multi-cultural and public relations aspects.
The methodology of comprehensive measurements at selected sites includes successive steps (here numbered and later developed in part 3):
1. Definition of campaign objectives and trade-off from science, technical or operational constraints.
2. Analysis of remote sensing data and existing maps.
3. Imaging reconnaissance.
4. Monitoring of the local environment and meteorology.
5. Geology and geophysical context.
6. Field geology and geomorphology investigations.
7. Field geochemistry characterization.
8. Field subsurface studies.
9. Sample handling (extraction and collection) methods.
10. Analysis of soils and rocks performed in the station laboratory (physical, mineral, chemical, organic and biological measurements).
11. A posteriori sample analysis using advanced facilities in the collaborator institutes.
In order to address these objectives, we developed and adapted tools and methods as described in section ‘EuroGeoMars 2009: an example of Moon–Mars astrobiology research campaign’.
EuroGeoMars 2009: an example of Moon–Mars astrobiology research campaign
Science investigations were designed to understand the geological origin of the region through petrological and geochemical study of the constituents (minerals, organic matter, water, chemical compounds and biota). The compiled datasets have been compared to remote sensing data for geological interpretation. Special emphasis was given to the astrobiology objectives of the campaign, and the correlations between mineral, environmental parameters, organics and biota, placed in the geochemistry context.
Definition of campaign objectives and trade-off from science, instruments, technical or operational constraints
In order to assess several human and scientific aspects of future robotic and manned missions on planetary surfaces, the EuroGeoMars campaign was proposed by collaborators from ILEWG, ESTEC and NASA Ames in collaboration with European and US investigators. The campaign was prepared through the ExoGeoLab pilot project (Foing et al. Reference Foing and Wu2009; Foing et al. Reference Foing, Barton, Blom, Mahapatra, Som, Jantscher, Page, Zegers, Stoker and Zavaleta2010a, Reference Murray, Muller, Neukum, Werner, van Gasselt, Hauber, Markiewicz, Head, Foing and Pageb, Reference Foing, Mahapatra, Boche-Sauvan, Som, Page, Stoker, Zhavaleta, Sarrazin, Blake and Poulakisc, Reference Murray, Muller, Neukum, Werner, van Gasselt, Hauber, Markiewicz, Head, Foing and Paged) developed by ILEWG with ESTEC support, to evaluate spin-in of new instrument technologies developed from Earth applications with potential use in space, and spin-off applications of instruments developed from space. The ExoGeoLab pilot project followed a technology programme using breadboard instruments that are attached to an automatic station for remote characterization of selected geological sites as well as sample acquisition and analysis methods. A payload suite (instruments, sensors, data handling system) has been deployed, operated and tested at NASA Ames and at ESTEC. On acceptance, instruments were deployed at Utah MDRS station. It was agreed that the EuroGeoMars campaign would last for 5 weeks and be organized in:
• a technical preparation week (24–31 January 2009) for instrumentation deployment and technology/research field demonstration.
• 1st rotation – MDRS crew 76 (1–15 February 2009) conducting preliminary research.
• 2nd rotation – MDRS crew 77 (15–28 February 2009) focusing on further research utilization and more in-depth analysis.
The goal of the demonstrated technologies was to start validating a comprehensive set of equipment, instruments and methods that can be used in robotic and human Moon–Mars surface exploration missions. Some technology roadmaps have identified required measurements and possible techniques that could be employed (ICEUM Reports and Declarations 2006–2010; MEPAG Report 2007). We selected for this first EuroGeoMars 2009 campaign a subset of relevant instrument breadboards, field sensors or adapted commercial equipment. Several science and exploration instruments were either brought from Europe or lent by US collaborators. Most were deployed and installed during the technical preparation crew week.
Analysis of remote sensing data and maps, and geological context
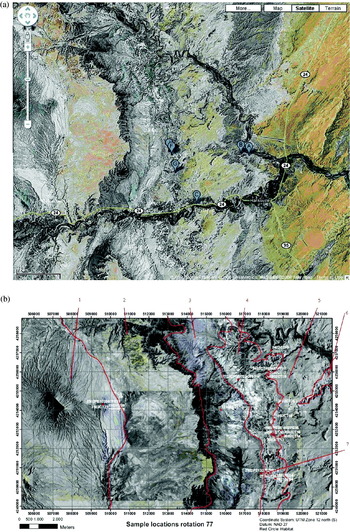
In preparation for the campaign, we collected geological maps and remote sensing data from the region. We consulted the literature and reports from previous field studies. This included interpretation of aerial photo images and United States Geological Survey geological maps. Traverses were planned using these images and maps and taking into account the time required for in-situ measurements and sampling protocol. We developed a method and database to permit a full documentation of samples taken in their geological context. The desert near Hanksville, Utah, includes a range of Mars analogue geological and geochemical features, such as lacustrine and evaporitic sediments, and paleochannels including some with inverted relief. The paper by Clarke & Stoker (Reference Clarke and Stoker2011) in this issue describes the geological context for the samples, and in particular looks at concretions in exhumed channels and their implications for Mars (Figs. 1 and 2).
(a) Google Earth satellite image showing the location of the MDRS station (near F) and sampling areas at Kissing Camel Ridge (near G). (b) Geology for the EuroGeoMars campaign, and positions of sampling areas (Wendt et al. Reference Wendt, Mahapatra, Gross, Borst and Foing2009).

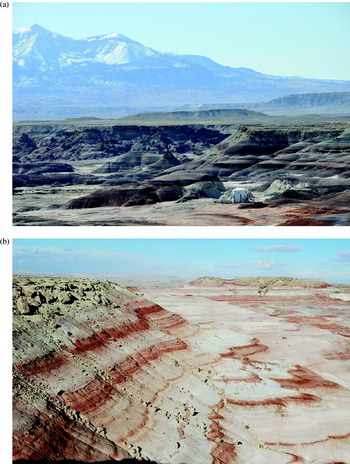
(a) Southward view towards MDRS with Henry Mountains background. (b) Landscape and stratigraphy near MDRS station looking North, showing the resistant layer formed by sandstones of the Dakota sandstone formation at the top of the ridge and the shale slopes of the Brushy Basin member of the Morrison formation below.

To support the sampling, the GPS coordinates of samples were collected systematically, together with panoramic imaging to relate to remote sensing, as well as macroscopic and close-up imaging.
Imaging and navigation reconnaissance from orbit, aerial view, rover or EVA
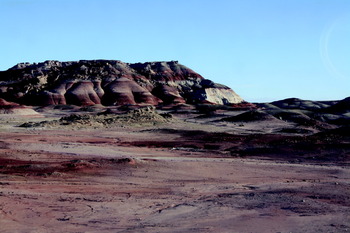
Orbital and aerial imagery as well as the geology maps were analysed in order to define the possible sites for in-situ investigation. We developed a method for merging different imaging datasets taken from different perspectives (vertical or lateral) and integrated them in an interactive database. In parallel, a technology experiment was conducted on Mars navigation using the triangulation of positions of deployed captive helium balloons, in coordination with remote support in order to acquire coordinates (even in absence of a GPS system as would be the case on Mars). A video-cam was lifted by a balloon to provide an aerial view of the field for reconnaissance (Fig. 3).
Context panoramic imaging of salt wash side view.

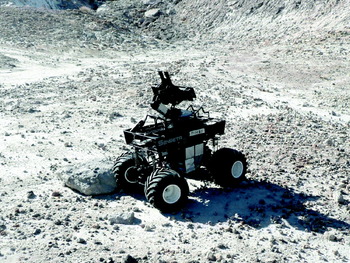
A microrover (developed by Carnegie Mellon University) was used in the field to perform visualization tests for operation. The rover was equipped with an additional camera system (Hendrikse et al. Reference Hendrikse, Foing, Monaghan, Stoker, Zavaleta, Selch, Ehrenfreund, Wendt, Gross and Thiel2010) to provide remote navigation tools. The rover was used to test issues of remote control, locomotion, hazard avoidance and data transfer that are critical in future surface operation missions. The rover was also used to provide remote reconnaissance imaging and geological context of the candidate scenes where samples could later be collected. Prior to sampling, a number of EVA traverses were conducted to specific locations in order to perform reconnaissance of the site and characterize the geology, as well as to select locations for in-situ measurements and sampling (Fig. 4).
Rover used for navigation tests, reconnaissance and EVA assistance (courtesy Carnegie Mellon University/NASA Ames).

Monitoring of the local meteorology environment
Measurements of temperature, humidity, radiation, moisture and water activity were derived from sensors available at the MDRS station, or brought to the sampling sites, as well as from nearby local weather stations. Weather statistics and satellite observations can constrain the average and variation of parameters affecting the hydrology, moisture and oxydation level. The region around Hanksville is characterized as arid desert, cold in winter and hot in summer with an average annual temperature of 12°C. The diurnal range is given as 16–37°C in July and −7 to +7°C on 1 Feb. The area is subjected to wind erosion and was shaped by fluvial erosion. Hanksville receives 140 mm of annual average precipitation (Godfrey et al. Reference Godfrey, Everitt and Duque2008). Weather station sensors include measurements of the diurnal variations of temperature range, winds median average and gusts. The relative humidity showed minima at 15% and diurnal dawn maxima of 50–80% during the EuroGeoMars campaign. The average barometric pressure was 86 kPa. The wind variations showed a median of 5 kmph and gusts of 40–80 kmph. The Photosynthetic Active Radiation in the range 400–700 nm is at maximum 2000 μmoles of photons m−2 s−1. At the start of the EuroGeoMars campaign there was snow precipitation of 0.76 cm water equivalent (leading to a snow cover of 5 cm depth) on 26 January, a slight rain equivalent to 0.05 cm on 12 February, of 0.08 cm on 23 February, and fog on 24 February 2009. A more systematic study including the statistics of diurnal and seasonal changes of those quantities, as well as mechanism for eolian dust transport or heterogeneous water activity requires a systematic set of in-situ instruments and data acquisition methods.
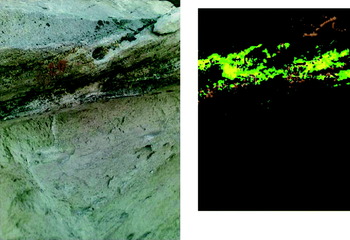
Biomarkers on rocks at the base of ‘Kissing Camel Ridge’ (position G in Fig. 1) (left) field colour image of rock surface with lichens with three main green, yellow and orange constituents. Right: The ‘Cyborg astrobiologist’ novelty algorithm detects automatically colour special signatures from the same image (McGuire et al. Reference McGuire, Gross, Wendt, Bonnici, Souza-Egipsy, Ormö, Díaz-Martínez, Foing, Bose and Walter2010; Gross et al. Reference Gross, Wendt, McGuire, Bonnici, Foing, Souza-Egipsy, Bose, Walter, Ormö and Díaz-Martínez2010).

Geology and geophysical context
The MDRS is surrounded by a series of early Jurassic to late Cretaceous sediments derived by weathering and erosion from Paleozoic sedimentary rocks to the west. These sediments consist of marine to fluvial and lacustrine deposits that locally contain volcanic ashes. The geology formations and units around the MRDS station are described in Fig. 1(b) (Wendt et al. Reference Wendt, Mahapatra, Gross, Borst and Foing2009; Clarke & Stoker Reference Clarke and Stoker2011). The red lines (1–7) in Fig. 1(b) indicate some of the geological formations and their member Mb (in clockwise numbered order from top):
Mancos Shale Formation (Cretaceous): Emery sandstone Mb. Blue Gate Shale Mb (1) including carbonaceous pyritic units. Ferron Sandstone Mb (2) formed as fluvial to marginally marine units. Tununk Mb containing bluish carbonaceous pyritic marine shales.
Dakota Sandstone Formation (Early Cretaceous) (3): Made up of non-marine, marginal marine to marine conglomerates, sandstones, shales, coals and oyster reef lime stones.
Morrison Formation (Late Jurassic): Brushy Basin Mb (4) consists of lacustrine and fluvial red brown clays/mudstones, green–bluish–purple beds and sandstone lenses. Interbedded ash layers are weathered to smectite making the soils unfavourable for plant growth. This formation represents an analogue for some Martian terrains. Salt Wash Mb (5) from semiarid alluvial plain with cross bedded or conglomerate
sandstones and local patchy halite and sulphate efflorescence.
Summerville formation (Middle Jurassic): Intercalated siltstone and mudstone (6) locally containing gypsum beds and mud cracks that formed in a tidal flat environment. Location of MDRS habitat is indicated in (7) within the Brushy basin Mb.
The regional landscape has a complex history due to the regional uplift and volcanic activity. The Utah desert is part of the Colorado Plateau, which was uplifted in the Cenozoic as the result of the collision between the Farallon Plate and the North American Plate. Uplift and regional extension was associated with local volcanism that is manifested near the MDRS with diorites such as those found in the Henry Mountains.
The landscape consists of mesas and scarp-bounded surfaces resulting from erosion of the flat-lying succession of alternating units of greater and lesser resistance to erosion. Clay-rich units being more easily eroded and sandstones are less. The sandstone surfaces form smooth plains and the clay-rich materials form dissected slopes.
The Brushy Basin Member forms a dissected plain of cracking clays (Clarke & Pain Reference Clarke, Pain and Cockell2004). Fluvial channels are exposed on the steep slopes or are being exhumed as inverted relief. These features are analogous to those observed from Mars orbiters. The Mars analogue significance of these formations were investigated by Battler et al. (Reference Battler, Clarke, Coniglio and Clarke2006) and Clarke & Stoker (Reference Clarke and Stoker2011).
Field geology and morphology investigations
The field traverses included an in-situ inspection and recognition of the characteristic petrology. A camera system with images at various embedded scales (panoramic, high-resolution, close-up camera) was used in order to document the location, protocol and samples. The soil mechanical properties could be measured in situ using penetrometry or by studying the tracks left by rovers or EVA traverses.
A support investigation consisted of an enhanced ‘Cyborg astrobiologist’ field reporting capability based on a colour novelty detection algorithm applied to images obtained by a hand-held or rover camera (Gross et al. Reference Gross, Wendt, McGuire, Bonnici, Foing, Souza-Egipsy, Bose, Walter, Ormö and Díaz-Martínez2010; McGuire et al. Reference McGuire, Gross, Wendt, Bonnici, Souza-Egipsy, Ormö, Díaz-Martínez, Foing, Bose and Walter2010). The system collects images and detects novelty (see Fig. 5); i.e. unobserved colour ratios compared to previous scenes. We covered a vertical profile in the Brushy Basin Member of the Morrison Formation to test how the system responded to the various clay and sandstone strata. The preliminary results show that the system robustly detects strata not previously recorded.
Field mineralogy characterization
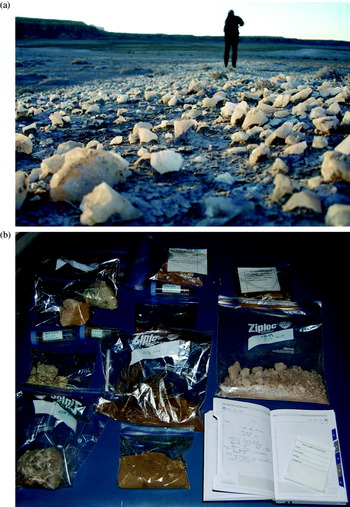
The mineralogy and mineral assemblages of rocks were mostly determined in situ by close-up visual inspection. The various minerals identified include quartz, gypsum, clays, calcite and sulfates (Borst et al. Reference Borst, Peters, Foing, Stoker, Wendt, Gross, Zavaleta, Sarrazin, Blake and Ehrenfreund2010). Diorites were also sampled from an expedition to Mount Henry. Specific note was made of the original sedimentary processes responsible for the sediment deposition and more recent processes that led to secondary mineral formation such as gypsum and calcite concretions, desert varnish, etc. (Fig. 6(a)).
(a) Field inspection of calcite evaporite rocks. (b) Display and documentation of samples from one EVA before laboratory analysis.

A Magnetic Susceptibility Meter was used in the field to determine the magnetic susceptibility and conductivity of samples. The Xterra (by InXitu) Field X-ray Diffractometer for mineralogy and X-ray Fluorescence for elemental chemistry and the Raman spectrometer (InPhotonics) were tested in outdoor conditions as the instruments could be transported. As we had installed a geochemical laboratory in the MDRS habitat, we concentrated for this research campaign on fast in-situ characterization and sample collection and used the analytical instruments in the laboratory for more accurate and detailed investigations. In some cases, a classical field test for carbonates in the soil was performed using HCl acid and observing the release of CO2 bubbles.
Field subsurface studies
Drilling equipment included a Milwaukee hand-operated electrical drill that could reach depths down to 1 m. Another manual rotary drill was used to sample soft-clay areas. The drill cores provided information on the vertical structure of soils and the distribution of minerals within rocks. These observations were compared with the lateral variations in rock layers observed from the edges of cliffs to determine the scale of heterogeneity of individual strata.
A comparison was also made with data obtained from Ground Penetrating Radar (GPR) subsurface test measurements. The CRUX GPR developed by JPL (Kim et al. Reference Kim, Carnes, Haldemann, Ulmer, Ng and Arcone2005), and adapted by NASA Ames was tested to provide information on the stratification of sedimentary structures. The GPR operates at 800 MHz with a penetration of 5 m and a resolution of 15 cm, depending on the soil permittivity and scattering properties. The GPR was only used in few areas to study the clay deposits near the MDRS Morrison Formation and the top of the Dakota Formation.
A later campaign in 2010 (DOMMEX-EuroMoonMars) focused on performing subsurface science-related activities with Mars Underground Mole (MUM, a robotic penetrometry system) and the CRUX GPR (Stoker et al. Reference Stoker, Zavaleta, Bell, Direto, Foing, Blake and Kim2010, Reference Stoker, Clarke, Direito, Blake, Martin, Zavaleta and Foing2011). Data collected with the CRUX GPR are reported in Clarke & Stoker (Reference Clarke and Stoker2011).
Sample handling (extraction and collection) methods
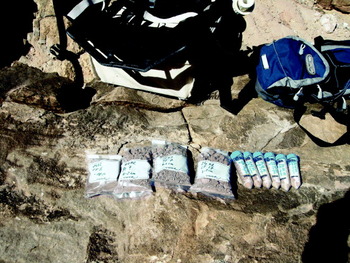
The sample context was documented with still and HDTV format cameras for field and lab studies (transported from ESTEC/ILEWG ExoGeoLab). Specific protocols were followed for sterile sampling (using gloves and sterile tools), and for borehole core sampling (to preserve the soil stratification record) (Fig. 6(b)).
Sample analysis of soils and rocks performed in station laboratory
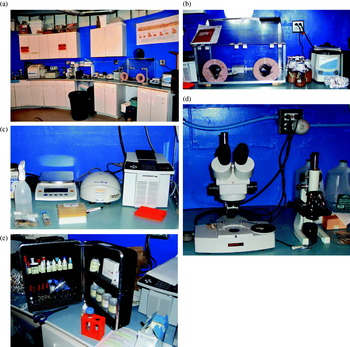
For every EVA, the samples were catalogued and curated. The crew installed a geochemical laboratory in the habitat for analysis of the samples. This included a Raman Spectrometer (InPhotonics), a Visible/NIR Spectrometer (OceanOptics), an integrated X-ray diffractometer/X-ray fluorescence meter (Terra 158) as well as an optical microscope. We first performed non-destructive techniques. A physical inspection and imaging was performed on the samples before optical spectroscopy was applied using reflectance and Raman spectrometry to determine the mineral and organic content in the soils or rocks. The biological content of sample equivalents (sample aliquots?) was measured with on-site polymerase chain reaction (PCR) equipment.
Inspection, microscopy and morphology
The morphology of minerals and the microbial relation to the mineral assemblage were studied with an optical microscope (200 power, provided at MDRS). The microscope data (FOV few mm) were linked with close-up imaging data (FOV few cm) to provide the spatial context for the geochemical or biological techniques used with different surface or volume fields of view. Microscopy was used to investigate the water samples. Micro-organisms as well as floating particles were concentrated by centrifugation. Several micro-organisms could be detected, most of them being algae (Thiel et al. Reference Thiel, Wills and Foing2009, Reference Thiel, Ehrenfreund, Foing, Pletser and Ullrich2011).
Visible-NIR spectrometry
An Ocean Optics USB2000 Fibre-optic spectrometer was used to measure the light reflectance in the ultraviolet, visible and NIR spectral regions. This permitted correlation of colour inspection with quantitative reflectance. In a few cases, some signatures of absorption due to organic compounds or red fluorescence could be measured on selected samples.
Raman spectrometry
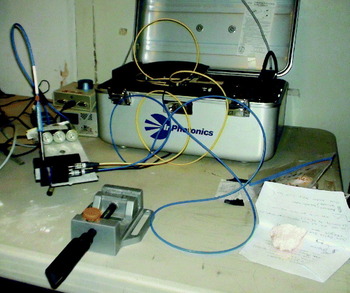
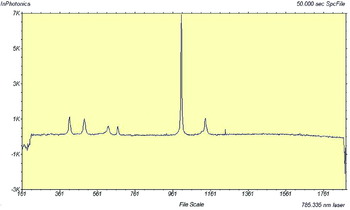
Raman spectroscopy is based on inelastic scattering of light, used to study low-frequency modes of a system such as vibration or rotation. Each mineral has a unique Raman spectral signature, which is compared with standard mineral Raman spectra in a database to identify the mineral composition of the sample (Foing et al. Reference Foing, Barton, Blom, Mahapatra, Som, Jantscher, Page, Zegers, Stoker and Zavaleta2010c; Som & Foing Reference Som and Foing2010). For the Raman spectrometer (InPhotonics) used at MDRS, we used an exciting laser at 785.335 nm and measured the Raman spectrum in the range of 160–1900 cm−1. We designed and manufactured a sample holder for Raman and NIR sensor head holder to allow controlled and reproducible sample analysis conditions (Fig. 7).
Raman spectrometer box (silver) and horizontal Raman fiber feed to be placed on sample holder, the vertical fiber feeds to the Ocean-optics visible NIR spectrometer.

X-ray diffractometer/X-ray fluorescence meter (XRD/XRF)
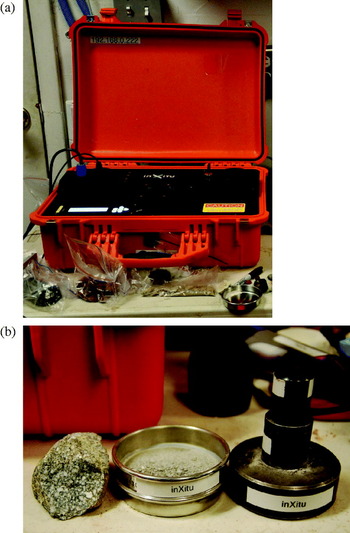
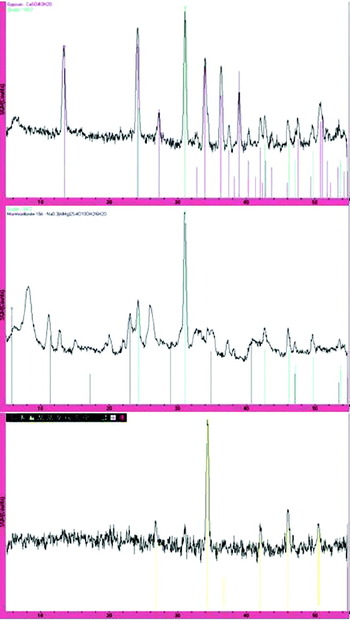
The samples were crushed into powders for the XRD/XRF analysis. CheMin is the X-ray diffraction (XRD) instrument aboard NASA's Mars Science Laboratory (MSL) (Blake et al. Reference Blake, Sarrazin, Bish, Chipera, Vaniman, Collins, Elliott and Yen2007). A commercial instrument called Terra was developed by inXitu, Inc. in 2007 to maximize the ease of use and field deployment. Terra has a similar architecture to CheMin with a smaller CCD for reasons of cost, weight and power. The CCD is cooled to −45°C with a Peltier cooler. The system includes an onboard computer to control the instrument, acquire and process data in real time and providing a graphical user interface through a wireless link. Li-ion batteries allow 4–5 h of autonomous operation. The entire instrument weighs less than 15 kg including batteries and a rugged housing. XRD data permit mineral identification within a few minutes. XRF data, in the energy range (3–15 keV) allow measurement of specific chemical elements (Fig. 8).
(a) X-ray Diffraction and fluorescence spectrometer XRD/XRF (orange case). The sample is crushed into powder and placed in a container inserted in the central upper slot for X-ray illumination. (b) Diorite sample (left), crushing (right) and sieving (middle) device before XRD-XRF analysis.

Soil analysis kit and electrochemical measurements
The electro chemical activity was measured using a soil analysis kit providing the content of ions and reactivity. The soil composition of the previously collected soil samples was analysed by using colorimetric chemical reactions (LaMotte Soil Testing System). The pH, nitrogen, potassium, phosphorous, magnesium, calcium and water content of soils originating from areas with and without vegetation were determined. The pH of all soil samples was in the range of 8.2–10.0. The magnesium concentration was very low for all samples (<5 ppm). The range for phosphor was between 5 and 100 ppm (Ehrenfreund et al. Reference Ehrenfreund, Foing, Stoker, Zavaleta, Quinn, Blake, Martins, Sephton, Becker and Orzechowska2010). Soil conductivity measurements were obtained using a Thermo Orion 135A probe after dilution (1:10) in distilled water and ranged from 1 to 20 mS (Fig. 9(a–e)).
(a) Installed biology and astrobiology laboratory. (b) Glovebox and sample handling. (c) Precision balance, centrifuge and PCR Peqlab. (d) MDRS microscopes. (e) Soil analysis kit.

Biological measurements
The crew performed upgrades to augment the biological laboratory at MDRS. The laboratory in the habitat was equipped with the instrumentation shown in Fig. 9. The temperature in the laboratory was slightly below nominal (15–16°C).
An adenosine tri-phosphate (ATP) meter was used to measure the metabolic activity and microbial content of the samples.
The PCR lab was brought from the ESTEC ExoGeoLab project. An overall set-up was integrated and tested in ESTEC and then transported and reintegrated in the MDRS lab for performing PCR experiments (Thiel et al. Reference Thiel, Ehrenfreund, Foing, Pletser and Ullrich2011). This included a precision balance (Satorius), a vortex and a centrifuge for DNA extraction. Reaction mixtures were performed in a glovebox, and fragment amplification in a thermal cycler Primus 25 advanced (Peqlab). PCR fragments were then analysed using agarose E-gels and visualized. The results of PCR-based analysis of microbial communities during the EuroGeoMars MDRS campaign are described in Thiel et al. (Reference Thiel, Ehrenfreund, Foing, Pletser and Ullrich2011).
Post-campaign sample analysis using advanced facilities in collaborating institutes
The various soil samples extracted in sterile conditions were divided and sent to various laboratories for a later analysis with advanced techniques:
• Culture-independent molecular analyses directed at ribosomal RNA genes including PCR (with Bacteria-, Archaea- and Eukarya-specific primers), DGGE (Denaturing Gradient Gel Electrophoresis), cloning, sequencing and phylogenetic analysis were performed at VU Amsterdam (Direito et al. Reference Direito, Ehrenfreund, Marees, Staats, Foing and Röling2011) to investigate the microbiology of desert samples.
• Solid-phase microextraction, organic solvent extraction and gas chromatography/mass spectrometry at JPL (Orzechowska et al. Reference Orzechowska, Kidd, Foing, Kanik, Stoker and Ehrenfreund2011) providing a survey of Polycyclic Aromatic Hydrocarbons (PAHs) abundance in relation to texture, pH and overall organic matter content.
• Infrared spectroscopy (in the range 4000–500 cm−1) and XRD at Leiden University and Imperial College, respectively to analyse the mineral composition of 10 selected soil analogues (Kotler et al. Reference Kotler, Quinn, Martins, Foing and Ehrenfreund2011).
• Extraction of amino acids, derivatization and GC–MS analysis was performed at Imperial College London (Martins et al. Reference Martins, Sephton, Foing and Ehrenfreund2011).
• Additional analytical studies were performed on a subset of the samples using the Raman spectrometer and visible NIR spectrometer together with microscopy at ESTEC ExoGeoLab facility.
• Scanning electron microscopy was performed at NASA Ames Research Centre on some of the endolithic samples.
A synthesis interpretation of the measurements of selected soil samples collected under sterile conditions and distributed to various laboratories is given by Ehrenfreund et al. (Reference Ehrenfreund, Foing, Stoker, Zavaleta, Quinn, Blake, Martins, Sephton, Becker and Orzechowska2010) (mineralogy, organic content and microbiology). The results are discussed in the context of astrobiology and habitability studies in preparation for future Mars missions (Ehrenfreund et al. Reference Ehrenfreund, Foing, Stoker, Zavaleta, Quinn, Blake, Martins, Sephton, Becker and Orzechowska2010).
EuroGeoMars scientific research highlights
Field science experiments were started as soon as the corresponding instruments were assembled, tested and deployed. More than 100 documented samples were collected by the MDRS crew 77 for geology (50 samples), astrobiology (11+5 samples divided for 8 investigators groups) and biology (30 samples divided into 4 collaborating groups). MDRS crew 76 collected 50 documented samples. Samples were screened/analysed in the lab at the Habitat. Data were sent to remote science support teams in Europe and the US for further evaluation and detailed analysis. The geoscience investigations concerned mostly geological survey, documenting sample context and geochemical analyses of returned samples from the surrounding rock formations.
In-situ sample analysis
Approximately 40 samples have been analysed in the Habitat laboratory for chemical composition (XRF) and mineralogy content (XRD, Raman, VIS/NIR). Samples included clays, sandstones and volcanic ash layers of the Jurassic Morrison formation, pure crystals such as gypsum and calcite, petrified wood, desert varnish, endoliths and salt efflorescence. The sampling and analyses involved the set-up and maintenance of a detailed database with sample description, context geology and test results (Figs. 10–13).
MDRS measured Raman spectrum of gypsum CaSO4·2H2O.

XRD spectra analysed in MDRS with match from database minerals: (a) XRD spectrum of Dakota Formation sandstone sample indicating gypsum and quartz (top), (b) XRD spectrum of Morrison sample indicating quartz and montmorrillonite clay (middle), (c) XRD spectrum of calcite evaporate (bottom).

Biology sample analysis
The primary goal of the biology investigations was the analysis of microbial communities living in the soil in interesting locations in the MDRS area, using protocols that are relevant to the search for organics and life on Mars, and to planetary protection. This investigation had a field aspect and a laboratory aspect: soil sampling was done in the field at depths of 10, 30 and 60 cm, in and out of EVA working conditions.
DNA extraction and PCR analysis were performed in the in-situ laboratory. DNA extracted from nine soil and water samples of five different sampling sites were analysed in a first PCR run (Primus25 advanced; PeqLab) to detect bacterial DNA. Microscopy was used to investigate water samples for micro-organisms as well as floating particles concentrated by centrifugation.
DNA extraction and PCR analysis were also performed in a laboratory at Grand-Junction immediately after the campaign (Thiel et al. Reference Thiel, Ehrenfreund, Foing, Pletser and Ullrich2011) and in laboratories in Europe after the campaign (Direito et al. Reference Direito, Ehrenfreund, Marees, Staats, Foing and Röling2011). The microbial communities were studied in situ indicating already differences between Archaea and Bacteria in samples, and a later analysis of returned samples provided a more complete description of the relation of microbial communities’ composition and phylogenetic analysis (Direito et al. Reference Direito, Ehrenfreund, Marees, Staats, Foing and Röling2011).
Soil sample mineral and organic post-mission analysis
The samples were divided (see Fig. 13) and sent to Earth-based laboratories for sophisticated analysis of PAHs (Orzechowska et al. Reference Orzechowska, Kidd, Foing, Kanik, Stoker and Ehrenfreund2010), of mineral matrix composition (Kotler et al. Reference Kotler, Quinn, Martins, Foing and Ehrenfreund2010) or of amino acids (Martins et al. Reference Martins, Sephton, Foing and Ehrenfreund2011). Post-analysis studies determined the total carbon content (Orzechowska et al. Reference Orzechowska, Kidd, Foing, Kanik, Stoker and Ehrenfreund2010). A study of solid phase microextraction (SPME) method for fast screening and determination of PAHs in soil samples was performed, minimising sample handling and preserving chemical integrity of the sample. Complementary liquid extraction was used to obtain information on five- and six-ring PAH compounds. The measured concentrations of PAHs are, in general, very low, ranging from 1 to 60 ng/g (Orzechowska et al. Reference Orzechowska, Kidd, Foing, Kanik, Stoker and Ehrenfreund2010).
Core sample analysis
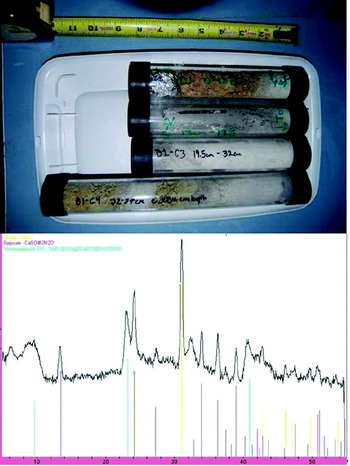
Using a Milwaukee drill (Stoker et al. Reference Stoker, Foing, Zavaleta and Clark2009, Reference Stoker, Zavaleta, Bell, Direto, Foing, Blake and Kim2010), we extracted cores down to 70 cm depth in a layered concretion-rich exhumed channel fragment. The drill site can also be analysed from side view near the MDRS habitat. The samples were transferred to a container preserving the stratification. The variation of the mineralogy and chemistry was analysed along the drill core. The samples show layers of quartz, gypsum and clays with some light mixing of those minerals. Visual, reflectance spectrometry, Raman and X-ray analysis was performed on extracts from the drill core (Fig. 12).
(top) Extracted drill core in 4 segments of 8–12 cm, (bottom) XRD spectrum of a core extract measured in the Hab, indicating the specific peaks of gypsum (purple), Quartz (yellow) and montmorillonite clay (green).

After these preliminary investigations, a more comprehensive campaign (DOMEX/EuroMoonMars 2010) was organized in November 2009 and February–March 2010 (Stoker et al. Reference Stoker, Zavaleta, Bell, Direto, Foing, Blake and Kim2010, Reference Stoker, Clarke, Direito, Blake, Martin, Zavaleta and Foing2011; Clarke & Stoker Reference Clarke and Stoker2011) using more advanced drilling systems, in conjunction with imaging and GPR reconnaissance.
Set of samples collected and documented in situ for mineral, organic and biology MDRS laboratory and post-mission analysis.

Analysis of endolithic microbial mats
During the EuroGeoMars campaign we investigated on-site endolithic biota in relation to their environment. Endolithic microbes are extremophile organisms that live inside rocks or in pores between mineral grains. They can be not only lithotrophs but also phototrophs such as cyanobacteria. Phototrophs use light as energy source while lithotrophs oxidize inorganic compounds. They consume reduced elements from rocks, producing energy and free electrons used for ATP production. Litho-autotrophs obtain their carbon from CO2 included in rocks and litho-heterotrophs from organic material. Endoliths can be slow to grow, due to limited nutrients. Endoliths may be present on Mars, and therefore it is interesting to study them in extreme environments on Earth in the context of life detection. An example is the endolithic, desiccation- and radiation-resistant cyanobacterium Chroococcidiopsis, a model organism for viability studies under Martian conditions. This prokaryote is able to survive in a Martian UV radiation environment when shielded by 1 mm of rock (Cockell et al. Reference Cockell, Schuerger, Billi, Friedmann and Panitz2005). An acidophilic chemolithotroph from Rio Tinto was exposed to simulated Mars UV and atmospheric conditions under the protection of a Mars regolith analogue (Gómez et al. Reference Gómez, Mateo-Martí, Prieto-Ballesteros, Martín-Gago and Amils2010).
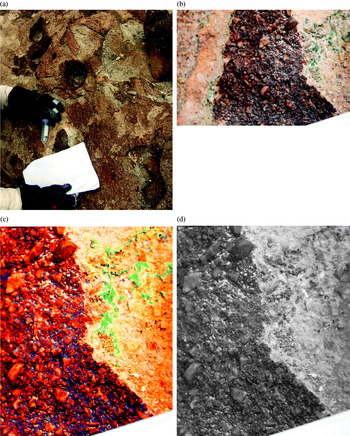
We have found, studied in situ and sampled some endolithic mats near the MDRS research station. We investigated various areas at the base of ‘Kissing Camel Ridge’, a geological feature formed by an exhumed palaeo-channel in the Brushy Basin member of the Morrison formation (point G in Fig. 1). In this area, some locations show concretions morphologically similar to the ‘blueberries’ observed by the Mars Exploration Rover in Meridiani, Mars (Clarke & Stoker Reference Clarke and Stoker2011). A visual survey was conducted using colour imaging and the Cyborg astrobiologist experiment. The macroscopic pictures and close-up views indicated surface epilithic lichens.
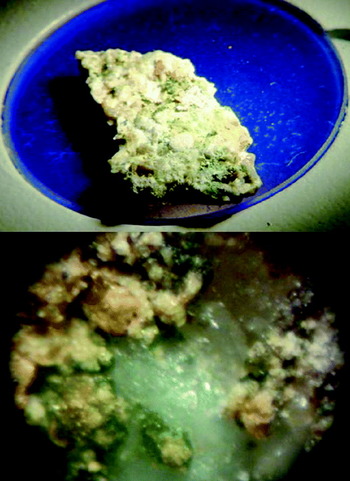
After detachment of the crust, we confirmed the presence of microbial endolith population with green and orange-brown constituents, and the presence of endolith under a purple-brown coating. Samples of endolith attached to the host crust were taken to the MDRS laboratory. The visual and microscopic inspection confirms the presence of different layers: an outer varnish, a cemented crust, a brown microbial mat and a green mat attached to the rocks. Imaging was performed several times: a) before sampling, b) just after sampling using reference white calibration paper in order to quantify the colours of endolith on first exposure to light, and c) the same scene was revisited 1 week later. After detachment of the crust and varnish layers, the endoliths appear in three different colour units, with variations within 0.1–0.5 mm.
Reflectance and Raman spectroscopic studies were performed on the varnish, crust, endolith and on the different adjacent mineral units. The analysis of the varnish coating with the XRF shows an overabundance of manganese, but little potassium, calcium or chromium. This is consistent with reddish iron and manganese oxides precipitates forming a dark and UV protecting layer. The microscopy indicates that the green endolith unit is mostly attached to gypsum grains (Figs. 14 and 15).
(a) Context and protocol for endolith imaging and sterile sampling. The white paper was imaged for balance control allowing calibration of quantitative colour information. (b) Zoom of endolith (20 cm field of view) in natural balance colours. (c) Zoom (enhanced colour balance, 15 cm field of view) where endoliths appear as 3 distinct colour units clearly, after detachment of the crust and varnish layers. (d) Zoom of the same 15 cm field of view in black & white, where the endoliths are much harder to distinguish.

Study of endolithic microbial communities in the MDRS lab: (top) sample view before microscopic inspection (FOV 2.5 cm), (bottom) optical microscope MDRS lab image of green and brown endolith communities in relation to minerals (field of view 3 mm).

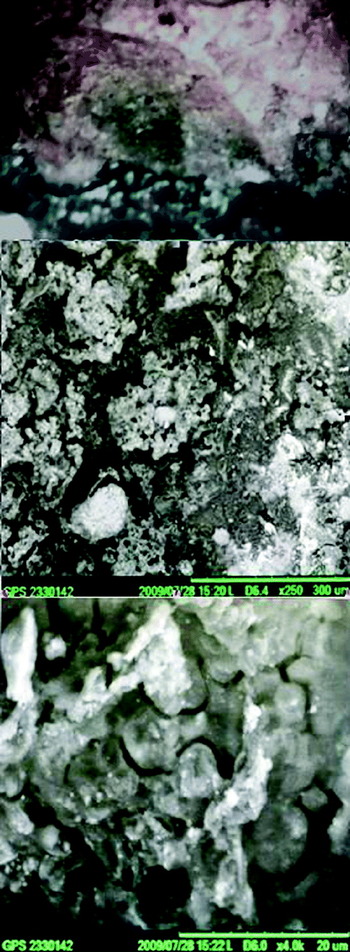
Post-mission analysis of the endolith samples was performed using a tabletop with scanning electron microscope (SEM) was conducted at NASA Ames Research Centre. This instrument is portable enough to allow field deployment. In the green area unit, we observed sheet-like structures layers of 100–300 μm in the interstitial pores between mineral grains. At ×4000, we detect submicron coccoids (Figs. 16–19).
Post-campaign study of endolithic microbial communities performed at NASA Ames: sample close-up context, FOV 1 cm (top), SEM magnification×250 , FOV 600 μm (middle) and SEM ×4000 FOV 40 μm (bottom).

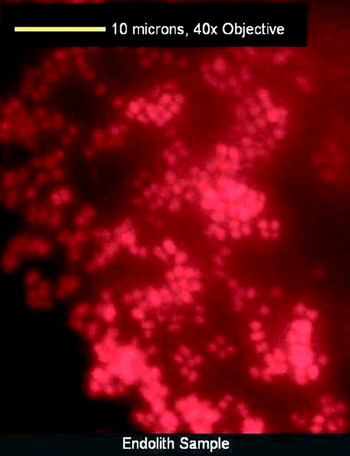
Endolith images taken with an autofluorescence microscope. The red colour is due to chlorophyll autofluorescence. These images indicate that the endoliths are comprised of photosynthetic coccoid cells that are approximately 1 μm in size. They mainly form in clusters perhaps indicating the formation of a biofilm, potentially confirmed by the SEM images.

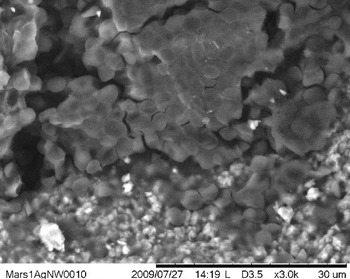
SEM view of endolith coccoid cells (smooth round features) together with sandstone micron particles (jagged shapes).

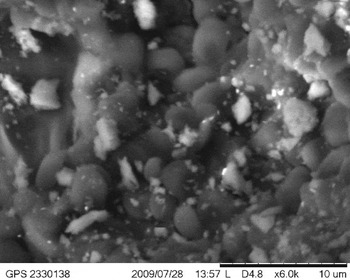
SEM image of clump of coccoid cells, with abiotic particles suspended in a matrix possibly made of extracellular polymeric substance (EPS) from within an endolith.

In Fig. 17, autofluorescence microscope images show that the endoliths contain photosynthetic coccoid cells that are approximately 1 μm in diameter. They form primarily in clusters, perhaps indicating the formation of a biofilm, which is potentially confirmed by the SEM images. The red colour is due to chlorophyll autofluorescence and highlights the clustering of the phototrophic bacteria.
In Fig. 18, we see the smooth coccoidal cells that are roughly the same size as those present in the autofluoresence microscopy images. Again, the cells are clustered together and then come into contact with the more jagged, lighter-toned sandstone particles. This transition is not smooth, but rather the particles are packed in between clusters of cells before only sandstone grains remain in the next layer of the endolith.
In Fig. 19, the abiotic particles surrounding the coccoid cells appear suspended in a matrix. This matrix might be EPS that connects the cells in a biofilm. By forming a biofilm, these endolithic micro-organisms can better survive their nutrient poor environment, as available nutrients can concentrate on the surface. Also, the EPS allows the cells to attach to the surface of the sandstone for a more stable living environment. In addition, it is possible that there is more than one species of micro-organisms present in the biofilm. If so, the community of endolithic micro-organisms would benefit as the different species would be able to break down different types of nutrients, and they would be able to share in the limited nutrients available in the sandstone.
These results on the endoliths from in situ measurements to post laboratory sample analysis illustrate a possible astrobiology research avenue that can be performed at the MDRS analogue site.
Conclusions and perspectives
We have described the instruments and methods used for astrobiology research during the EuroGeoMars 2009 campaign. For technology field demonstration, the EuroGeoMars crew used instruments under realistic conditions (cameras, digital microscopy, XRD/XRF Spectrometers, Reflectance spectrometers, Raman spectrometer, GPR, magnetic susceptibility meter, ATP Luminometry meter and other sensors). Remote sensing maps and geology reconnaissance were compared with surface in-situ investigations. A method of sample acquisition, curation and an analysis protocol was developed. The operations of remote rovers or their cooperation with field crew in EVA were investigated. Systems were demonstrated for communication, navigation and positioning. A Cyborg astrobiologist novelty detection algorithm was applied to rocks and landscape in different scenarios. The crew and remote support team used maps and database tools to integrate data and metadata from the sample context, rocks and subsequent measurements.
The EuroGeoMars research investigated processes relevant to Earth–Moon–Mars, in relation to geology and mineralogy. This included the analysis of samples from surface and from drill cores, in the field, in the habitat and later in laboratories. Several advanced and miniaturized instruments representative of those developed for future space missions were used, and provided in-situ constraints on mineralogy and organics.
Human crew-related aspects, i.e. (a) evaluation of the different functions and interfaces of a planetary habitat, (b) crew time organization in this habitat (Pletser & Foing, Reference Plester and Foing2010). The evaluation of man–machine interfaces of astrobiology equipment is discussed in Thiel et al. (Reference Thiel, Ehrenfreund, Foing, Pletser and Ullrich2011). Education, outreach, communications, multi-cultural and public relations aspects have been described in Foing et al. (Reference Foing, Barton, Blom, Mahapatra, Som, Jantscher, Page, Zegers, Stoker and Zavaleta2010a, Reference Foing, Boche-Sauvan, Stoker, Ehrenfreund, Wendt, Gross, Thiel, Peters, Borst and Zhavaletab, Reference Foing, Mahapatra, Boche-Sauvan, Som, Page, Stoker, Zhavaleta, Sarrazin, Blake and Poulakisc, Reference Foing, Stoker, Zhavaleta, Ehrenfreund, Quinn, Blake, Martins, Sephton, Becker and Orzechowskad). The campaign experience and data analysis were used for a number of students’ projects (bachelor, master and PhD research) and thesis reports.
In conclusion, the goals of EuroGeoMars 2009 field campaign were fulfilled by contributing to:
(1) testing instruments, rovers, landers, EVA technologies, habitat and field laboratory;
(2) performing field research in geology, sample analysis, exobiology;
(3) studying human factors and crew aspects;
(4) outreach and students’ training.
In this paper, we have focused on the description of the instrument technology demonstration and the methodology of sampling and in-situ research. The scientific results from subsequent sample analysis are described in companion papers of this special issue. Lessons were learned relevant to human operations, or students training in relation to future robotic and human missions to the Moon or Mars (Pletser & Foing Reference Plester and Foing2010; Thiel et al. Reference Thiel, Ehrenfreund, Foing, Pletser and Ullrich2011; De Crombrugghe et al. Reference de Crombrugghe, Le Maire, Denies, Jago, Van Vynckt, Reydams, Mertens and de Lobkowicz2011).
As a follow-up of the EuroGeoMars 2009 campaign, ILEWG supported with instruments and experts, a campaign in Eifel Germany on human and robotic cooperation (Foing et al. Reference Foing, Barton, Blom, Mahapatra, Som, Jantscher, Page, Zegers, Stoker and Zavaleta2010a; Groemer et al. Reference Groemer, Stumptner, Foing, Blom, Perrin, Mikolajczak, Chevrier, Direito, Olmedo-Soler and Zegers2010), and field campaigns by the CAREX project on ‘Life in Extreme Environment’ at Rio Tinto in Spain in Sept. 2009 and in Iceland in June 2010 (Direito et al. Reference Direito, Foing, Mahapatra, Gomez and Rull2010; Gómez et al. Reference Gómez, Mateo-Martí, Prieto-Ballesteros, Martín-Gago and Amils2010, Reference Gómez, Walter, Amils, Rull, Klingelhöfer, Kviderova, Sarrazin, Foing, Behar, Fleischer, Parro, Garcia-Villadangos, Blake, Martin Ramos, Direito, Mahapatra, Stam, Venkateswaran and Voytek2011), and in Antarctica in December 2009 (De Vera et al. Reference de Vera, Leya, Lorek, Koncz, de La Torre Noetzel, Kozyrovska, Burlak and Foing2010) with a specific focus to use research instruments on the field for in-situ analysis of bio-organics and minerals in samples.
A EuroMoonMars/DOMEX (Drilling on the Moon and Mars in Human Exploration) campaign was performed in November 2009 and February–April 2010, using analogue missions to develop the approach for using human crews to perform science activities on the Moon and Mars, with the novelty of exploration and sampling of the subsurface using a suite of drills from back-pack carried to large truck-carried systems (Foing et al. Reference Foing, Barton, Blom, Mahapatra, Som, Jantscher, Page, Zegers, Stoker and Zavaleta2010a, Reference Foing, Boche-Sauvan, Stoker, Ehrenfreund, Wendt, Gross, Thiel, Peters, Borst and Zhavaletab, Reference Foing, Mahapatra, Boche-Sauvan, Som, Page, Stoker, Zhavaleta, Sarrazin, Blake and Poulakisc, Reference Foing, Stoker, Zhavaleta, Ehrenfreund, Quinn, Blake, Martins, Sephton, Becker and Orzechowskad; Stoker et al. Reference Stoker, Zavaleta, Bell, Direto, Foing, Blake and Kim2010, Reference Stoker, Clarke, Direito, Blake, Martin, Zavaleta and Foing2011). A series of EuroMoonMars-DOMEX five crew rotations were deployed for 2 weeks each time performing complementary aspects of this research.
The experience and results from these campaigns in sites representing specific planetary analogue conditions can contribute to the preparation of field tests for Moon and Mars exploration, for missions such as MSL, Exomars, Moon or Mars Sample Return. This will include the investigation of geological and geochemical context, drilling of cores and sampling, remote control of field rovers, cameras and instruments. Also future human missions to the Moon or Mars can be prepared by evaluating crew operations, simulations and EVAs,and interaction with instruments. Terrestrial campaigns including tele-robotics and EVAs enable preparation under both real and simulated conditions for science, technology, research, operational, organizational and communication aspects associated with future robotic and human exploration missions.
Acknowledgements
We thank NASA Ames, ESTEC, ILEWG and partner institutes for experimental, operational and science support. We thank the MDRS mission support and Mars society (A. Westenberg and J. Edwards), ESTEC ExoGeoLab remote support (J. Page, P. Voorzaat and P. Mahapatra), NASA Ames support (C. McKay and F. Selch; CMU). B.H.F., C.T. and A.B. acknowledge a research travel grant from ILEWG. We acknowledge the support teams of EuroGeoMars 2009 from MDRS and partner universities (VU Amsterdam, FU Berlin, TU Delft, Cranfield University, Bristol University) and the EuroGeoMars 2009 crew members. We also thank the subsequent crews from ILEWG EuroMoonMars-DOMMEX 2010 campaigns and main partners (NASA, ESTEC and Ecole de l'Air) for their contribution.