


On March 21, 1199, Liu Guangzu 劉光祖 (1142–1222) was stripped of his honorific literary titles and banished to Fangzhou 房州 (Hubei), about 600 miles away from his hometown in Sichuan. He received this punishment for criticizing the court in an essay. Liu argues in the essay that learning has its own values independent of the likes and dislikes of men of his times. The goal of great learning is to comprehend the Way of the Sages so as to cultivate ourselves, and that of lesser learning is to develop our literary skills so as to fully express our intent. However, “the world today considers the Way false … and finds elegant writing objectionable. But likes and dislikes are only fads of a moment, while truth and falsity are fixed for ten thousand generations.”Footnote 1 At a time when powerful men at the court denounced the Learning of the Way (Daoxue) as “false learning” and purged their supporters from government service, Liu's remarks were an unmistakable defense of Daoxue and its supporters and a vigorous attack on the Song court.
The medium and circulation of Liu's remarks deserve attention. Liu put up this defense of the Daoxue position in a commemorative account (ji 記) that he wrote for a local school in Fucheng 涪城 county (Sichuan) in 1198 or 1199.Footnote 2 This essay was then inscribed on a stele erected in Fucheng. Immediately, this captured attention at court in Lin'an (Hangzhou). Within months, Remonstrator Zhang Fu 張釜 impeached Liu, leading quickly to his banishment to Fangzhou, and the magistrate of Fucheng acted quickly to have the stele destroyed. This did not prevent Liu's account from circulating. Soon, in a court gazette, the news of Liu's banishment reached Zhu Xi 朱熹, then at home in Jianning 建寧 (Fujian). Not only did he express his sympathy in a letter to Liu, but Zhu also received a copy of Liu's account and asked his disciple Yang Ji 楊楫 (d. 1213) to defend Liu at court.Footnote 3 This incident is a vivid illustration of the wide readership and the argumentative character that many commemorative inscriptions for schools had assumed in the Song period.
As Liu Guangzu's inscription for the Fucheng county school indicates, these inscriptions did more than celebrate the construction, expansion, and restoration of local schools or commemorate the patronage and generosity of their sponsors. Their audience reached beyond the local scholars and officials who had access to the steles. These inscriptions often circulated in manuscript and print form and enjoyed a wide readership. Song writers frequently used these inscriptions as influential avenues for promoting their own visions of learning.
This article explores the changing themes of these school inscriptions in Song times, the backgrounds of their authors, and the scope of their influence. A hallmark of the dynasty's achievements, the creation of a national network of state-sponsored local schools in Song times has received a great deal of scholarly attention. Some of the works focus on the institutional history of government schools,Footnote 4 some explore their spatial distribution,Footnote 5 and some are detailed case studies of how local schools evolved in different places.Footnote 6 This study takes a different approach. Focusing on the inscriptions the Song authors composed for local government schools, this article seeks to reveal some general spatial and temporal patterns in how local government schools evolved over the course of the Song in relation to the broader political and intellectual trends. It sees the local government school as a site where different political and cultural forces competed to define and redefine the purpose of education and to transform its physical space.
To achieve this goal, this article makes use of digital methods of network and text analysis and combines them with a close reading of some inscriptions. Methodologically, this article provides an example of how diverse digital methods enable us to handle a large body of texts from multiple perspectives and invite us to explore connections we might not have otherwise thought of. A total of 773 inscriptions dating from the Song period pertaining to local government schools provide the source materials for this study. The precise meaning of “inscriptions” and local government schools, however, requires some explanation.
Accounts (ji) and Steles (bei)
The Song authors usually called these inscriptions “accounts” (ji 記). The ji developed into a popular category of writing only after the mid-Tang. Prior to the Tang, very few authors identified their essays as ji. The majority of the writings with ji in the title are either short introductions to Buddhist sutras and their translations (jiejing ji 解經記, fanyi ji 翻譯記) or inscriptions on Buddhist sculptures (zaoxiang ji 造像記). Literary anthologies and critiques in this period do not include ji as a specific literary genre. In Tang times, however, the ji developed into a highly popular category of writing. Nearly 1,700 texts survived from the Tang with ji in their titles, and they are no longer dominated by Buddhist themes.Footnote 7 Early Song compilers of Tang anthologies included ji as a new category of writing, which was further divided into more than twenty subdivisions to reflect the wide range of subject matter in these texts. Not only were there accounts of palaces and government offices, guest houses and post stations, city walls and gates, bridges and sluice gates, monasteries and shrines, and towers and pavilions, but there were also accounts of banquets and memorable events, paintings and antiques, botany and scenic sights, calamities and propitious portents, and so forth.Footnote 8
This long list shows the great diversity in the subject matter of the ji and the great variation in their writing styles. In the early twentieth century, Lin Shu 林紓 (1852–1924) noted the wide range of writings subsumed under the category of ji and, following some earlier scholars,Footnote 9 pointed out the similarities between some ji texts and stele inscriptions: “There are those that fully adopt the writing style of stele inscriptions (beiwen ti 碑文體), and these are [accounts of] shrines, temples, government offices, pavilions, and terraces. There are also those that merely provide an account of events and are not carved in stone, and these are [accounts of] scenic landscape and travel experiences” (所謂全用碑文體者, 則祠廟廳壁亭台之類; 記事而不刻石, 則山水遊記之類.)Footnote 10 Thus, Lin divides the ji writings into several categories: those about bridges and dikes, shrines and offices, and pavilions and terraces; those about calligraphy, paintings, and antiques; those about scenic sights; those that record miscellaneous and unusual events; those about schools; and those about banquets and literary gatherings. “They are all categorically called ji, but in fact, their styles of writing are not the same” 綜名為記, 而體例實非一.Footnote 11
Although Lin placed accounts of schools (xueji 學記) into a category separate from those of bridges, pavilions, and government offices on the ground that “those of schools are argumentative essays” (shuoli zhi wen 說理之文), these two types of ji share many similarities with each other and, as Lin pointed out, with stele inscriptions. They were both commemorations of specific construction projects (such as the building or renovation of a school, bridge, or office) and often carved in stone.
This overview of the ji as a category of writing is important for deciding the appropriate scope of this study. It suggests that commemorative accounts for schools were, in fact, very similar to stele inscriptions (bei 碑 or beiming 碑銘). Any study of the accounts for schools should also include stele inscriptions in the analysis, despite the apparent difference in their titles. The choice of terms between bei 碑 and ji 記 reflected, in some measure, a change in literary convention from the Tang to the Song. Take commemoration of Confucian shrines and local schools for example. During the Tang and the Tang-Song interregnum, nine commemorative texts for Confucian shrines and local schools were titled ji and fifteen bei or beiming (stele inscriptions). In the Song, only fourteen were titled bei and 569 were called ji. Therefore, in this study, I make no distinction between accounts (ji) and steles (bei) for local schools. Both are included in the analysis and, for simplicity, I refer to both types of writings categorically as inscriptions.Footnote 12
Local Government Schools
The local government school was an institution that underwent significant transformation in Tang-Song times. In brief, the distinction between a school and a Confucian shrine was never absolute in the Tang and Song. Many local government schools were developed from existing Confucian shrines in the first century of the Song, and thereafter they continued to expand in space and function. By the end of the Song, the local government school in many places was an architectural complex that consisted of educational and living facilities for students, administrative offices for instructors, land endowments that paid for its operating expenses, as well as a variety of shrines that were dedicated to Confucius, meritorious local officials, virtuous local men, and Neo-Confucian masters.
Local government schools and Confucian shrines had an entangled relationship in the Tang-Song period. The local government school was never a purely educational space, nor was the Confucian shrine a purely ritual one. The close relationship between the two dated from no later than the sixth century. The first Confucian shrine was erected on the campus of the Imperial University in the fourth century,Footnote 13 and in 550 the practice spread from the capital to the prefectures when the court of Northern Qi mandated the erection of a Confucian shrine in each prefectural school. This practice was inherited and reaffirmed by the Sui and Tang dynasties. In 630 the Tang required that county schools also have Confucian shrines on their premises, like their prefectural counterparts.Footnote 14 However, scholars have rightly questioned how widely government schools were established in the prefectures and counties during the Tang. Even in those places where they did exist, these schools probably had very few students. In any event, there is clear evidence that on the campus of many local schools, most buildings had collapsed during the late Tang and Tang-Song interregnum, leaving only the Confucian shrine standing where local people came to worship Confucius as a deity with supernatural powers.Footnote 15
This situation persisted into the early Song. At the turn of the eleventh century, when local officials and local men took an interest in reviving the schools, they renovated the Confucian shrine and expanding its function by building new educational facilities in its environs (e.g., lecture halls, libraries, kitchens, and student dorms). In 1006, following an edict calling upon prefects to build shrines to Confucius, the Song court instructed them also to “erect a lecture hall inside the compound of the Confucian shrine, gather students, and select learned men of refined manners and with teaching qualifications as their instructors.”Footnote 16 This gradually transformed what had been primarily a religious space into an architectural complex with educational and ritual functions. Over the course of the eleventh century, as court officials repeatedly made local schools a critical component of their reform programs and the student body at local schools expanded, their educational functions received more support and attention, eventually overtaking the Confucian shrine in significance.
This cautions us not to overstate the differences between inscriptions ostensibly dedicated to local Confucian shrines and those to local government schools. In many cases, the differences between these two types of inscriptions are more apparent than real. For example, in an inscription that celebrates a recent renovation of a Confucian shrine, one may well find evidence that the educational facilities on the premises were also restored. Consider, for example, the Tang dynasty inscription that Han Yu 韓愈 (768–824) wrote for the Confucian shrine in Chuzhou 處州 (Zhejiang). Although it was titled “Stele for the Confucian Shrine in Chuzhou” (處州孔子廟碑), Han's inscription nevertheless mentions that after the Confucian shrine was restored, the prefect in charge of the restoration also recruited students from talented local men, established a lecture hall (jiangtang 講堂) for them, and provided an endowment to support their studies.Footnote 17 There is a similar case in the early Song. In his 985 inscription dedicated to the renovation of the Confucian shrine in Sizhou 泗州 (Anhui), Xu Xuan 徐鉉 (916–991) mentioned that after Great Sacrificial Hall and the entrance of the compound was restored, the man who sponsored the project also built a “hall for lecture and discussion” (講論之堂) on the premises.Footnote 18 Therefore, the activities commemorated in these inscriptions were not very different from many inscriptions ostensibly dedicated to local schools. For example, in the inscriptions that commemorated the building of county schools in Fengxin 奉新 (Jiangxi) and Xianyou 仙遊, the local officials first built the Confucian shrine and then added the studying and living facilities for the students.Footnote 19
Thus, inscriptions ostensibly dedicated to the Confucian shrines and those to local schools may have documented very much the same activities in the same educational-ritual space. The difference in their titles reflects little more than their authors’ personal preference for emphasizing either the ritual or educational function of this space.Footnote 20 Consequently, from the eleventh century onward, the local school's educational function received more attention than its ritual function, and correspondingly more and more of the inscriptions put emphasis on the schools instead of their Confucian shrines (Figure 1).
Dedication of Inscriptions

For this reason, this study does not make a distinction between inscriptions for Confucian shrines and local schools. The corpus of source materials in this study includes 521 inscriptions dedicated to the government schools (and their educational facilities)Footnote 21 as well as 64 inscriptions dedicated to the Confucian shrines in Song times.
Besides those dedicated to local government schools and Confucian shrines, source materials in this study also include inscriptions that reflect how the local government school, as a state-sponsored institution as well as a multi-functional architectural complex, continued to evolve from the eleventh through the thirteenth century. Over time, land endowments were established to finance its operation, administrative offices built for their instructors, and shrines were erected on the school premises in honor of a diversity of figures. For this reason, I have also included in this study 125 inscriptions for various shrines erected on the premises of local government schools, twenty-five inscriptions for the instructor's administrative offices (jiaoshou ting 教授廳), and thirty-eight inscriptions for school endowments (Table 1).
Song-Dynasty School Inscriptions by Types of School Facilities

On the other hand, I have excluded from this study inscriptions that are unrelated to local government schools. To effectively demonstrate the growth of Neo-Confucian influence on local government schools after the mid-twelfth century (which I will discuss later in this article), I have excluded inscriptions for the academies (shuyuan 書院), because they proliferated only in the Southern Song and were closely associated with the Neo-Confucian movement.Footnote 22 To include them in this study would prevent one of the analyses discussed later in this article. Also excluded from this study are inscriptions for examination facilities (e.g., examination halls (gongyuan 貢院) and travel funds for metropolitan examination candidates (gongshi zhuang 貢士莊)); inscriptions celebrating examination success (i.e., name lists of jinshi degree-holders, or jinshi timing 進士題名); and a small number of inscriptions for clan schools, the National University (taixue 太學), and schools for imperial clansmen (zongxue 宗學).
Ninety percent of the 773 inscriptions in this study are preserved in local gazetteers (fangzhi 方志) and the collected works (wenji 文集) of individual authors: 182 inscriptions are found both in their authors’ collected works and at least one local gazetteer, 156 only in the collected works of individual authors, and 360 only in local gazetteers. Altogether, local gazetteers and the authors’ collected works provide 682 of the inscriptions in this study. Of the remaining seventy-five extant inscriptions, eighteen are rubbings of actual steles (tapian 拓片) or printed transcriptions of the steles (jinshi lu 金石錄), and another fifty-three are from local and national anthologies (zongji 總集) and pre-twentieth-century encyclopedias (leishu 類書). In short, collected works of individual authors are an important source—though, by no means a predominant one—of the school inscriptions in this study. The proportion of school inscriptions preserved in the collected works do not fluctuate much over the course of the Song. Most of the time, it is around 40 percent with a margin of ten percentage points on either side.
In brief, this study takes local government schools as its subject of investigation. Given that the local government school was an evolving institution and educational-ritual space, I have included in this study all the inscriptions pertaining to the founding and development of local government schools and their operations. They include both inscriptions that are titled “steles” and those titled “accounts.” They include inscriptions ostensibly dedicated to the school and its educational facilities, as well as those dedicated to its instructor's office, its endowment, its Confucian shrine, or any shrine that was part of its architectural complex. Together, the corpus of inscriptions in this study includes 773 titles written by 524 unique authors.Footnote 23 For convenience, in what follows, I refer to them categorically as “school inscriptions” regardless of whether they were dedicated to the school, its endowment, the Confucian shrine, or something else.
Trends
The corpus of 773 school inscriptions from the Song represents an exponential growth from Tang times. The expansion of civil service examinations, state sponsorship of education, and the growing availability of books facilitated by the spread of printing led to an enduring passion for building schools and other educational facilities in the Song period. Accordingly, the composition of school inscriptions became a popular practice in Song times. A quick comparison suffices to highlight this change. While only three inscriptions from the Tang commemorate the building and restoration of local schools (two in the eighth century and the third in the ninth),Footnote 24 547 inscriptions dedicated to local schools are extant from Song times. Likewise, twenty-two inscriptions survive from the Tang and the Tang-Song interregnum that commemorate the construction and renovation of Confucian shrines in the prefectures and counties, while sixty-four are known from Song times. In addition, there are also 188 inscriptions from the Song, which commemorate the establishment and restoration of school endowments, the building of instructor's offices, and the erection of various shrines on the school campus. In sum, the corpus of extant inscriptions pertaining to local government schools and their operations in the Song was thirty times that of the Tang total.
The temporal distribution of the extant school inscriptions from Song times reveals an unambiguous upward trend over the course of the dynasty with two notable spikes: first in the 1040s and then in the 1140s (Figure 2).
Number of School Inscriptions by Period

Only seven school inscriptions have survived from the first forty years of the Song rule. Thereafter, the number of school inscriptions began to increase. In the first forty years of the eleventh century, thirty-two inscriptions are extant. By contrast, in the 1040s, the number of extant inscriptions increased dramatically, with thirty in that decade, evidently a result of the court's decision to establish a national network of schools in the Qingli reign (1041–1048). The interest in building, restoring, and writing for local schools stayed at this high level until 1100, with constant production of twenty to thirty inscriptions per decade in the half-century between 1050 and 1099 and only a brief drop in the 1070s.Footnote 25 It is unclear whether the relatively lower numbers of inscriptions from the 1070s and 1100–1119 reflected a low tide in building and renovating government schools or a mere historiographical bias. Since these were the times when the reform factions of Wang Anshi 王安石 (1021–1086) and Cai Jing 蔡京 (1047–1126) dominated court politics and expanded the state-sponsored educational system, a sudden decline of interest in building and writing for local schools seems somewhat unimaginable.Footnote 26 A more plausible explanation appears to be historiographical. People seeking inscriptions for local government schools often sought them from men with higher political status. During the 1070s and 1100–1119, these men would have been supporters of the New Policies. Because the New Policies were stigmatized after the fall of the Northern Song, very few of these men's collected works (wenji) were preserved, and this must have significantly reduced the survival rates of the school inscriptions they had composed. In any event, the trend here shows that the construction, expansion, and renovation of local schools was not seriously affected by shifting political winds at court. Even in the Yuanyou reign (1086–1094), when the anti-reform politicians were back to power, government sponsorship of local schools remained at high levels. From 1086 to 1094, twenty-nine inscriptions are extant for local schools.Footnote 27
The early Southern Song marked another milestone in state sponsorship of local schools. The central and local governments acted swiftly to revive local schools immediately after the Song signed the peace treaty with the Jurchens in 1141. In 1143–1144, the court instructed prefects and magistrates to restore and renovate local government schools.Footnote 28 In many places, however, local officials had already taken action before the court urged them to. The first six years following the signing of the peace treaty witnessed an unprecedented high tide of building and renovating local schools of the entire Song period, with forty-three inscriptions produced during the six years between 1141 and 1146. This high level of activity lasted for a century. From the 1140s onwards, school inscriptions continued to appear at a rate of about thirty to fifty per decade until after the 1240s when war broke out with the Mongols. As a result, more than 70 percent of the inscriptions in the corpus were from the Southern Song period.
This trend was national. The two spikes in the 1040s and 1140s were noticeable, with roughly the same magnitude and rhythm, in nearly all the physiographic macroregions (PMRs), as defined by G. William Skinner (Figure 3). Although the total number of school inscriptions increased over the course of the dynasty, the spatial distribution of these inscriptions, in terms of percentage, remained fairly consistent at all times (Table 2). For a meaningful comparison between the two halves of the Song, let us consider only the inscriptions written for schools in the south. From the Northern to Southern Song, there was only a slight increase (five percentage points) in the percentage of extant inscriptions for schools in the Lower Yangzi and the Southeast Coast and, correspondingly, a slight decrease (six to seven percentage points) in the percentage of inscriptions for the Middle and Upper Yangzi regions. This Northern–Southern Song continuity is also noticeable at the subregional level. In both halves of the Song, more than half of the extant school inscriptions for the Middle Yangzi, for example, were for schools in the Gan Basin.
School Inscriptions in the South, by PMR and Period

Spatial Distribution of School Inscriptions by Period

Note: To allow for a meaningful comparison between Northern and Southern Song, inscriptions for schools in North and Northwest China are excluded from the statistics in this table. In the Northern Song, local officials in North and Northwest China were also very active in establishing and sponsoring local schools. Thirty-nine percent of the inscriptions in the Northern Song were for schools in North and Northwest China, and sixty-one percent were for schools in the south.
The spatial distribution of extant inscriptions suggests that in both halves of the Song, efforts to build, restore, expand, and renovate government schools were disproportionately undertaken in the resource-rich cores of macroregions. Because of the lack of socioeconomic data of sufficient quality and detail before the twentieth century, the delineation of regional cores and peripheries in Map 1 and Table 3 are based on statistics from the 1990 census. Therefore, the boundaries of these cores and peripheries are no more than rough approximations for those in the Song period. That the delineation of these boundaries also considers physiographical features (such as rivers, ridgelines, slope, and the transportation network), which profoundly shaped the hierarchical patterns of social and economic activities in pre-industrial societies, gives some confidence of their relevance for the Song period. Thus, although the delineation of cores and peripheries is only an approximation, the distribution of extant school inscriptions in cores and peripheries still reveals a meaningful pattern. In both halves of the Song, more than forty percent of the surviving inscriptions were for schools located in regional cores, which comprised only roughly fourteen percent of the total area of the Song territory. Accordingly, traveling from the regional cores to the peripheries, the density of extant school inscriptions dropped precipitously from about twenty to about six or fewer per 100,000 square kilometers in the Northern Song and from about seventy to twenty-five or fewer in the Southern Song. As Skinner posited, the regional cores before the twentieth century were river-valley lowlands where a higher proportion of fertile arable land brought about higher agricultural productivity per unit of area and a higher population density, which in turn encouraged capital investment in infrastructure and, along with the low unit cost of water transport, facilitated the growth of commerce.Footnote 29 Thus, it comes as no surprise that the schools, for which there are inscriptions, concentrated also along the major communication routes, such as the corridor between Chang'an and Luoyang, between Shaanxi and the Chengdu Plain, along the Grand Canal, the Gan and Xiang Rivers in Middle Yangzi, and the Min River in Fujian.Footnote 30 This suggests that in Song times physical and economic geography provides a more meaningful way for understanding the spatial pattern of school activity than conscious spatial organizing units (e.g., circuits). The following analysis will, therefore, use physiographical regions, instead of administrative units, as a way of assessing the national and regional influence of the authors of the school inscriptions.
Location of Schools with Extant Inscriptions

Distribution of School Inscriptions in Regional Cores and Peripheries

Note: Only macroregions within the Song territory are included. For the Northern Song, these macroregions include North and Northwest China, the Upper, Middle, and Lower Yangzi, the Southeast Coast, and Lingnan. For the Southern Song, these include the Upper, Middle, and Lower Yangzi, the Southeast Coast, and Lingnan. The coded values for the Core Periphery Zones are taken from G. William Skinner and based on socioeconomic data of 1990.
In brief, throughout the Song dynasty, local officials across the country were actively engaged in building and restoring government schools, expanding their scales and functions, and providing financial support for their operations. In celebration of these activities, the Song authors composed a great many inscriptions that far surpassed the number of such inscriptions in the Tang. These inscriptions are not evenly distributed across the three centuries of the Song. Instead, the number of school inscriptions that survived from each decade of the Song shows a clear upward trend, which was marked by two major turning points: the first in the mid-eleventh century and the second in the mid-twelfth century. These were not short-lived bursts. Rather, both mid-century spikes generated a new level of activity on local government schools, which was sustained in the ensuing century. Consequently, the number of extant inscriptions increased significantly over the course of the Song dynasty. Prior to 1040, fewer than ten school inscriptions were extent from each decade. This figure rose to over twenty between 1040 and 1100 and over forty between 1140 and 1239. Thus, although the Northern Song was conventionally well known for its three waves of reforms that expanded the state education system, the renovation, expansion, and support for local government schools reached new heights in the Southern Song. In fact, Southern Song authors produced twice as many inscriptions for local schools as their Northern Song counterparts.
Accounts as Discourses
School inscriptions in the Song dynasty were not simply commemorative or laudatory. Many were argumentative and even polemical, and Liu Guangzu's inscription for the Fucheng county school was an example. This reflects broad changes in the content and style of ji writings that took place during the Tang-Song period.
As literary scholars have noted, the early Tang authors of ji typically focused on the narration of events (xushi 敘事) and the description of objects (miaoxie 描寫 or zhuangwu 狀物). In the late eighth and ninth centuries, however, famous essayists like Han Yu and Liu Zongyuan 柳宗元 (773–819) enriched and enlarged the scope and depth of the genre by injecting lyrical expression (shuqing 抒情) and argument (yilun 議論) into the ji they wrote. Nonetheless, until the late Tang, argumentative elements remained very limited, and they were not based solely on reason. Instead, they tended to be inspired by the encounter between the author's personal history and the outside world they were describing and, therefore, heavily colored by their personal feelings. In his study of Liu's eight accounts of the landscape in Yongzhou (Hunan), Anthony Pak Won-Hoi argues that “Liu's argumentation is, in fact, a mixture of the argumentative and lyrical modes of expressions,” so that it should be considered “emotional thought.”Footnote 31 While his discussion is of Liu's accounts of scenic sights, argumentative elements are also weak in other types of ji writings by Tang authors. Tang accounts of construction projects (yingzao ji 營造記) typically focus on recording the course of the event and include only a brief discussion at the end that celebrates the merits of the project's major contributors.Footnote 32
In Song times, by contrast, argumentation became a crucial element in many commemorative accounts and the dominant mode of expression in some. Song authors typically adopted a mixture of narrative and argumentative expressions when writing these essays. Some went as far as to ignore all the details of the event they were commemorating, but instead seized the occasion primarily to articulate their own views on a related topic.Footnote 33 As Chen Shidao 陳師道 (1053–1101) opined, “When Han Yu was writing a ji, he did no more than provide an account of the event. The accounts (ji) today are, in fact, discourses (lun 論).”Footnote 34 This argumentative inclination was particularly pronounced in the commemorative accounts for schools, so much so that Lin Shu placed them in a separate category from the accounts of other types of buildings.
That school inscriptions in the Song were avenues for promoting specific views of learning raises a series of questions: What views, and whose views, were voiced in these inscriptions? How much influence did they have? In the following sections, I will address these questions by examining the authorship and themes in the Song school inscriptions with the aid of network and text analyses.
Networks
The 773 extant inscriptions in the corpus were composed by 524 unique authors. The distribution of school inscriptions among the authors follows the Pareto Principle (i.e., that roughly 80 percent of the effects come from 20 percent of the causes). In this case 433 authors had only one extant inscription, while the remaining ninety-one authors contributed 340 inscriptions to the corpus (i.e., three to four inscriptions per author on average). Of these ninety-one authors, the most prolific six contributed 12 percent of the inscriptions in the corpus (Figure 4). These men included Zhu Xi 朱熹 (1130–1200), Zhang Shi 張栻 (1133–1180), Wei Liaoweng 魏了翁 (1178–1237), Zhou Bida 周必大 (1126–1204), and Wang Sui 王遂 (jinshi of 1202). Whether an author's collected works, if ever compiled, have survived into this day provides only a partial explanation, at best, for the uneven distribution of extant inscriptions among different authors.Footnote 35 On the one hand, authors whose collected works have survived are more likely to have more than one extant inscription in my corpus. Of the 524 authors, 144 (i.e., about a quarter) had collected works that have survived; and of these 144, sixty-six (i.e., 45 percent) have more than one extant inscription. By comparison, of the 380 authors who either do not have a wenji or whose wenji has not survived, only twenty-five (i.e., a mere 6 percent) had more than one extant inscription. On the other hand, the potential historiographical bias caused by the condition of an author's wenji must not be overstated. Less prolific writers may have never had a wenji in the first place. Moreover, of the 144 authors whose collected works have survived, seventy-eight nevertheless has only one extant school inscription. Even among the top six most prolific writers, one (Wang Sui) does not have an extant wenji. All of Wang's eight school inscriptions are preserved in local gazetteers compiled at different times and in different places.
Distribution of School Inscriptions per Author

The number of inscriptions from an author bespeaks only one facet of an author's influence. Compare, for example, Chen Zao 陳造 (1133–1203) and Hong Mai 洪邁 (1123–1202). Chen was a man of Gaoyou Military Prefecture 高郵軍 (Jiangsu), who obtained the jinshi degree in 1175 and embarked on a career in government that culminated in a staff position in the Military Commission of Huainan West Circuit. He had five inscriptions in the corpus. Three of them were for prefectural and county schools in Gaoyou, his home prefecture, and the other two were for schools in Chuzhou 楚州 and Yangzhou 揚州, both within a hundred-kilometer radius of Gaoyou. This contrasts with the inscriptions from Hong Mai, Chen's contemporary and a native of Poyang 鄱陽 (Jiangxi), who passed the examinations in 1145 and held a series of prominent positions at court and in the provinces. Hong had four school inscriptions in the corpus, but only one was for a school adjacent to his home prefecture. His three other inscriptions commemorated activities in local government schools of a vast geographical area that included modern Henan, Fujian, and Guangxi provinces. Some of these activities were undertaken by Hong himself, and others by his friends.
This suggests that to gauge an author's influence, one needs to take into consideration not only how prolific he was but also how widely he projected his influence. Therefore, this section looks at the spatial distribution of school inscriptions from each author. It first constructs a bipartite network, where each link connects an author and the location of each school for which he composed an inscription. The locations are first aggregated into different prefectures and then into different physiographic macroregions (PMRs).Footnote 36
Authors who wrote for schools in two or more prefectures in the same PMR are considered men of regional influence, while those who have extant inscriptions for schools in different PMRs are considered men of national influence. Because an author must have at least two extant inscriptions in the corpus to allow for a meaningful interpretation of whether his influence was confined to the same PMR, those with only one extant school inscription in the corpus are excluded from this analysis. This reduces the number of authors in the corpus from 524 to ninety-one. Of these ninety-one authors, about half (forty-three) wrote only for schools in the same PMR. Nearly always, these were the PMRs where their home prefectures were located,Footnote 37 indicating strongly that their influence—like that of the aforementioned Chen Zao—was confined to their home region. By contrast, the other half (forty-eight authors) had more or less national influence, having produced inscriptions for schools in different PMRs. Among these forty-eight authors, twelve superstars wrote for schools widely distributed in three or four PMRs (Table 4).Footnote 38
Distribution of Authors by the Number of PMRs Where They Had Inscriptions

Note: The number of authors whose collected works have survived is reported in parentheses.
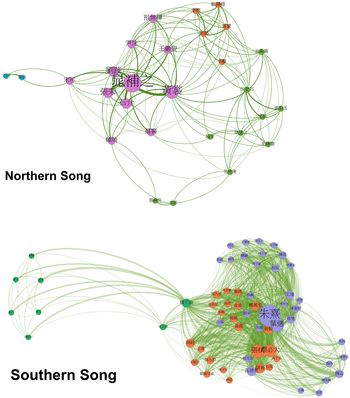
To assess the relative importance of different regional and national influencers, this bipartite network (Figure 5) between authors and school locations is transformed into a one-mode author-by-author network where a link is created for any two authors who wrote for state schools in the same PMR. For example, if one author wrote for schools in both the Lower and Middle Yangzi and another for schools in the Lower Yangzi and the Southeast Coast, a link is established between the two authors because they both broadcast their views in the Lower Yangzi region. The strength of this link, which depends on both authors’ magnitude of influence in the region, is measured by multiplying the number of inscriptions each author wrote for schools in that region. The derived network, therefore, maps overlapping spheres of influence. In this network, authors who were active, primarily or exclusively, in the same macroregion formed a closely connected subgroup with one another, whereas authors connecting these subgroups were those who managed to broadcast their views in multiple macroregions and enjoyed nation-wide influence. To measure these network properties, I have conducted two types of analyses. One of them partitions the network into subgroups using the algorithms of modularity analysis and core-periphery analysis, and the other evaluates the importance of each individual author in the network as a bridge between different subgroups by calculating their betweenness centrality.
Bipartite Networks between Author and School Location in the Northern and Southern Song

To capture historical change, the author-by-author network data is split into two subsets based on the year each inscription was written. I use 1126 as the cut-off year because it marked not only the end of Northern Song but also the emergence of Neo-Confucian themes in the corpus (discussed below). Since very few school inscriptions were composed between 960 and 1039, the structural properties of the derived Northern Song network reflect mainly the situation after 1040.Footnote 39
The Separation and Bridges
A study of the betweenness scores (Table 5) leads to two findings. The first is the marked separation between the Upper Yangzi (Sichuan) and other macroregions in both Northern and Southern Song networks (Figure 6). In both networks, there was close interaction among the macroregions in the eastern half of the Song (North China, Lower and Middle Yangzi, and the Southeast Coast), but a much weaker connection between these regions and the Upper Yangzi. Take, for example, the eleven Northern Song authors who wrote for schools in the Middle Yangzi. Two of them also wrote for the Lower Yangzi, one for the Southeast Coast, one for North China, and another one for Lingnan. None of them wrote for schools in the Upper Yangzi. On the other hand, none of the authors who wrote for schools in the Upper Yangzi composed inscriptions for other regions, with the singular exception of Song Qi 宋祁 (998–1061) who also had an inscription for a school in North China. This pattern persisted in the Southern Song. During the Southern Song, the exchange of ideas in the eastern half of the empire (Middle and Lower Yangzi, the Southeast Coast, and even Lingnan) grew more intense than before, but the interaction between the east and the Upper Yangzi remained limited and only through the mediation of two figures: Wei Liaoweng and Chao Gongsu 晁公遡 (jinshi of 1138).
Author-by-Author Networks in the Northern and Southern Song

Betweenness Scores of Authors

Note: An author whose collected works have not survived is marked with an asterisk.
This geo-network structure explains the exceptionally high betweenness scores of Song Qi, Wei Liaoweng, and Chao Gongsu in the networks, which attest to their unparalleled importance as an intellectual bridge between the Upper Yangzi and the other macroregions. An author's betweenness score measures his ability to control information and disseminate ideas in the network. Mathematically, it is the number of times this author appears on the shortest links between any other two authors in the network. Thus, a higher score of betweenness indicates a more dominant role in information dissemination.Footnote 40 Since authors writing for the same macroregion are, by definition, pulled into separate clusters in the author-by-author network, a high betweenness score indicates a strong ability to bridge different regional clusters and broadcast views in multiple regions. An author's betweenness score is, therefore, positively correlated to both the size of the potential audience in each macroregion for which he functioned as an intellectual bridge (measured by the number of authors writing only for this region) and the frequency with which he played this role (measured by the total number of inscriptions he wrote for these regions and reflected in the edge weight between him and other authors), and it is also negatively correlated to the number of alternative bridges between these macroregions.Footnote 41 The combination of these three factors resulted in the high betweenness scores of Song, Wei, and Chao, who were unrivaled in their role of facilitating the exchanges of ideas between the Upper Yangzi and the other macroregions. By contrast, famed and prolific authors such as Zhu Xi, Zhang Shi, and Ye Shi had considerably lower betweenness scores. While they wrote a large number of school inscriptions and were active in three or more macroregions, these men had connections only in the east. The presence of other men (e.g., Hong Mai) playing similar roles in the eastern macroregions made them less unique and less indispensable.
A close look at men with high betweenness scores also leads to a second observation: that is, the growing importance of Neo-Confucian philosophers, surpassing that of prose writers, as an intellectual bridge in the network who managed to broadcast their views of learning in different regions. Of the three national influencers who wrote for the Upper Yangzi, both of the two earlier ones (Song Qi and Chao Buzhi) were famed prose writers who had a connection to Sichuan. Song was posted to Sichuan in the eleventh century, while Chao relocated there during the Jurchen invasions of the early twelfth century.Footnote 42 In the thirteenth century, by contrast, the role of these prose writers was taken over by Wei Liaoweng, a leading Neo-Confucian philosopher from Sichuan with national renown.
The same trend is also notable in the eastern macroregions. In the Northern Song network, men with high betweenness scores in the eastern macroregions were mainly prose writers. Some of them had high-ranking offices in the State Council, such as Fan Zhongyan 范仲淹 (989–1052), Wang Anshi, and Wang Yansou 王巖叟 (1043–1093). Many others held only middle-ranking appointments such as censors, ministers, Secretariat Drafters, and prefectural governors. These included authors like Wang Yuchen 王禹偁 (954–1001), Yin Zhu 尹洙 (1001–1047), Zu Wuze 祖無擇 (1011–1085), Cai Xiang 蔡襄 (1012–1067), and Huang Chang 黃裳 (1044–1130).
Of these famed prose writers, some were also classicists but none had a connection to the Neo-Confucian movement. Huang was ranked first in the civil service examination of 1082 and known for his specialized knowledge of court rituals. He was the only person who wrote for schools in four different PMRs during the Northern Song, and this gives him the highest betweenness score in the entire network, surpassing that of Song Qi. Li Gou 李覯 (1009–1059) was a renowned classicist, but his focus was more on statecraft than moral philosophy.Footnote 43 Zu Wuze 祖無擇 (1011–1085) studied with the classicist Sun Fu 孫復 (992–1057) early in his life, though he was known primarily for his literary and administrative skills. None of the Northern Song intellectuals traditionally associated with the Neo-Confucian movement (such as Zhou Dunyi, the Cheng brothers, Zhang Zai, and their disciples) wrote inscriptions for local government schools.
By contrast, the prominence of the Neo-Confucian moral philosophers is conspicuous in the eastern macroregions of the Southern Song network. Here the most important intellectual bridges included Hong Mai, Zhu Xi, Ye Shi 葉適 (1150–1223), and Zhu's disciple Huang Gan 黃榦 (1152–1221), all of whom had inscriptions for three or more PMRs. Of these leading figures, all but Hong Mai and Ye Shi were Neo-Confucian moral philosophers. Among those who were next in structural importance, Neo-Confucians were also numerous and they came from a great diversity of intellectual lineages in the movement. As much as Zhu Xi later tried to purge his influence and diminish his standing, Zhang Jiucheng 張九成 (1092–1159) was a leading figure in the first generation of Southern Song Neo-Confucian philosophers. Hu Yin 胡寅 (1098–1156) and Zhang Shi carried forward the intellectual legacy of Hu Anguo 胡安國 (1074–1138), whose influential teaching career in Hunan during the early Southern Song had turned the area into a major center of Neo-Confucian ideas. Both Zhen Dexiu 真德秀 (1178–1235) and Huang Zhen 黃震 (1213–1280) traced their intellectual descent to Zhu Xi's disciples. They, alongside Wei Liaoweng and Huang Gan, were among the best known Neo-Confucian philosophers in Zhu Xi's tradition in the thirteenth century. Yang Jian 楊簡 (1141–1226), Yuan Xie 袁燮 (1144–1224), and Xie's son Fu 甫 (1174–1240) were Mingzhou (modern Ningbo) men who transmitted the learning of Lu Jiuyuan 陸九淵 (1139–1192). Some, like Bao Hui 包恢 (1182–1268), were influenced by the ideas of both Zhu Xi and Lu Jiuyuan.Footnote 44
Admittedly, the Neo-Confucians were not the only men who spread their views in different macroregions. In both the twelfth and the thirteenth centuries, they had rivals. Among their rivals were both statecraft thinkers (e.g., Ye Shi, Tang Zhongyou 唐仲友 (1136–1188), Chen Qiqing 陳耆卿 (1180–1236), and Wu Ziliang 吳子良 (b. 1197)) and famed prose writers and poets (e.g., Chao Gongsu, Hong Mai, Zhou Bida, and Yang Wanli 楊萬里 (1127–1206)).
Despite this great diversity of literary and philosophical pursuits that these authors represented, the growing influence of Neo-Confucianism in the network is evident in the fact that many of the Southern Song prose writers and poets, unlike their Northern Song counterparts, came under a strong Neo-Confucian influence. Yang Wanli was a famed poet but also deeply interested in Neo-Confucian thought. So was Liu Kezhuang 劉克莊 (1187–1269). Although he made a name for himself in history as a poet and literary critic, Liu was also a convinced disciple of Zhen Dexiu. Likewise, Xie E 謝諤 (1121–1194) was known mainly for his literary skills, but he also studied with Guo Yong 郭雍 (1091–1187), son of Cheng Yi's disciple Guo Zhongxiao 郭忠孝, and was an influential teacher of Neo-Confucian thought. Liang Yi 梁椅 started his career as a writer but, in his later years, was said to have devoted himself to the learning of the Cheng brothers and Zhu Xi.
The Core Groups
The prominence of Neo-Confucian authors in the Southern Song network is also borne out by core-periphery and modularity analyses (Table 6). Whereas betweenness scores draw attention to the role of individual authors as bridges between otherwise disconnected subgroups in the network, core-periphery and modularity analyses seek to assign individual authors into meaningful subgroups. Core-periphery and modularity analyses each operate with a different assumption about network structure. The classical algorithm of core-periphery analysis assumes that there is a densely connected subgroup of authors (the core) in the network who also have access to many other parts of the network (the periphery), while these other parts are weakly linked among themselves and have to depend on the core to reach one another. Modularity analysis, by contrast, does not posit the existence of a single core but seeks to partition the network into different clusters (i.e. modularity classes) so that authors in the same cluster have dense connections with each other but sparse connections with those in other clusters. In brief, modularity analysis works best with networks where multiple hubs and clusters are present, while the classical algorithm of the core-periphery analysis is best for describing the structural properties of a network that has a single dominant hub.
Coreness Scores of Authors

Note: An author whose collected works have not survived is marked with an asterisk.
The way in which author-to-author networks are constructed in this study places all the regional influencers in separate clusters, while national influencers who are active in multiple macroregions serve as bridges and perform the critical function of integrating different clusters into a more cohesive network. Therefore, modularity and core-periphery analyses complement each other by focusing respectively on the clustering and integrating forces in the network. In the Northern Song, the relatively small number of authors and school inscriptions has limited the degree of cohesion between different macroregional clusters. With the exception of Huang Chang, who wrote for schools in four different macroregions, all national influencers in the Northern Song network wrote only for schools in two macroregions. This gives Huang the highest coreness score and makes him the most central node in the network. Although Huang was a native of Fujian, more of his inscriptions were dedicated to schools in North China than anywhere else. The combined effect is a core group of authors in the Northern Song network that consisted only of two men, including Huang and a North China regional influencer (Chao Buzhi 晁補之 (1053–1110)). Both were embedded in a cluster that had North China as its primary sphere of influence.
In the Southern Song network, by contrast, the core group was no longer embedded in any single regional cluster. Instead, it consisted of four national influencers whose primary sphere of influence varied but also overlapped. Their wide and overlapping spheres of influence, compounded by their high productivity as authors of school inscriptions, made them the most critical nodes in integrating the different regional clusters of the network. Of these four authors, two (Zhang Shi and Zhou Bida) wrote predominantly for schools in the Middle Yangzi and two others (Zhu Xi and Ye Shi) were most active in the Southeast Coast. But they, except Zhou, also had a good number of inscriptions for schools in other macroregions (Map 2).
Location of Schools with Inscriptions from Core Authors

The core-periphery analysis corroborates what has been revealed in the betweenness analysis: prose writers who had dominated the Northern Song network gave way to a more diverse group of scholars under a strong Neo-Confucian influence. The Northern Song core group was constituted by Huang Chang and Chao Buzhi, both renowned prose writers. By contrast, the Southern Song core included a prose writer-cum-statesman (Zhou Bida), a statecraft thinker (Ye Shi), and two leading Neo-Confucian philosophers (Zhu Xi and Zhang Shi).
Charles Hartman has argued cogently that the Neo-Confucian intellectual dominance in the Southern Song resulted in the greater survival of writings by Neo-Confucian scholars, thus coloring historical records.Footnote 45 That the most influential authors of school inscriptions came from a Neo-Confucian background in the Southern Song and that these inscriptions had greater and greater Neo-Confucian content (see next section) perhaps reflects, more or less, the biased transmission of Southern Song texts in favor of Neo-Confucian authors. Since the collected works of Southern Song Neo-Confucian scholars had greater chances of surviving intact into modern times, it is natural that their influence is less likely to be underestimated than that of non-Neo-Confucian authors whose collected works are often lost or have survived only in fragments. As Tables 5 and 6 demonstrate, men with high betweenness and coreness scores are, with few exceptions, indeed men whose collected works have survived.
Although this historiographical bias may have magnified the prominence of Neo-Confucian authors in the Southern Song network, its impact should not be overstated. As I have discussed earlier, historiographical bias was often entangled with actual historical change: although modern historians are prone to underestimate the influence of men whose writings have not survived intact into our times, the chance of survival of an author's writings was itself a product of his influence. Thus, it is reasonable to consider that the growth of the Neo-Confucian voice in school inscriptions and the greater survival of their writings, in general, are a product of the same historical phenomenon (namely, their growing intellectual dominance) and that the greater survival of their writings, in turn, amplified the volume of their voice in the school inscriptions. Furthermore, the large quantity of school inscriptions from Neo-Confucian scholars reflects not only the greater survival of their writings but also the close attention they paid to these inscriptions as a means of establishing their intellectual dominance, which stands out in relief against their lukewarm interest in writing for shrines of local deities.
Intellectual Affiliation
The remarkable visibility of Neo-Confucians in the Southern Song network owed much to their intellectual dominance and the greater survival of their writings. But it also had a debt, in large measure, to a growing tendency to consider intellectual affiliation when a person was seeking an author for a school inscription in the Southern Song.
School inscriptions in the Song commemorated a wide variety of projects, such as the building, expansion, and renovation of the ritual and educational facilities, the establishment and restoration of an endowment, and rebuilding the entire school on a different site, and so forth. These projects usually involved the cooperation of a variety of figures, including local scholars, retired officials of local origin, and local administrators at different levels of the bureaucracy. Some brought forward the proposal and some approved it; some made financial contributions and some managed the finances; some supervised the workers and some monitored the progress of the project. Nevertheless, nearly all the school inscriptions credited local administrators—mostly prefects and county magistrates, but sometimes also circuit officials, deputy heads, or others—with being in charge of these projects. The precise role these officials played varied from one project to another. Sometimes they took the initiative to propose the projects, and at other times they only approved proposals from local scholars. Sometimes they only helped cover some of the expenses, and at other times they closely supervised the progress. At any rate, they were, at the very least, the purported overseers of these projects.
At all times in the Song, some of these project overseers took it upon themselves to write the inscriptions. This practice appears to have grown less popular over time, however. The percentage of school inscriptions written by project overseers declined from about one-fifth in the Northern Song to only slightly more than one-tenth in the Southern Song. Correspondingly, about four-fifths of the school inscriptions in the Northern Song and nine-tenths in the Southern Song were authored by men who were not themselves overseers of the commemorated projects. These authors usually wrote in response to the request from a project overseer or from some local men who acted on behalf of the overseer. These authors fell into four major categories: colleagues, personal connections, local affiliates, and intellectual affiliates (Table 7).
Identity of Authors of the School Inscriptions

Note: Authors of some inscriptions had multiple identities (e.g. a man of local origin who also had a position in the local school, or a colleague of the project overseer who also graduated from the same civil service examination class). These inscriptions are counted twice in this table. Therefore, the added total reported in this table is greater than the total number of inscriptions in the corpus.
First, in nearly all the projects the overseers were local officials (especially prefects and county magistrates). Therefore, they frequently turned to colleagues in the local government for school inscriptions. In both halves of the Song, these authors contributed about one-fifth of all the school inscriptions. Some of these colleague-authors were the overseers’ superiors, holding appointments in circuit and prefectural administrations, some their bureaucratic equals (e.g., magistrate of a nearby county or governor of a nearby prefecture), but the majority of them were the overseers’ subordinates, such as local school instructors and staff members in prefectural and county administrations. Although the inscriptions do not always state it clearly, at least some of these subordinates were themselves actively engaged in the commemorated projects, taking on such responsibilities as monitoring the progress and managing the funds.
The second type of authors were the overseers’ personal connections. Some were the overseers’ agnatic and affinal kin. Some were their friends. Some had been close associates of the overseers because they hailed from the same places (tongxiang 同鄉), attended the National University in the same year (tongshe 同舍), graduated from the same civil service examination class (tongnian 同年), or had previously worked together in the same government department (tongliao 同寮). These shared backgrounds and experiences traditionally fostered the growth of a common identity, mutual trust, and close affinity. In both halves of the Song, these men contributed slightly more than one-tenth of the extant school inscriptions.
The third type of authors were men of local origin. Some of these authors were local scholars still studying in the schools and preparing for the examinations, but many had earned metropolitan degrees (jinshi) and held office. These authors also contributed about one-fifth of the inscriptions in the corpus, with a moderate increase from 19 percent in the Northern Song to 24 percent in the Southern Song.
It is the fourth type of authors that deserve emphasis. These authors wrote for local schools mainly because of their intellectual backgrounds and scholarly ties. Compared to the other types discussed above, these men authored only an insignificant share (5 percent) of the inscriptions in the Southern Song, but the growth in their visibility from the Northern to the Southern Song was phenomenal. In the Northern Song, intellectual affiliation mattered only in the writing of one school inscription. In this case, a local scholar from Hongya 洪雅 county of Jiazhou 嘉州 (Sichuan), acting on behalf of the magistrate who carried out the commemorated project, requested an inscription from his own teacher.Footnote 46 In the Southern Song, by contrast, a diversity of intellectual connections played a prominent role in thirty-two inscriptions. Sometimes the authors agreed to write because they were teachers of the project overseers (or men who requested inscriptions on the overseers’ behalf). Sometimes the author and the overseer (or his relatives) studied with the same teacher.Footnote 47 At other times, the project concerned a shrine dedicated to a renowned scholar, of whom the author (or his close relative) was a disciple or with whom the author had received instructions from the same master.Footnote 48
The growing importance of intellectual ties in the writing of school inscriptions was closely linked to the Neo-Confucian movement. First, of the thirty-two Southern Song inscriptions where intellectual ties played a role, nineteen were written to commemorate the shrines dedicated to Neo-Confucian figures, including both renowned Neo-Confucian masters (i.e., Zhou Dunyi, the Cheng brothers, Zhu Xi, and the Lu brothers) and their disciples (e.g., Xie Liangzuo 謝良佐, Huang Gan, and Yang Jian). As I will discuss later, these shrines proliferated from the mid-twelfth century onwards and were emblematic of the Neo-Confucian scholars’ efforts to transform the physical space of local government schools. Not surprisingly, the authors of these inscriptions often came from a strong Neo-Confucian background. The thirty-two Southern Song inscriptions were written by nineteen different authors. Of them, fourteen were Neo-Confucian philosophers (i.e., Zhu Xi, Wei Liaoweng, eight authors who studied with Zhu Xi or Zhu's disciples, three who studied with Lu Jiuyuan or Lu's disciples, and Bao Hui whose family had close intellectual ties to both Zhu and Lu), and two were sympathetic to the Neo-Confucian position (i.e., Liu Guangzu and Wang Sui).
Zhu Xi alone contributed twelve of these thirty-two inscriptions, some at the request of his students and intellectual associates and others by virtue of his reputation as the leading thinker who transmitted the learning of Zhou Dunyi and the Cheng brothers. In 1176, for example, Liu Gong 劉珙 (1122–1178), Prefect of Jiankang 建康 (modern Nanjing), erected a shrine to Cheng Hao in the government school. Upon its completion, Liu sent Zhu Xi a letter requesting an inscription from him. Liu and Zhu both hailed from Jianning 建寧, but making no mention of their shared native place, Liu's letter explained why he considered Zhu Xi the most suitable author for the inscription in terms of Zhu's intellectual accomplishments:
When I was a young man, I studied the books written by Mr. Cheng. I realized that his way of learning and his virtuous conduct carried on the traditions of Confucius and Mencius that had no longer been transmitted. Although I have failed to attain his height in learning, my mind has turned toward it. Since you have chanted his poems and studied his works, I wish you would write an essay to record [the erection of the shrine].
吾少讀程氏書,則已知先生之道學德行實繼孔孟不傳之統。顧學之雖不能至,而心鄉往之。以吾子之嘗誦其詩而讀其書也,故願請文以記之.Footnote 49
In Song times, authors of school inscriptions were no longer content with providing an account of how a government school or any of its associated facilities was rebuilt, expanded, or repaired. Many of them availed themselves of the opportunity to make an argument about education and learning. The scope of their influence varied, however. Some had opportunities to write only for schools close to home, but others composed inscriptions in different regions across the Song territory. From the Northern to Southern Song, as more and more school inscriptions were written, men who had an opportunity to write for schools in different regions also increased. This allowed them to spread their views more widely and thereby facilitated the exchange of ideas between different macroregions. However, the intensity of this exchange varied in different parts of the Song. It was more intense in the eastern half of the Song (i.e., between regions such as the Lower Yangzi, Middle Yangzi, Southeast Coast, and even Lingnan) but very limited between these regions and the Upper Yangzi. Nevertheless, in the network of these exchanges, there appeared a group of authors with wide influence. They were bridges of ideas between different regions. They spread their views widely and fostered a shared understanding of learning and the functions of government schools. At first, these influential writers were predominantly renowned prose writers, but from the mid-twelfth century on, many of them were Neo-Confucian moral philosophers. The growing importance of Neo-Confucian scholars in the writing of government school inscriptions owed much to a Southern Song phenomenon: that is, men who renovated and expanded local government schools became increasingly interested in seeking inscriptions from their own teachers, fellow students, and scholars who had intellectual ties to the Neo-Confucian luminaries enshrined on the campus of the schools.
Themes
Since many Song authors used school inscriptions to broadcast their views of learning, we may reasonably expect that the views in school inscriptions must have changed over the course of the Song when the intellectual background of their authors changed. This section explores this phenomenon with the aid of computer-assisted text analysis.
At the core of this section's analysis is the method of document clustering based on tf–idf calculations.Footnote 50 The idea of tf–idf, short for “term frequency–inverse document frequency,” is to group similar documents together based on the pattern of their language use. Documents are considered similar if they use the same words more frequently than other documents in the corpus. This means that the importance of any word to a document is positively influenced by how frequently this word appears in this particular document and, in the meanwhile, negatively influenced by how frequently this word appears in the corpus in general. The first factor is measured by the number of times the word appears in the document (i.e., the “term frequency” or tf value), and this is adjusted by the value of “inverse document frequency” (i.e., the idf value) which measures the second influencing factor based on the number of documents in the corpus that contain this word. Using the tf–idf values, it is then possible to transform each document into a set of numbers (a vector), where each number is a quantitative expression of how important a word is to the document. This process, technically known as document vectorization, creates a vector space that has as many dimensions as the number of unique words in the corpus, and the similarity between documents is computed as the “distance” between the vectors that each represent a document.
What constitutes a word, however, is not straightforward in Chinese-language documents. While white spaces in English and many other languages provide an intuitive way of dividing a string of written scripts into its component words, Chinese-language documents do not offer this convenience. As word segmentation algorithms for Chinese texts—especially classical Chinese texts—are still being developed,Footnote 51 a few recent studies have elected to take each character as a unit of analysis (i.e., a dimension in the vector).Footnote 52 This approach does not serve the purpose of the present study because of the multivalence of Chinese characters.
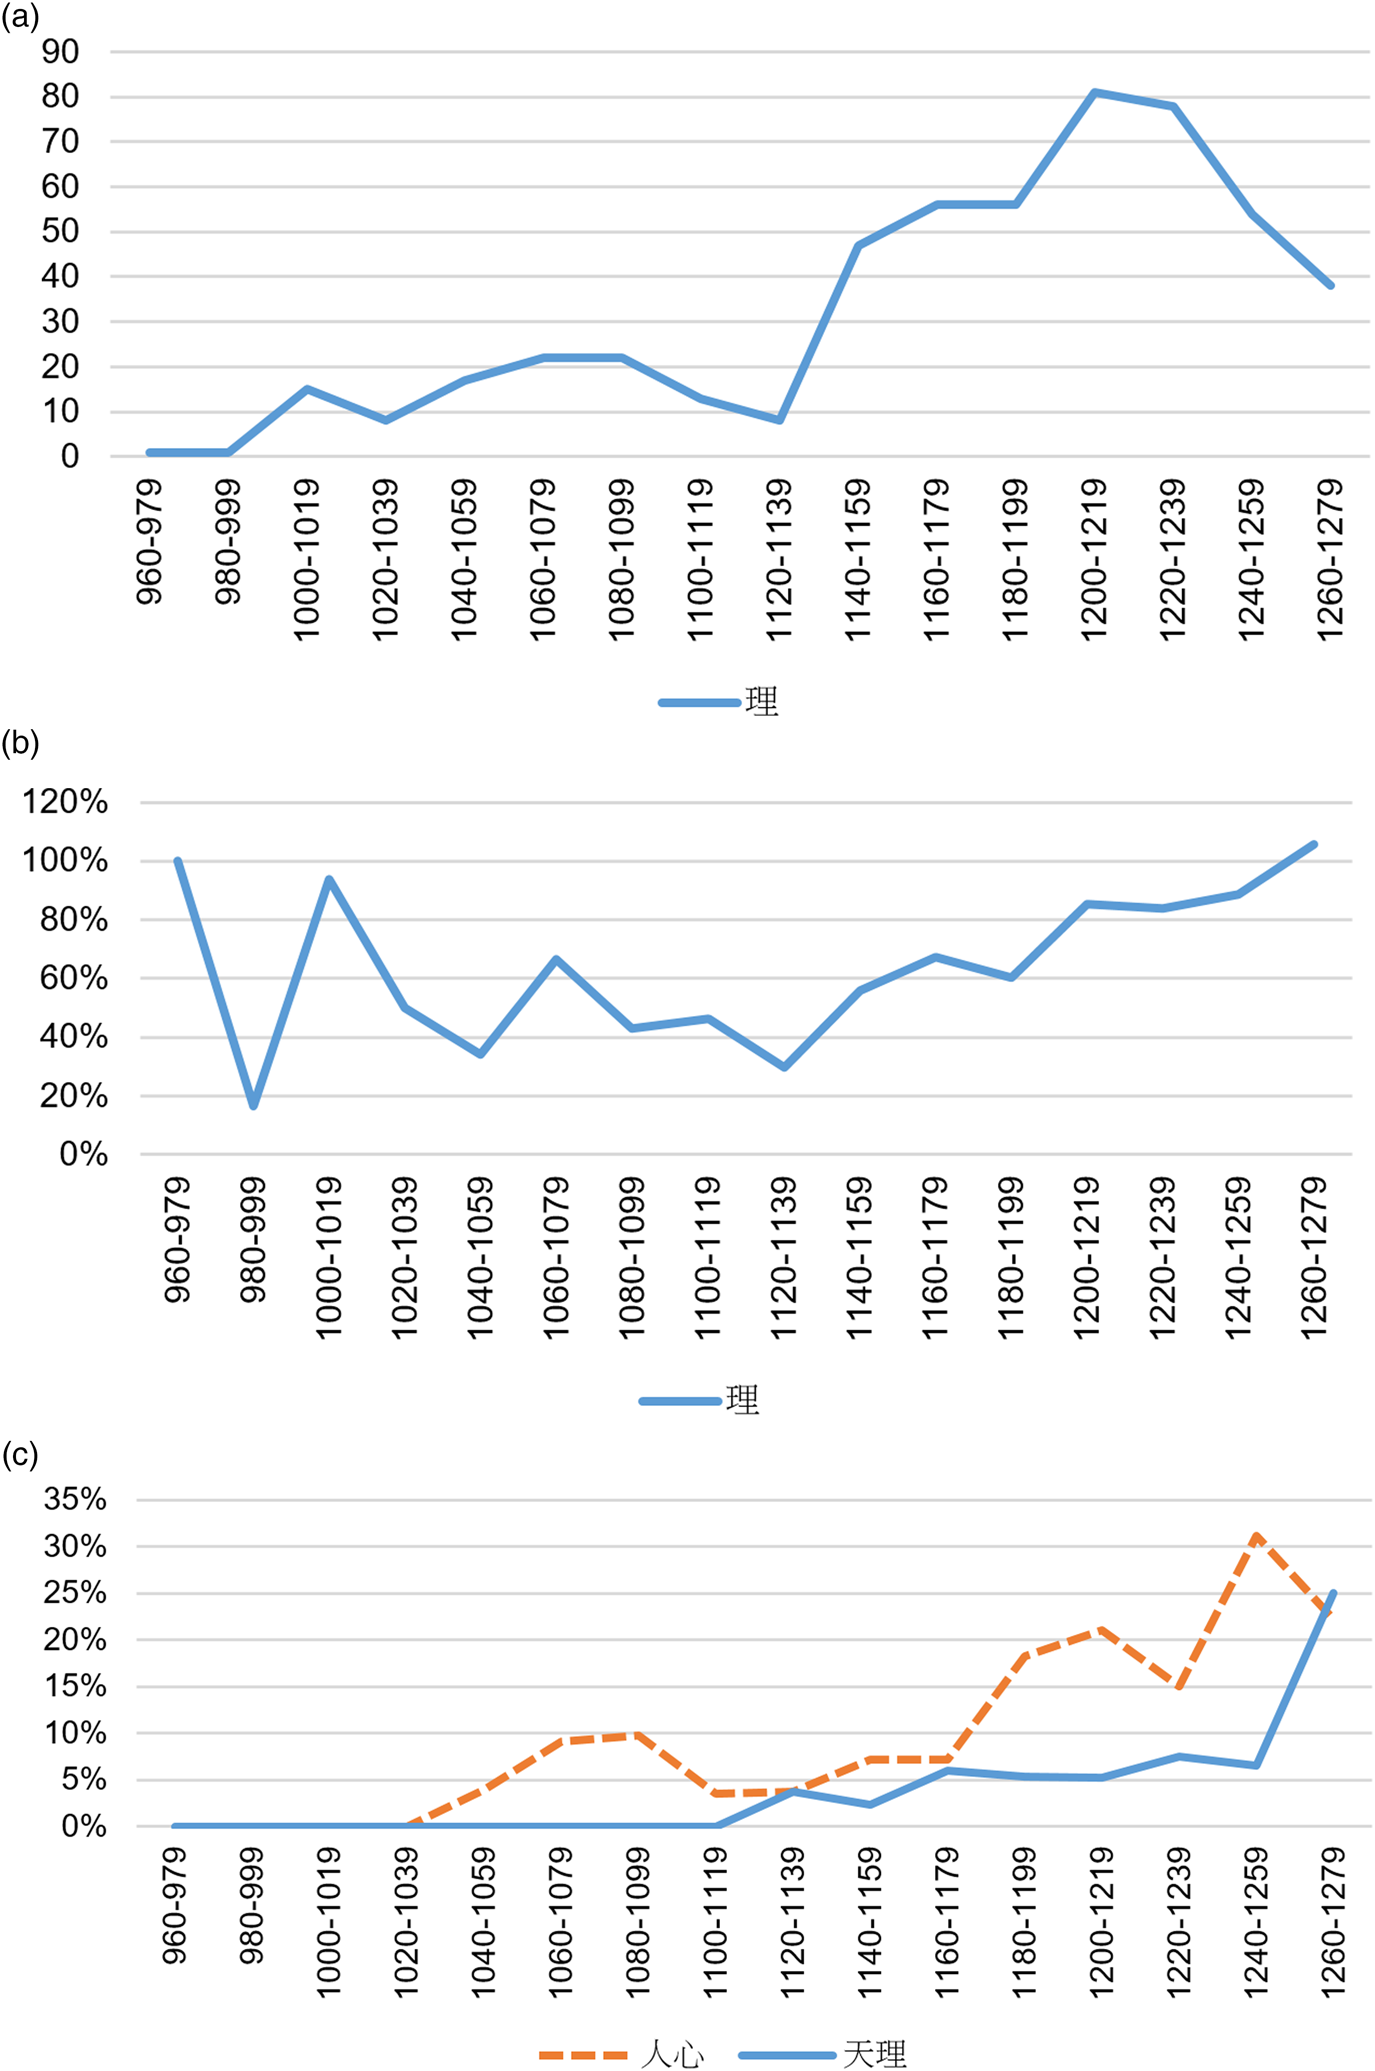
Take the character li 理 for example. Figure 7a plots the number of times this character appears in the school inscriptions. Since li is a key concept in Neo-Confucianism, the upward trend in this graph appears to be consistent with the growing prominence of Neo-Confucian authors in the writing of school inscriptions. But this is misleading. In fact, this upward trend was only a result of the growing number of school inscriptions written in the Song period. Once the frequency of li is normalized by the number of extant inscriptions in each period, the upward trend disappears (Figure 7b). The Neo-Confucian influence on the content of inscriptions becomes evident only if one graphs the frequency of two-character terms, such as tianli 天理 (heavenly principle) and renxin 人心 (human mind) (Figure 7c). That is, the meaning of two-character terms is much less ambiguous than that of one-character terms in classical Chinese. In some of the school inscriptions, the character li indeed stands for the Neo-Confucian notion of “principle” or “coherence,” but in many others, it is also used as part of a verb (e.g., jingli 經理 (to manage)), or the name of a government agency (e.g., dali 大理 (Court of Judicial Review)), etc. Only when li is understood in relation to the character immediately preceding or following it does the ambiguity of its meaning disappear. Two-character terms, such as qiongli 窮理, tianli 天理, jingli, and dali, are far less multivalent.Footnote 53
(a) Occurrences of li in the Corpus. (b) Occurrences of li, Normalized by Number of Inscriptions in Each Period. (c) Occurrences of tianli and renxin, Normalized by Number of Inscriptions in Each Period.
Therefore, this study adopts two-character terms as its unit of analysis. First, I use a computational algorithm to identify any two contiguous characters in the texts and thereby generate a list of all possible two-character combinations (137,274 in total) from the corpus. This list is trimmed down by several filtering operations. Two kinds of filters are applied. First filtered are two-character combinations that contain the most common words (the so-called “stopwords”), which are mostly grammatical particles but also include some verbs and prepositions.Footnote 54 Then, the second set of filters is applied to ensure that documents will not be grouped together because they all contain similar references to dates and administrative levels or because they all provide rich accounting details of a construction project.Footnote 55
Certainly, not all of the remaining two-character combinations (95,977 in total) are meaningful. We may safely assume that the more often a two-character combination appears in the corpus, the more likely it is meaningful.Footnote 56 To maximize the percentage of meaningful combinations on the list, I filter out all the combinations that appear less than seven times in the corpus, and I have chosen seven as the threshold value based on the corpus-wide frequency distribution of all the 95,977 two-character combinations (Figure 8). This leaves us with a total of 4,070 two-character terms. Then, each school inscription is transformed into a vector composed by the tf–idf value of each of the 4,070 terms for the inscription. Finally, these school inscriptions are divided into three clusters using the K-Means clustering algorithm.Footnote 57
Corpus-Wide Frequency Distribution of All Two-Character Combinations

The distribution of school inscriptions in the three clusters reveals a clear temporal pattern (Figure 9). Cluster A represents the earliest and dominant mode of writing school inscriptions in Song times. The small number (twenty-three) of inscriptions in the first six decades of the Song fall exclusively in this cluster. The dominance of this cluster was challenged first in the 1030s by the appearance of Cluster B inscriptions and again in the 1120s by that of Cluster C inscriptions.
Percentage of Inscriptions in Each Cluster by Period

Cluster A was the mainstream. At all times, at least half (and sometimes 60 percent to 80 percent) of the inscriptions belong to this cluster. Cluster B inscriptions first appeared in the 1030s, claiming five of the fourteen inscriptions of that decade.Footnote 58 The share of inscriptions in Cluster B continued to rise in the years that followed, reaching a peak first in 1060–1079 and again in 1100–1119. In these two periods, nearly half of the inscriptions fall into Cluster B. Thereafter, the share of Cluster B inscriptions declined steadily, although it never completely disappeared. Finally, in the 1120s, the third type of inscriptions (Cluster C) surfaced. At first, it claimed only 4 percent to 7 percent of the inscriptions written between 1120 and 1159. However, by 1160–1179 its share had risen above 10 percent, and it stayed at this level all the way until 1239.
A close look at the timing of when inscriptions in different clusters first appeared in each macroregion provides evidence for the findings in the preceding section. It reveals the great impacts that the weak connections between the Upper Yangzi and other macroregions had on the diffusion of ideas between the eastern and western halves of the Song empire. The first inscription in Cluster B was composed by Zu Wuze in 1035 for a school in North China.Footnote 59 In 1040–1059, inscriptions in the Cluster B style spread to other regions such as Northwest China, the Lower and Middle Yangzi, and Lingnan. By contrast, no Cluster B inscriptions appeared in the Upper Yangzi until two Sichuan men, in the early 1070s, wrote for the Confucian shrine in Yongtai 永泰 county (Zizhou 梓州) and the prefectural school of Chengdu respectively.Footnote 60 Similarly, the first inscriptions in Cluster C were written for schools in the Lower Yangzi in 1126 and 1135.Footnote 61 In the next few decades (1140–1199), twelve more inscriptions in the Cluster C style appeared for schools in the Middle Yangzi, the Southeast Coast, and Lingnan. However, in the Upper Yangzi, no inscription in this style is known until 1207 when the Sichuan-born Neo-Confucian scholar, Wei Liaoweng, wrote for a Neo-Confucian shrine inside the Chengdu prefectural school.Footnote 62
What exactly distinguishes these clusters from one another? Do they share any common ground? A comparison of the top-frequency terms in each cluster provides some clues. Table 8 reports the top ten most frequent terms in each cluster.
Top Ten Most Frequent Terms in Each Cluster
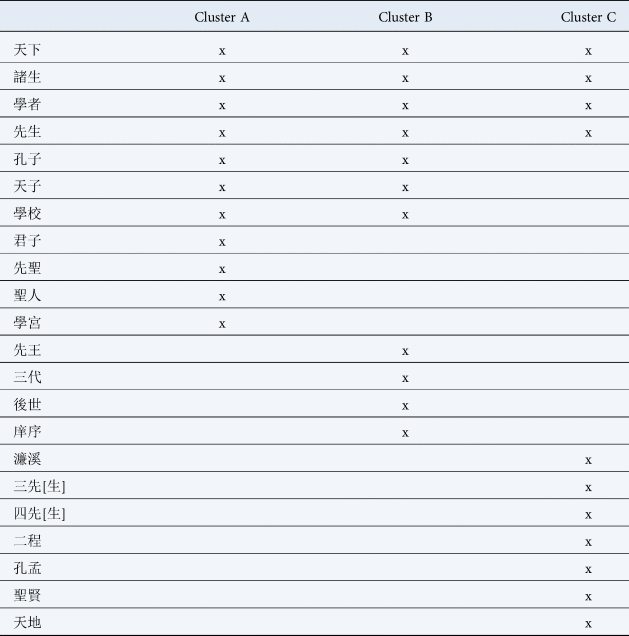
There are obviously some overlaps between the top-frequency terms in different clusters. Four terms frequently appear in all three clusters. Three of these terms (zhusheng 諸生 (students), xuezhe 學者 (scholars), and xiansheng 先生 (masters)) indicate the shared concern for education in all clusters, and the other (tianxia 天下 (all under heaven)) reveals a shared imagination of the cultural world. Moreover, Clusters A and B also share an interest in discussing local schools in relation to the classical tradition and the state, which is evident in their frequent references to Kongzi 孔子 (Confucius) and tianzi 天子 (the Son of Heaven). In contrast, these two terms appear much less often in Cluster C inscriptions.Footnote 63
Let us now turn to the cluster-specific top-frequency terms—that is, terms that appear only on the top ten list of one cluster but not the other two. These terms foreground the distinctive themes of each cluster. The contrast between Clusters B and C is particularly pronounced. The unique terms in Cluster B suggest strongly that these inscriptions focus on the relationship between antiquity (sandai 三代 (Three Dynasties) and xianwang 先王 (sage kings)) and men of later generations (houshi 後世), a theme that was at the center of intellectual and political discourses of the mid- and late eleventh century. Cluster C inscriptions, on the other hand, exhibit a strong Neo-Confucian orientation. The frequently-used terms in these inscriptions betray the authors’ attempt to elevate the status of Confucius and Mencius as a pair (Kong Meng 孔孟), their reverence for the Neo-Confucian masters (Zhou Dunyi (Lianxi 濂溪), the Cheng brothers (Er Cheng 二程), and the Three or Four Masters (san xiansheng 三先生 / si xiansheng 四先生)), as well as their preoccupation with the proper relationship between the sages (shengxian 聖賢) and the cosmic order (tiandi 天地). These characteristics of Clusters B and C set them apart from Cluster A, which focuses more on Confucius himself (xiansheng 先聖).
The differences between the three clusters are also manifest in the expanded lists of top-frequency terms for each cluster. Table 9 lists the top thirty frequent terms in each cluster.
Top Thirty Most Frequent Terms in Each Cluster
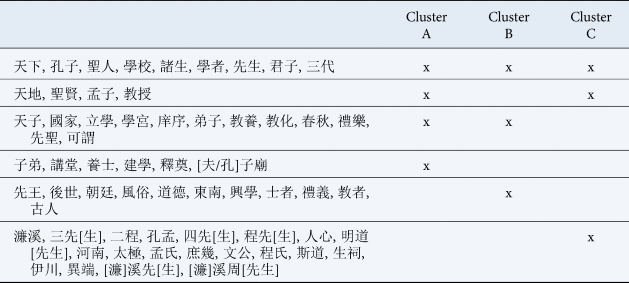
These lists betray a shared statist orientation between Cluster A and B. Both stress the relationship between schools and the imperial authority, which is evident in their frequent references to “dynasty” (guojia 國家) and “court” (chaoting 朝廷). In the inscriptions of both clusters, the local government school was a state institution whose goal was to transform local literati and local society. They speak of schools as the place for teaching and nourishing the literati (jiaoyang 教養 and yangshi 養士) and stress the importance of transforming local culture (jiaohua 教化) through the practice of Confucian rites (liyue 禮樂).
Nevertheless, there are also marked differences between Clusters A and B. Inscriptions in Cluster A have a stronger ritual focus. They make more frequent mentions of the spring and autumn sacrifices (chunqiu 春秋 and shidian 釋奠) performed at the Confucian shrine (zimiao [夫/孔]子廟). In contrast, Cluster B inscriptions often employ the signature phrases of the late eleventh-century reformers, such as “morality” (daode 道德) and “customs” (fengsu 風俗). Thus it comes as no surprise that the number of inscriptions in Cluster B reached a peak in 1060–1119, in which the reformers and their critics took turns to dominate court politics. Three of the four extant inscriptions written by Wang Anshi fall into this cluster, as does the only extant inscription by Wang's follower Lü Huiqing 呂惠卿 (1032–1111).
The features of Cluster C are much more conspicuous, and these features set it far apart from the other two clusters. The top thirty most frequent terms of Cluster C are literally a dictionary of Neo-Confucian locutions, with very limited overlap with the top thirty frequent terms in the other two clusters. These terms include Mencius (Mengzi 孟子 / Mengshi 孟氏), names of Neo-Confucian masters (e.g., Mingdao 明道 (Cheng Hao), Yichuan 伊川 (Cheng Yi), Yiluo 伊洛 (i.e., the Cheng brothers), Cheng shi 程氏 (the Chengs), xi xian [濂]溪先[生], and xi zhou [濂]溪周[先生] (i.e., Zhou Dunyi)),Footnote 64 Neo-Confucian philosophical concepts (renxin 人心, tianli 天理, and taiji 太極), and phrases that express the self-identity of the Neo-Confucian fellowship (sidao 斯道 and Daoxue 道學) and their hostility towards Buddhism and Daoism (yiduan 異端).
In view of this, it should not surprise us to find that men who contributed two or more inscriptions in Cluster C were all Neo-Confucian philosophers, who composed twenty of the fifty-five inscriptions in Cluster C altogether. These authors, six in total, spanned a wide intellectual spectrum within the Neo-Confucian movement. They included Zhu Xi and Zhang Shi, the leading figures who commanded the intellectual centers in Fujian and Hunan respectively. Of the remaining four, three had close links to the Zhu Xi school: Huang Gan and Chen Mi 陳宓 (1171–1230) were Zhu's disciples, and Wei Liaoweng was Zhu's firm supporter. The fourth, Yuan Fu, by contrast, studied with Yang Jian, who in turn received his teachings from Lu Jiuyuan who was based in Jiangxi but had immense influence in Zhejiang. Among those who had only one school inscription in Cluster C, one also finds a wide diversity of Neo-Confucian scholars, including Zhu Xi's well-known disciples Liao Deming 廖德明 (jinshi of 1169) and Chen Chun 陳淳 (1159–1223) as well as Lu Jiuyuan's followers (e.g., Yang Jian and Bao Hui).
Two caveats are in order about these findings. First, document clustering in this analysis reveals shared themes, not positions. The position a document takes on a specific theme relies greatly on interpretation. We know, for example, that Cluster C inscriptions share a common interest in Neo-Confucian philosophy (e.g., the heavenly principle and the human mind) and masters (e.g., Zhou Dunyi and the Cheng brothers). Yet the list of top-frequency terms does not reveal what position these inscriptions take on the relationship between the heavenly principle and the human mind, nor does it indicate whether these inscriptions agree or disagree with the Neo-Confucian masters. It is particularly important to bear this in mind when we interpret Cluster B inscriptions. As I have noted in the “Trends” section, few school inscriptions in this corpus were from the hands of the late eleventh-century reformers.Footnote 65 As a result, many of the inscriptions in Cluster C composed in 1060–1119 were, in fact, from the hands of men whose political views were either ambiguous or at odds with the reformers. Of them, Huang Chang and Chao Buzhi—who have been identified as the most influential eleventh-century authors in the preceding network analysis—were prime examples. Of Huang's six extant inscriptions, five fall into Cluster B, and of Chao's six inscriptions, two are in Cluster B. Neither, however, was closely associated with the reformers. Placing first in the jinshi examination of 1082, Huang went on to hold a series of positions at court but was not involved in the debate over Wang Anshi's New Policies, while Chao was blacklisted as a member of the anti-reform Yuanyou faction. The presence of their writings in Cluster B suggests that major themes in this cluster—e.g., the antiquity, the former kings, and the transformation of morality and customs—were not owned by the reformers such as Wang Anshi and Lü Huiqing. Rather, these concerns were shared by a much broader segment of literati officials across the political divide.
Second, few authors were exclusive in their choice of themes when writing school inscriptions, and sometimes they deliberately smuggled in new ideas and wrapped them carefully in existing discourses. Therefore, of the thirty-six authors who had three or more pieces in the extant inscriptions, only six had all their pieces in the same cluster.Footnote 66 The five most prolific authors in the corpus—i.e., men who wrote more than ten extant inscriptions—all had some inscriptions in each of the three clusters. Three of these authors were leading Neo-Confucian philosophers,Footnote 67 but they nevertheless had inscriptions that focused more on the themes associated with Clusters A and B. Zhu Xi, for example, had thirteen inscriptions in Cluster A, ten in Cluster B, and eight in Cluster C. Zhang Shi had four in Cluster A and six in each of the other two clusters. Compare Zhu Xi's 1179 inscription for Zhou Dunyi's shrine in the Longxing 隆興 prefectural school and his 1182 inscription for the Qiongzhou 瓊州 prefectural school, which the computer has assigned to Clusters C and B respectively.Footnote 68 His 1179 inscription, written at the request of his devoted follower Huang Hao 黃灝, an instructor of the Longxing prefectural school, was essentially a Neo-Confucian philosophical treatise. Ostensibly, the inscription was presented as a tribute to Zhou's scholarly contributions, but Zhu Xi also seized this opportunity to discuss explicitly and at great length his ideas of the sages’ way. First, he offered a reinterpretation of Zhou's highly controversial work Explanation of the Diagram of the Supreme Ultimate (Taiji tushuo 太極圖說) by sneaking in his own concept of the “principle” (li 理). Then, he promoted the idea of the transmission of the Way (daotong 道統) from the sage kings, to Confucius and Mencius, and to Zhou and the Cheng brothers. The style of his 1182 inscription was very different. In this piece, Zhu's promotion of the Neo-Confucian pedagogical objective is wrapped into a broad discussion of the sage kings in antiquity (xianwang 先王 or shengwang 聖王) and their effort to transform local customs through education (jiaohua 教化). Zhu's argumentative framework focuses on the difference between the sage kings in antiquity and men of later generations. He argues that the sage kings’ purpose in establishing schools was to teach proper behavior in social interactions and that they were successful. In developing this argument, Zhu again sneaks in his concept of the “principle.” He maintains that each of the five cardinal social relationships that are the foundation of human society has its own “principle” and that the sage kings’ educational program helped local men apprehend and preserve these principles that were already inherent in themselves. Classical study and ritual performances are not an end in themselves but only the means for cultivating a moral person. Thus, Zhu Xi adroitly redefines the purported pedagogical goal of the Qiongzhou prefectural school. Whereas Han Bi 韓璧, the prefect who approached Zhu for an inscription, renovated the school to help local literati compete with those of other regions in memorizing texts and composing poetry and essays, Zhu argued that these were trivial. Instead, he urged the Qiongzhou scholars to direct their effort to what was inherent in themselves, fathom all the principles under heaven, and cultivate their virtue and conduct. This effort of personal cultivation, said Zhu, was the root of examination success and worldly accomplishments.
Scholars have long taken note of the close relationship between the Neo-Confucian movement and the spread of academies in the Southern Song. Northern Song scholar-officials concentrated their effort on building and reforming state institutions (e.g., government schools and civil service examinations) for preparing and recruiting talented men into government service. By contrast, the Southern Song scholar-officials, especially the Neo-Confucians, turned their attention away from the reform of state institutions and focused instead on the content of the educational program itself: the pedagogical objectives and methods, the textbooks, and the daily schedule of study. Therefore, they put their effort into building academies. These academies borrowed the institutional model of local government schools but promoted the educational programs in accordance with the ideals of the Southern Song—especially Neo-Confucian—scholars.Footnote 69
My analysis in the above sections suggests that their enthusiasm for building academies did not lead the Neo-Confucians to ignore the local government schools. They readily accepted these schools as state institutions that had value, but they made constant effort to introduce their own vision of learning into these schools. The two inscriptions from Zhu Xi discussed here provide a good illustration of the different ways in which the Neo-Confucians sought to transform local government schools to fit their vision. At times, Neo-Confucian adherents transformed the ritual space of local government schools by erecting new shrines on campus in honor of Neo-Confucian masters and wrote inscriptions that promoted these masters as transmitters of true learning.Footnote 70 At other times, when they did not have the opportunity to transform the physical and functional spaces of local government schools, they advanced their agenda in the inscriptions. Accepting the state's sponsorship of local schools and its purported intention of emulating the ancient kings to transform local culture, they sought to redefine the pedagogical objective of state-sponsored educational activity.
To summarize, the development and mixture of different clusters of inscriptions reflect how the physical space of a local Confucian shrine-school complex (miaoxue 廟學) was transformed over the course of the Song dynasty. From the eleventh century through the thirteenth, a succession of political and intellectual leaders—first the mid- and late eleventh-century state activists and then the Neo-Confucians—tried to redefine the functional and architectural features of the local Confucian shrine-school complex through a process of superimposition. That is, they had the local Confucian shrine-school complex take on new functions without forcing it to give up its old ones, and usually, they achieved this goal by adding new buildings to the existing architectural complex or repurposing some of its existing structures. The local Confucian shrine-school complex, therefore, was gradually expanded, its functions became increasingly diverse, and the inscriptions associated with this architectural complex became more and more multifaceted.
In the first decades of the Song, state educational facilities were in ruins in many places, with only the Confucian shrines left standing where seasonal sacrifices were offered to Confucius and his disciples. Inscriptions dedicated to this space were correspondingly uniform: they all fall under Cluster A and are devoted to a general discussion of Confucian sacrifices and education. In the second phase, from the mid-eleventh century to the mid-twelfth, reform-minded officials called upon the court to take on more responsibilities for nourishing literati and transforming local culture. They urged the court to emulate the sage-kings of antiquity and build government schools in prefectures and counties. In this climate, local officials constructed new educational facilities (such as lecture halls and dining and lodging spaces), often on the premises of existing Confucian shrines. The site where the Confucian shrine had been standing was thereby transformed into a government school complex. The Confucian shrine was not abandoned, however, but became an integral part of the newly expanded complex. Speaking of its functions, what had been a primarily ritual space now took on both ritual and educational responsibilities. Accordingly, in this second phase, inscriptions associated with this Confucian shrine-school complex bifurcated into two clusters: a cluster that continued to emphasize the ritual functions of the space (Cluster A) and a cluster that focused primarily on idealized antiquity, the sage-kings, and the role of the state in transforming morality and customs in local society (Cluster B).
Come the mid-twelfth century, the growing influence of the Neo-Confucians ushered in the third phase of change. The shrine-school complex acquired new architectural features, as some buildings were added and some existing structures remodeled in honor of Neo-Confucian masters. The complex's educational function remained crucial, but it co-existed with its newly expanded ritual functions, which included both the age-old ritual facilities centered on Confucius and his disciples, but also the more recent ones in honor of Neo-Confucian figures. Thus, owing to repeated superimposition of new educational and ritual structures and functions, from the early eleventh century onward, the school complex was gradually transformed into a multi-functional space, vastly different from the original Confucian shrine whence it had evolved. Accordingly, in the twelfth and thirteenth centuries, inscriptions for this architectural complex became as much a mixture as the complex itself. New constructions and remodeling projects in honor of Neo-Confucian masters provided the occasion for writing inscriptions that advocated Neo-Confucian ideals, while some other inscriptions continued to be produced—some by Neo-Confucian writers themselves—that focused mainly on the shrine-school complex's relation to the state, to the sage-kings of antiquity, and to sacrifices to Confucius. This association between different themes and different types of buildings on the school premises is evident in Table 10. The table shows that almost all inscriptions dedicated to Confucian shrines fall into Cluster A, whereas a predominant number of Cluster C inscriptions were written for shrines honoring Neo-Confucian figures.
Distribution of Inscriptions in Each Cluster by Type of School Facilities

Conclusion
A hallmark of the Song achievements was the creation, for the first time in Chinese history, of a national network of state schools in nearly all prefectures and counties. Not only was state-sponsored education a critical component of court policy in the latter half of the Northern Song, but local officials and scholars continued to play active roles in restoring and expanding government schools and funding their operations throughout the Southern Song. This high level of activity in local government schools engendered an exponential growth of commemorative inscriptions dedicated to local government schools. These inscriptions did not only provide an account of the various activities in local schools. Many of their authors took the occasion to expound and disseminate their visions of schools and their views of learning and education. By studying these inscriptions from multiple perspectives and with the aid of digital analytic methods, this article has sought to identify the dominant authors of school inscriptions, delineate the scope of their influence, trace the changes in their social and intellectual background, and reveal the shifts in their thematic focus.
The mixture of themes in school inscriptions reflects the history of local government schools during the Song dynasty as an evolving institution that was constantly shaped by intersecting political and intellectual forces. On sites where only Confucian shrines stood, teaching and living facilities were constructed in the eleventh century through the efforts of local officials and scholars and in response to calls from the court, transforming these sites into an architectural complex with both ritual and educational functions. This complex continued to expand in the twelfth and thirteenth centuries with the addition of shrines dedicated to Neo-Confucian masters.
Using a method of document clustering, this study has demonstrated that the themes of school inscriptions became increasingly diverse over the course of the Song dynasty, reflecting how the physical space of local government schools was transformed to accommodate their growing functional complexity. Whereas the earliest inscriptions focus on the Confucian shrines on the school premises and their ritual significance as the site for sacrificing to Confucius, some inscriptions from the mid-eleventh century on started to describe local government schools as the meeting point between state authority and local society and between the present times and the idealized antiquity. These inscriptions saw the local government schools as an embodiment of the ideal that the state should emulate the sage-kings of the Three Dynasties and, through education, transform local customs. Finally, from the mid-twelfth century on, the Neo-Confucian influence surfaced in many school inscriptions, especially those dedicated to shrines that were erected on the school campus in honor of Neo-Confucian masters. These inscriptions became vehicles for Neo-Confucian philosophical and educational visions.
The shifting themes in the inscriptions paralleled the changes in the political and intellectual backgrounds of their authors. Whereas the standard narrative emphasizes their role in academies and their criticism of examination-oriented education, this article shows the Southern Song Neo-Confucians also went to great lengths to transform the architectural and functional space of local government schools and expand their mission beyond examination preparation. Relying on the betweenness metric and clustering algorithms, this article has analyzed the structural properties of the network that undergirded the diffusion of ideas between different parts of the Song territory. The study of the authors’ geographic scope of influence reveals a structural schism between the Upper Yangzi and other regions of the Song dynasty. While the interaction between the Lower and Middle Yangzi, the Southeast Coast, and Lingnan grew ever more intense over the course of the Song, the connection between the eastern regions and the Upper Yangzi remained weak throughout these centuries. Whether intense or weak, the interregional exchange of ideas was mediated by a small number of authors who had the opportunity to write for schools in different physiographic macroregions and who, for that reason, were more capable of projecting their influence over a wide geographic area. This enabled them to play a critical role as a bridge between different regions and integrate men of more confined spheres of influence into a national network. In the Northern Song, this role was played mainly by renowned prose writers. By the Southern Song, however, much of it was taken over by leading Neo-Confucian philosophers and their supporters.