1. Introduction
For better or for worse, the unipolar moment in foreign economic policy is over. It may be unclear precisely when Washington DC's writ on the global economy ceased to trump all, but contemporary analysis by social scientists of all stripes now analyse episodes of a multipolar world and their consequences. The Sino-US trade war is perhaps the most salient manifestation of a world where the liberal international economic order and its associated trade rules have given way to a complex, multi-faceted rivalry between a number of established and nascent powers. In light of such rivalry, not surprisingly some analysts have sought to recast and update the notion of economic statecraft (Baldwin, Reference Baldwin1985; Aggarwal and Reddie, Reference Aggarwal and Reddie2020, Reference Aggarwal and Reddiethis issue) and to draw out the implications for extant international economic organizations (Narlikar and Tussie, Reference Narlikar and Tussie2004; Weiss, Reference Weiss2005; Hopewell, Reference Hopewell2016; Singh, Reference Singh2016).
Although policy intervention by sub-national governments was not always overlooked, the focus recently on analyses of geopolitical rivalry, techno-nationalism, and economic statecraft has been on the actions of central governments. Given the greater media coverage of the latter, plus the availability of more data about the steps taken by national governments, affiliated regulatory agencies, and state-owned or state-linked firms, perhaps this focus was inevitable. But are important sub-national public sector decisions being overlooked?
The actions of Chinese sub-national governments have come under the spotlight, especially as they relate to the implementation of industrial policy, which is said to this day to involve significant subsidization (Blustein, Reference Blustein2019). Researchers have highlighted the sectoral impact of selective Chinese sub-national policy intervention (see, for example, Haley, Reference Haley2012; Oh, Reference Ohthis issue) and the influence of Special Economic Zones on the pace of local economic development and spillovers to neighbouring jurisdictions (Alder et al., Reference Alder, Shao and Zilibotti2016). Journalist accounts frequently point to the apparently critical role that Chinese sub-national governments play in executing Chinese industrial policy, sometimes at arms-length from the national authorities in Beijing, and to the vibrant competition between provincial and city governments (Davis and Wei, Reference Davis and Wei2020 being a latest example).
While the cross-border spillovers purportedly created by Chinese city and provincial governments have been much discussed, the potential impact on Chinese commercial interests policy intervention by US state, city, and town governments is barely remarked upon or studied.Footnote 1 This is curious given that a new dataset on business incentives offered by US state and local governments has been made available (Bartik, Reference Bartik2017) which, in turn, has been a contributing factor in stimulating a wave of research on the domestic impact of such policy intervention (Suarez Serrato and Zidar, Reference Suarez Serrato and Zidar2016; Ossa, Reference Ossa2018; Slattery, Reference Slattery2018; Chava et al., Reference Chava, Chava and Singh2019; Fajgelbaum et al., Reference Fajgelbaum, Morales, Suarez Serrato and Zidar2019; Slattery, Reference Slattery2020; Slattery and Zidar, Reference Slattery and Zidar2020).Footnote 2
My focus here on the potential adverse cross-border spillovers created by US sub-national governments should be put in its appropriate global context. Competition between sub-national governments and its consequences have long been studied in countries such as Switzerland and Germany. Tax competition between sub-national governments has been extensively documented, analysed, and debated in international organizations, including the Organization for Economic Co-operation and Development (see OECD, 2011 for an extensive report on such matters). Likewise, the study of fiscal incentives provided to attract foreign direct investment (Oman, Reference Oman2000).
The subsidies paid by sub-national governments have become part of inter-governmental disputes taken up at the World Trade Organization, including European accusations that the State of Washington in the United States provided Boeing with substantial amounts of state aid (WTO dispute settlement case 353). A WTO dispute concerning US sub-national support for renewable energy firms was filed in 2018 (WTO dispute settlement case 563). Chinese sub-national governments have been accused of supporting aluminum producers (WTO dispute settlement case 519) and claims have been made in 2019 that Indian sub-national authorities provided state aid to sugar and sugar-cane producers (WTO dispute settlement case 581). These examples indicate that trade policymakers have recognized the potential for sub-national governments to distort trade flows and production.Footnote 3
More generally, in recent years there has been an active debate as to whether multilateral trade rules can accommodate successful forms of state capitalism (Lang, Reference Lang2019). China's state-influenced development trajectory is at the centre of such discussions and reference is often made to the contribution of sub-national governments and the apparent lack of transparency of their policy interventions, including the award of subsidies (Bown and Hillman, Reference Bown and Hillman2019). Alongside this debate has been growing interest in the pervasiveness of subsidies, their effects on world trade flows, and the case for reforming related subsidy rules (see Hoekman and Nelson, Reference Hoekman and Nelson2020 for a recent assessment of the debate).
In light of these considerations, an analysis of the prevalence, form, and commercial scale of US sub-national policy intervention from 2009 to 2019 and the potential implications for Chinese commercial interests might add to our understanding of US–Chinese geostrategic rivalry, enrich our understanding of the notion of economic statecraft by considering the sub-national dimension, as well as informing the debate over subsidy reform at the World Trade Organization.
The remainder of this paper is organized as follows. The next section examines in principle the ways in which sub-national governments may engage in economic statecraft, bearing in mind that other considerations may influence their decision-making. This sets up the discussion of what steps US sub-national governments have taken over the past decade that induced cross-border spillovers for Chinese and other foreign commercial interests.
The third section of this paper describes the primary data set used in this study (the Global Trade Alert) and its relevance to the matter at hand. The fourth section lays out the empirical record of US sub-national government policy intervention taken during 2009–2019, exploring variation across sectors, time, levels of government, and type of policy instrument. Particular attention is given to whether a change in sub-national government behaviour was observed once the US Federal Government decided to start a trade war with China in the years since President Trump took office. That empirical record is interpreted in light of the literature on economic statecraft. Conclusions are drawn in the fifth section of this paper.
2. Sub-National Governments and Economic Statecraft
In framing the potential role(s) that sub-national governments can play in economic statecraft, a good starting point is to ask what is understood by this term. Evidently, the definition has evolved over time. Aggarwal and Reddie (Reference Aggarwal and Reddiethis issue) characterize traditional economic statecraft as the economic dimension of great power rivalry, in particular as it relates to the use of economic sanctions. Those sanctions may deny commercial opportunities as well as access to cutting-edge technology. In a sense, then, technology did play a part in Cold War notions of economic statecraft.
Aggarwal and Reddie (Reference Aggarwal and Reddiethis issue) contend that to account for contemporary rivalry between the leading powers, the notion of economic statecraft needs to be extended in at least two directions. First, the relevant set of economic policies must extend beyond economic sanctions. Second, the evolution and societal importance of general purpose information technologies introduces a much broader technological element than in the Cold War. If, as some claim ‘data is the new oil’, then control over the access, processing, and other use of information as well as the associated infrastructure at home and abroad are implicated in geo-strategic rivalry. According to my reading of Aggarwal and Reddie (Reference Aggarwal and Reddiethis issue), there is no attempt to abandon the notion that governments are interested in relative as well as absolute outcomes.
This is a useful starting point but it quickly runs into a delimitation problem. What economic policies are not or could never be part of economic statecraft? Even policies that seek to improve the general business environment in an economy could be said to be supportive of innovation and productivity growth and so may have effects that are of interest to geo-strategically minded policymakers.Footnote 4
Moreover, what sectors of economic activity are not implicated by economic statecraft? If information technology and, in particular, the internet of things, pervade a society, then analysts will have to be especially careful in determining what commercial activity is in scope or out of scope. Both questions cast doubt on whether tightly defining the scope of economic statecraft is possible in the current era.
Layered on top of these considerations – which apply to analyses of economic statecraft at the national level – are constitutional considerations and the manner in which they are implemented. To the extent that different levels of government have been created by a national constitution, and in so far as those levels of government act independently of one another,Footnote 5 the specific powers and room for independent manoeuvre available to sub-national governments become important considerations in examining their potential contribution to economic statecraft.
In so far as the policies available to sub-national governments are concerned, what matters from an international trade perspective is the capacity and propensity to implement measures that confer commercial benefits upon localFootnote 6 firms at the expense of firms located in other jurisdictions. For example, the governments of US states, cities, and towns cannot legally set tariffs on goods received from other jurisdictions within the United States or from the rest of the world. However, they are allowed to offer subsidies, including tax reductions or exemptions, screen mergers and acquisitions (which, when it has a cross-border dimension, are a form of foreign direct investment), license service providers, and institute policies where state bodies purchase only from local suppliers. US sub-national governments may also tap capital markets on behalf of firms located in, or thinking of locating in, their jurisdictions. US sub-national governments can also tax the profits from the overseas operations of firms located in their jurisdiction differently from profits earned within the United States.
That certain policy instruments are not available to sub-national governments means that pressures for local favouritism are channelled into those instruments that are allowed. In the US context, then, in sectors involving the production of goods such pressures are more likely to result in subsidies being offered to firms – but demand-switching ‘buy local’ procurement policies are an alternative too. In the service sector, local licensing rules can act as market access barriers, just as they can at the national level.
The discrimination against disfavoured firms associated with most of these policy tools tend not to be as salient as a national government introducing a tariff hike on imports – and this may account for the former receiving less attention than the latter. Nevertheless, the potential for discrimination and, in particular, the potential for policy intervention that targets specific firms or specific economic activities, can alter conditions of competition in the affected markets. To the extent that foreign firms are competing, or seek to compete, in those affected markets, then cross-border spillovers may be generated that concern foreign governments.
In terms of means and ends, having discussed the means and their potential cross-border implications, I turn now to the ends. Like national governments, sub-national governments may care about their relative as well as their absolute position vis-à-vis peers. However, the set of peers of sub-national governments may differ. A sub-national government may view a neighbouring sub-national government as a rival, not an ally.Footnote 7 This may complicate attempts to build a coalition of national and sub-national governments to engage in international economic statecraft. Having written this, a central government may incentivize sub-national governments to join such a coalition and support a strategy of containing a foreign rival or to enhance national technological or economic capabilities.
To the extent that a sub-national government cares about absolute outcomes (such as levels of state value-added, employment, tax revenues, presence of growing declining industries) then their policy choices may not take into account, or intend to harm, another jurisdiction, including a foreign trading partner. As a result, the default should not be to view every sub-national policy intervention through the lens of economic statecraft.
Finally, the potential for competition between sub-national governments can have an indirect effect on national economic rivalry. Competition to attract investment and talent may result in taxation rates being set in a manner in many sub-national jurisdictions so that the national business environment becomes more attractive. The literature on fiscal federalism amply demonstrates this point in many nations (OECD, 2011). As intra-EU experience has shown, however, from the perspective of a foreign government intra-national tax competition (even that involving non-selective treatment of firms) can be seen as harmful. Competition may be over amenities as well and this may be a determining factor where talent wishes to migrate, nationally and internationally. Sub-national policy intervention does not have to be selective for trading partners to take notice or offense.
3. Data Employed
The principal source of information on policy intervention used in this study is the Global Trade Alert (GTA).Footnote 8 Since its creation in 2009, this database has become the most extensive collection of information on tariff and non-tariff measures affecting all forms of cross-border commerce worldwide,Footnote 9 a point recognized by the International Monetary Fund (IMF, 2016). Recently, Alan Wolff, the Deputy Director-General of the World Trade Organization stated ‘The site is unmatched for up to date information on trade-distorting measures’ (Wolff, Reference Wolff2020). As of this writing, over 2,100 entries in the Google Scholar database refer to the GTA. The purpose of this section is to briefly describe the contents of that database that are relevant to this study.
The unit of analysis in the GTA database is an announced policy intervention by a public body of any type. Therefore, the GTA database includes actions by sub-national governments, state-owned firms, state-influenced firms, and other state agencies, not just central governments. Each announcement is investigated to determine whether it meets seven criteria, perhaps the most relevant to this study is whether the implementation of the announcement would alter the relative treatment of domestic firms vis-à-vis their foreign rivals. If so, information on the date of the announcement, the dates of implementation and revocation (if relevant), the policy instruments implicated, the nation where the public body making the announcement is located, the level of government responsible (national, sub-national, etc), the sector of economic activity implicated,Footnote 10 and, where relevant, the products implicated.Footnote 11
An assessment of whether the announced policy intervention is harmful to foreign commercial interests or beneficial to them is found in each entry in the GTA database. Each intervention is reviewed twice before publication on the GTA website. At this time,Footnote 12 26,584 policy interventions have been documented by the GTA, more than five times the number of entries (5,146) in the WTO's Trade Monitoring database over the same time frame.Footnote 13
For those implemented policy interventions that implicate trade in goods, the GTA team employs support tables of global trade flows to identify affected trading partners.Footnote 14 UN COMTRADE data at the six-digit level of disaggregation is employed for the year before an intervention comes into force to identify the affected trading partners. Therefore, if California imposed a requirement in 2014 that all state purchases of buses must be manufactured in the United States, then the affected trading partners would be those foreign nations that exported buses to the United States in 2013. The identification of affected trading partners in this manner has been automated to reduce the potential for human error (indeed, as many processes in the GTA are automated as possible so as to limit such errors). Being able to identify when China is an affected trading partner is central to the empirical exploration conducted in the next section of this paper.
Once the affected trading partners have been identified for policy interventions affecting trade in goods, it is possible to estimate the US dollar value of the amount of international trade that is potentially implicated. Therefore, counts of policy interventions can be complemented by estimates of the share of national or sectoral imports or exports ‘covered’ by any given policy intervention or class of policy interventions.
Given the focus on sub-national policy interventions in this study, some summary statistics on the frequency of sub-national interventions in the GTA database are in order. Worldwide, since November 2008 sub-national governments were responsible for 5.2% of all policy interventions that affect commercial flows into nations.Footnote 15 For every liberalizing policy intervention by a sub-national government, there were seven and a half policy measures that favoured local firms over foreign rivals. In contrast, that ratio was only 2.2 for other levels of government. Lastly, by 2019 over 10.2% of all global trade in goods faced policy interventions implemented by sub-national governments that favoured local firms or, in the parlance of international trade experts, discriminated against foreign commercial interests.
Having described the database employed in this study, attention now turns to an empirical exploration of scale and form of policy interventions undertaken by US sub-national governments that implicated Chinese commercial interests.
4. US Sub-National Governments and Chinese Commercial Interests, 2009–2019
Many an analysis of contemporary Chinese economic development asserts the role played by that country's provincial and city governments (see, for example, Davis and Wei, Reference Davis and Wei2020). To the extent that those sub-national governments have supported the development and commercial application of cutting-edge technologies, then such governments can be said to have influenced the absolute and relative commercial advantages of their country over the United States. In the language of this special issue, economic statecraft then would not solely be the preserve of the central government in Beijing. The purpose of this section is to ask if there are any parallels in US experience over the past decade. Given the dataset employed covers the years 2009–2019 it is also of interest if the characteristics of US sub-national policy intervention that implicate Chinese commercial interests changed markedly once President Trump took office, when great power competition between the United States and China grew in salience.
4.1 Frequency Measures
The first step is to ascertain if there were any differences in resort to policy intervention harming Chinese commercial interests between US sub-national governments (taken here to be not only the state governments but also cities and township as well) and the US federal government and affiliated public agencies. Between 2009 and 2019, 1,297 policy interventions were taken by US public bodies (of all types) that potentially harmed flows of Chinese goods, services, foreign investment, and workers.Footnote 16 Of that total, 363 were implemented by US sub-national authorities or 27.9% of the national total. This is a considerably higher percentage of sub-national discrimination against foreign commercial interests than for the rest of the World (see the statistics mentioned at the end of the last section).
From time to time, US sub-national bodies implement policies that benefit Chinese commercial interests. However, for every such beneficial measure there are 13 sub-national US measures that likely harmed Chinese commercial interests. The comparable ratio at the US Federal government level is 1:5.3, suggesting that sub-national governments have a greater propensity to introduce measures harmful to Chinese interests.Footnote 17
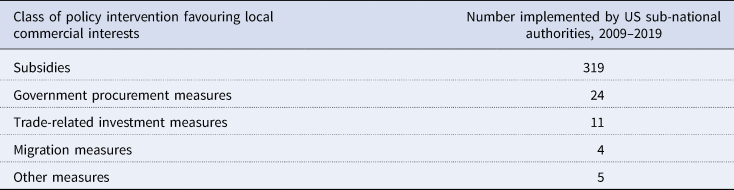
The policy instrument of choice for US sub-national governments when seeking to favour local firms are subsidies of different types (see Table 1). Some 87.9% of the 363 policy interventions potentially harming Chinese commercial interests implemented by US sub-national governments were forms of subsidy. Relief from local taxes and social insurance payments accounted for 213 of the 319 subsidies given: 61 were financial grants, 31 were state loans, and nine were in-kind grants. Under 7% of the policy interventions, likely harming Chinese commercial interests, involved US sub-national measures requiring local purchases of goods and services by state agencies.
Subsidies account for nearly 88% of all US sub-national measures affecting Chinese commercial interests, 2009–2019

Source: Global Trade Alert database, 14 August 2020.
Favouring particular firms is said to be a frequent practice of Chinese local governments. So it is with US sub-national governments. Of the 363 harmful interventions imposed by US local governments, 288 were firm specific in nature. Billion dollar-plus packages have been offered to General Motors,Footnote 18 Nike,Footnote 19 Royal Dutch Shell,Footnote 20 Chrysler,Footnote 21 Tesla,Footnote 22 and Sasol,Footnote 23 amongst others.
Turning now to the intertemporal variation in US sub-national policy intervention, care must be taken in controlling for reporting lags. Recall that the sample used here refers to years 2009–2019. As of this writing, there have been 20 months to collect information on state measures taken in 2019. In contrast, there have been 140 months to collect information on policy interventions implemented in 2009. Given the combination of time needed to find and document policy intervention and the tendency of many public bodies to publish details of their actions with a considerable lag, then raw, unadjusted totals for policy intervention are likely to show, other things being equal, less intervention in most recent years. This is problematic given interest here in whether sub-national governments intensified favouritism to local firms at the expense of Chinese commercial interests since 2017 (the years since President Trump took office.)
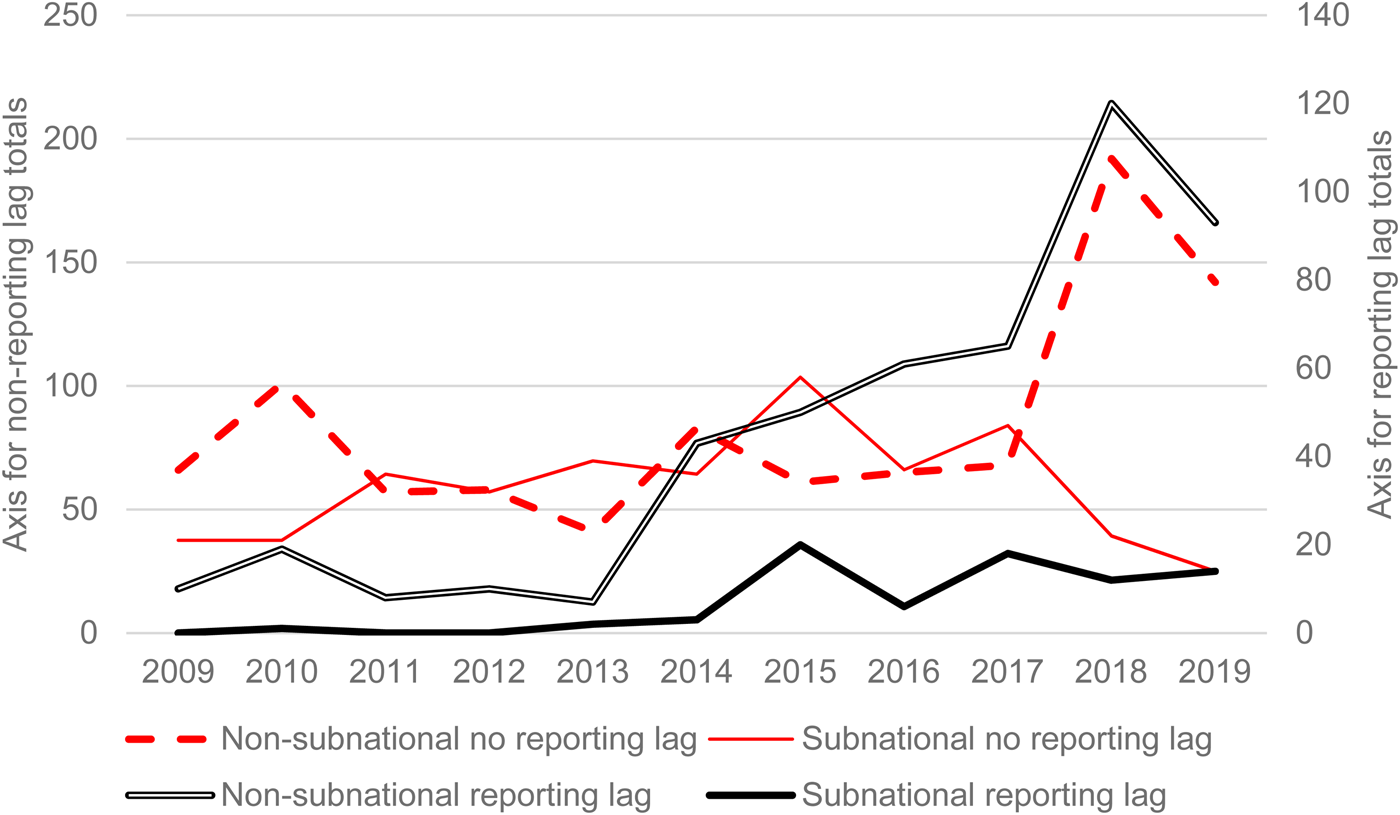
Figure 1 plots using red lines the number of harmful interventions by sub-national and other levels of the US government from 2009 to 2019. These raw, unadjusted totals give the impression that US sub-national governments introduced fewer new discriminatory policy interventions that likely harmed Chinese commercial interests after the Trump Administration took office. The comparable raw totals for the Federal government soar from 2017 on.
US states and cities did not join the escalation in discrimination against Chinese commercial interests launched by the Trump Administration. Source: Global Trade Alert, 14 August 2020.

The following correction for reporting lags was performed. To impose a common reporting interval on each year, only those policy interventions implemented and documented between 1 January and 31 December of the year in question were counted. The black lines in Figure 1 plot the respective annual totals for the sub-national governments and for other levels of government that were documented in the 12 months since the start of each year.
A new pattern emerges, at least for the sub-national governments.Footnote 24 The pace at which US cities and states introduced measures that harmed Chinese commercial interests picked up in 2015 and the pace has remained unchanged through to 2019 (see Figure 1). There is no apparent break in behaviour with the election of the Trump Administration. If the Trump Administration influenced the states and cities in this regard, it was not to increase the pace of new measures introduced to favour local firms at the expense of Chinese (and possibly other foreign) rivals.Footnote 25
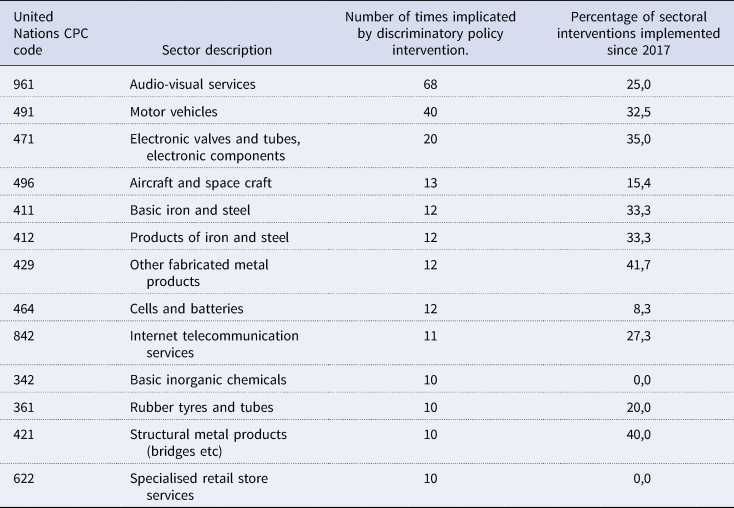
Which sectors were implicated by US sub-national government measures that harmed Chinese commercial interests? Were those sectors traditional manufacturing industries or sectors at the forefront of technological competition with China? To answer these questions, it is important to bear in mind that some of the 363 harmful interventions implemented by US cities and states implicate more than one sector of economic activity. In fact, these 363 sub-national actions affected 174 of the three-digit sectors classified by the United Nations (in their CPC classification) 594 times. A total of 13 sectors account for 240 of those 594 instances (see Table 2).Footnote 26 Each of those sectors has seen ten or more sub-national policy interventions in favour of local firms.
Three service sectors and 10 goods sectors were frequent beneficiaries of US state and city intervention where China has commercial interests in the United States, 2009–2019

Source: Global Trade Alert, 14 August 2020.
What is interesting about the sectors listed in Table 2 is that they represent a mix of traditional manufacturing sectors as well as some sectors at the technological cutting edge. Audio-visual services stand out and are arguably neither. In fact, further investigation revealed the high number of policy interventions reported here reflects a subsidy contest between certain US states and Canadian provinces to lure high profile movies and television series to film in their jurisdictions.
Leaving the audio-visual sector aside, Table 2 shows that a number of traditional sectors that have sought protection from import competition from Washington DC have also sought financial support from their city and state governments. Motor vehicles,Footnote 27 iron and steel, and other metal products fall into this category and serve as a reminder that sub-national governments may have defensive commercial policy interests too.
It is noteworthy, however, that some of the US sub-national intervention targets sectors associated with cutting edge rivalry with China – such as internet telecommunications services, electronic components, batteries, and aircraft and spacecraft. A total of 56 such interventions between 2009 and 2019 implicate those sectors that are at the centre of the techno-economic rivalry between China and the United States.
The last column of Table 2 indicates how much of the intervention in each sector has been witnessed since the Trump Administration came to power (from 2017 to 2019 to be precise). Had intervention in a sector been uniform across years then the last column should report 27% (=3/11 in percentage terms). What is striking is that, as far as counts of policy initiatives are concerned, only one cutting-edge sector witnessed more frequent intervention since President Trump took office (electronic components), while several smoke-stack industries do.
Put differently, if US sub-national governments had taken up the charge to promote America's technological cutting-edge sectors since the overt rivalry with China began in 2017, then why are there so few new initiatives to support the cells and batteries sector and the aircraft and space craft sector?
On the basis of these findings, it is difficult to argue that US cities and states intensified their support during 2017 to 2019 for those sectors thought to determine global technological leadership in the decades to come. If anything, between 2017 and 2019 US cities and states directed new initiatives towards the traditional manufacturing industries of yesteryear, which may in part be in response to greater import competition from China, amongst other factors.
4.2 Export Coverage
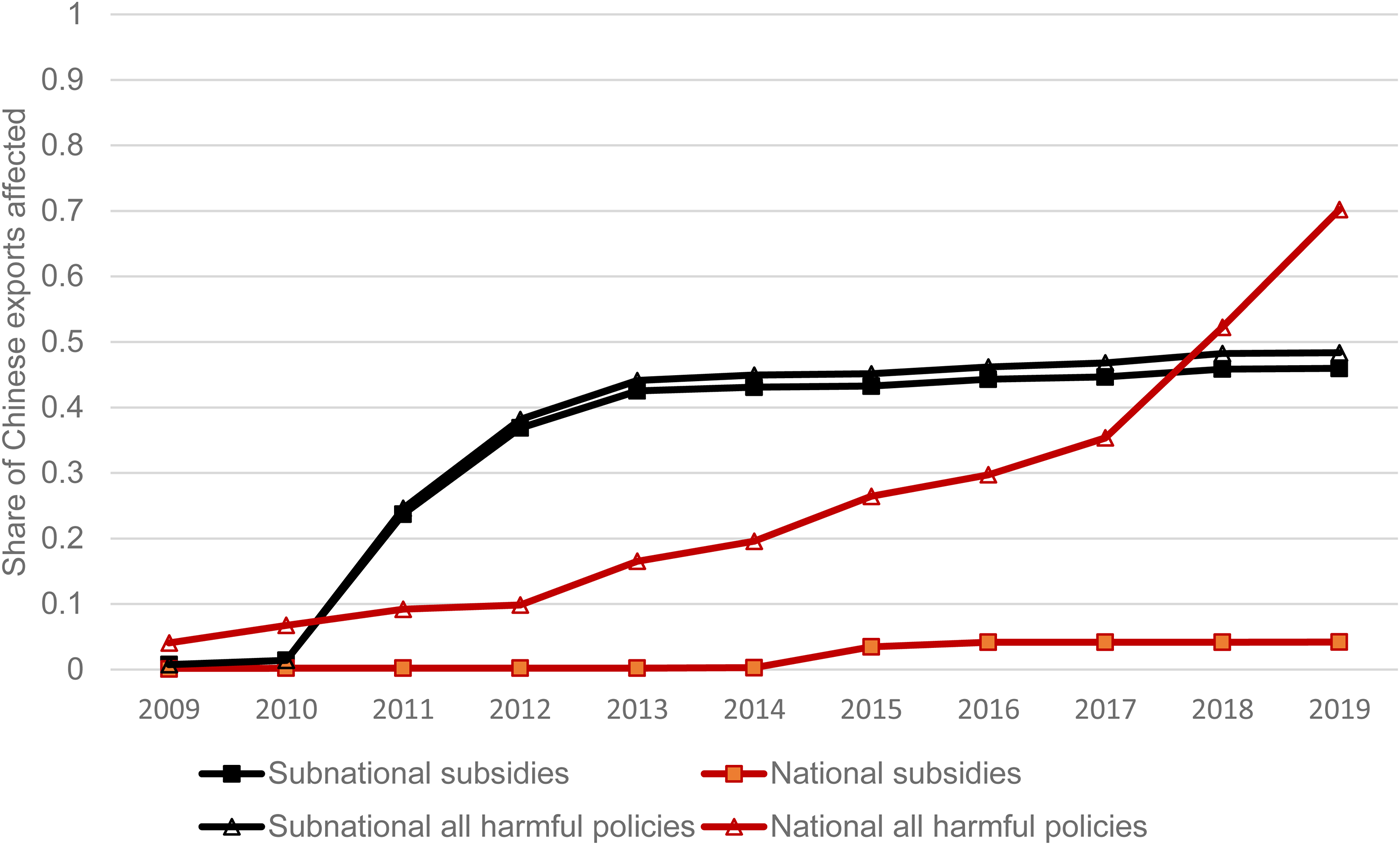
Counts are only one metric to assess patterns of policy intervention. There is a long tradition in international trade policy analysis of assessing the trade ‘covered’ (or potentially implicated) by policy intervention. On this metric, how does US sub-national intervention that harms Chinese commercial interests stack up when compared to intervention by other levels of the US government, specifically the Federal Government? To assess this question, the percentage of Chinese exports facing discriminatory policy instruments implemented from 2009 to 2019 by different levels of US government were calculated, taking account of when interventions came into and out of force.Footnote 28 The findings are reported in Figure 2 for all harmful policies and for subsidies only (given their central role in sub-national government intervention).
Only in 2018 did the Federal government's discriminatory interventions implicate more Chinese exports than measures taken by the US cities and states. Source: Global Trade Alert, 14 August 2020.

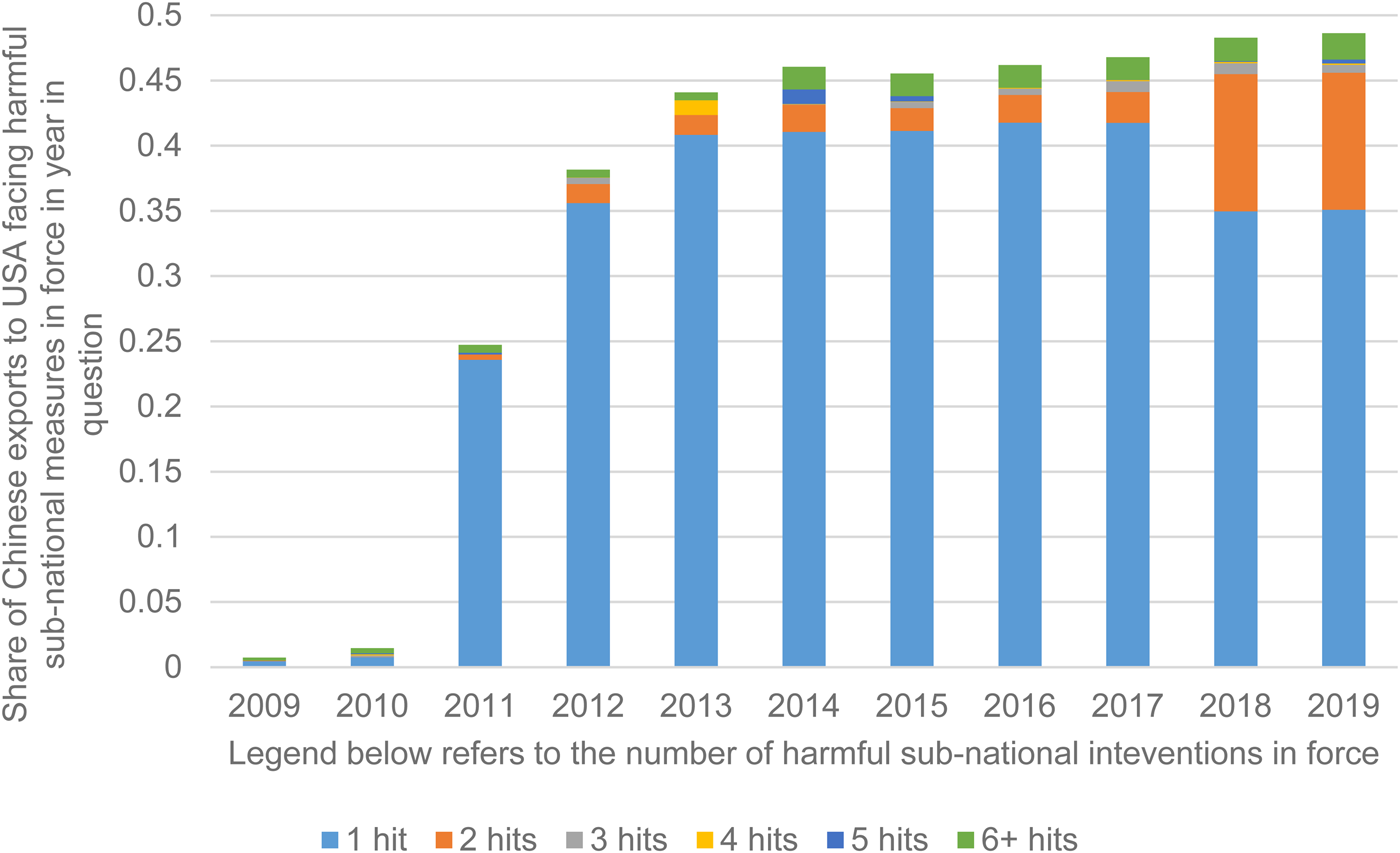
A very different picture of the commerce implicated by US Federal and sub-national policy intervention emerges once trade coverage is considered (see Figure 2). Although US cities and states accounted for less than 30% of the instances of discrimination against Chinese commercial interests from 2009 to 2019, in fact the amount of trade covered by their interventions surged during 2011–2013 and has slowly risen since then. Subsidies to local firms that face competition from Chinese rivals lie behind this significant expansion of Chinese export exposure, to almost 50% in 2019. In contrast, Federal subsidies to firms based in the United States that face import competition from China never implicate more than 10% of Chinese exports during 2009–2019.
It is only when the Sino-US trade war takes place that the share of Chinese exports disadvantaged by Federal government intervention exceeds that share attributable to US cities and states. In 2018, the Federal share exceeded that of the sub-national governments for the first time and the excess increased in 2019 (to approximately 70% of the value of Chinese exports.Footnote 29)
What is striking here is that the high-profile Federal trade war against Chinese exports was preceded by a much lower profile expansion in the US city and state actions to tilt the commercial playing field in favour of local firms and against Chinese (and potentially other foreign) rivals. There is no suggestion here that the US sub-national authorities coordinated their policy intervention. If anything, it appears that the US Federal Government came late to this particular party.
Another difference, of course, is that the Federal Government wielded tariffs very publicly whereas the US cities and states quietly got on with awarding many firm-specific subsidies. Indeed, these findings beg the question as to whether entrepreneurial politicians at the Federal level sought to capitalize on developments well under way at the sub-national level. So rather than thinking of the Federal government influencing the city and state governments, maybe the actions of the latter influenced the timing of proposals of certain politicians acting on the national stage?
The total export exposure statistics presented in Figure 2 further support findings earlier that the tempo of US sub-national intervention did not accelerate once President Trump took office. That still leaves open the possibility, however, that certain exports from China faced more US sub-national policies favouring local firms. Figure 3 confirms this was the case, in particular after the Sino-US trade war intensified in 2018 and 2019. In the language of trade economists, there was little change in the extensive margin but more in the intensive margin.
Total Chinese export exposure grew little since 2014 but the share of exports facing two or more sub-national harmful interventions multiplied during the trade war. Source: Global Trade Alert. 14 August 2020.

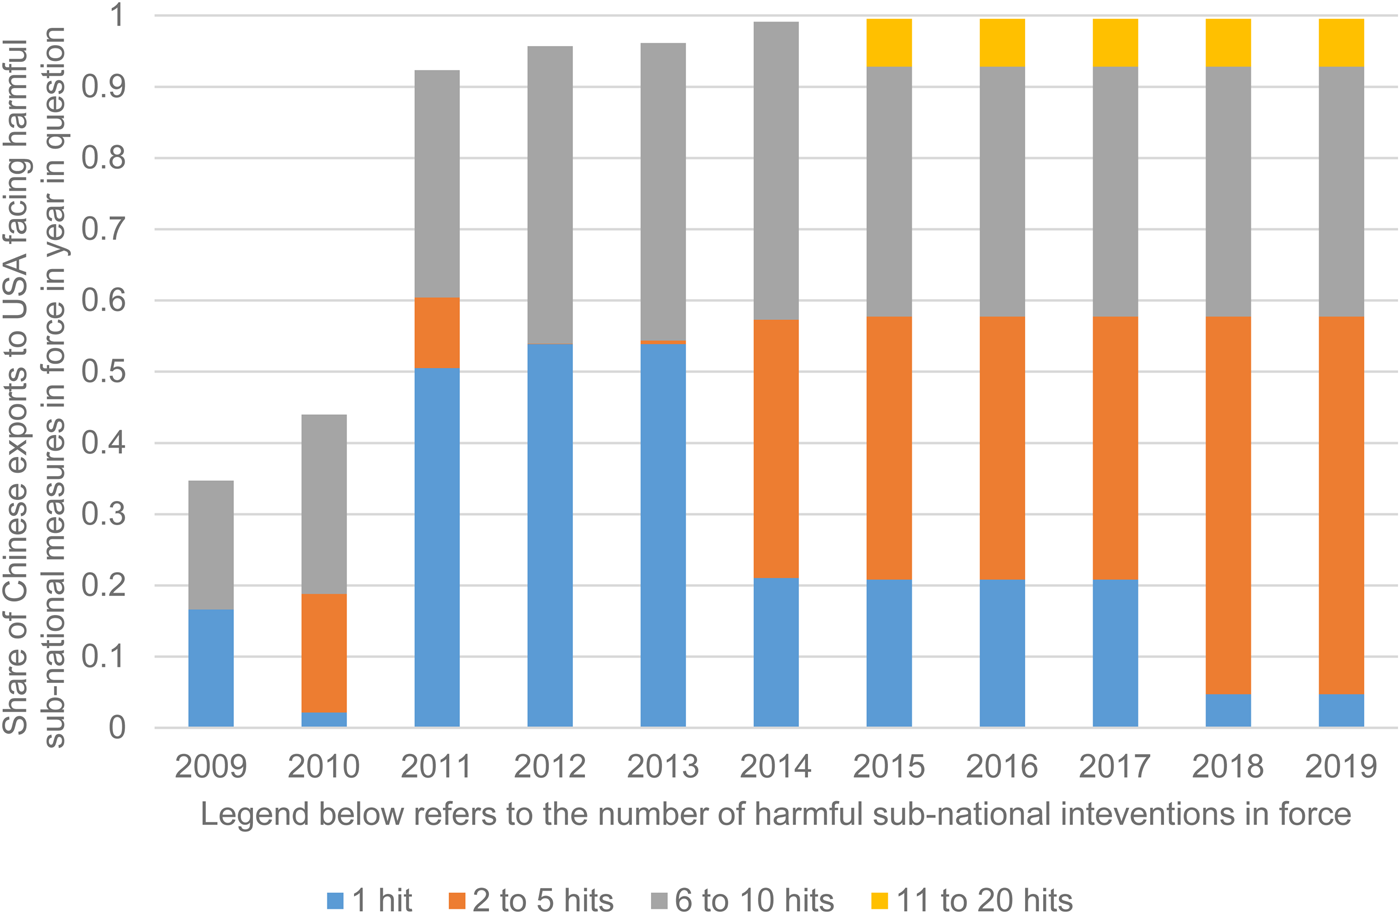
Further evidence that US cities and states may have piled on the agony on Chinese exporters during the trade war era comes from looking at the 10 traded goods sectors most frequently hit by harmful US sub-national measures identified in Table 2. Figure 4 reproduces Figure 3 but for those ten most hit traded good sectors. By 2014, almost all of the Chinese exports in these ten sectors faced one or more US sub-national policy intervention that put them at a commercial disadvantage. In 2018 and 2019, as the trade war intensified, there was a clear reduction in the share of exports hit once and growth in the share hit two to five times.
The trade war saw more Chinese exports hit more often, but there were jumps in 2011 in the extensive margin and from 2014 in the intensive margin. Source: Global Trade Alert. 14 August 2020.

Similar shifts in Chinese export shares from facing one to 2–5 harmful interventions were found in 2014. Moreover, from 2015 around 5% of Chinese exports had been hit 11–20 times. The trade war is part of the story of tougher conditions facing Chinese exporters in US markets – but it is not the entire story. Such evidence is consistent with the US cities and states acting independently of the US Federal government, in this case tilting the commercial playing field in favour of local firms before the Trump Administration took office.
Given the focus of this paper on US–Chinese rivalry and associated economic statecraft, the question arises as to whether the scale and timing of harmful US sub-national policy intervention implicating Chinese interests over 2009–2019 differed from that facing other US trading partners. To be clear, showing that such differences exist is a necessary condition but not a sufficient condition for US sub-national targeting of Chinese commercial interests. After all, US sub-national policymaking may be driven by other considerations and greater similarities in the patterns of specialization in China and the United States than between other trading partners and the United States might account for greater Chinese export exposure.
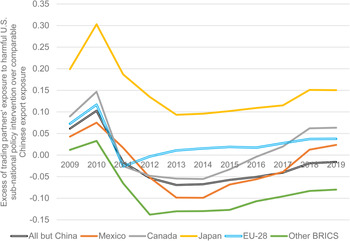
A comparison of Chinese export exposure to harmful US sub-national policy intervention from 2009 to 2019 with that of America's NAFTA partners, Japan, the other members of the BRICS grouping,Footnote 30 and the members of the European Union is presented in Figure 5. Several pertinent findings arise from both the cross-sectional and intertemporal variation graphed therein. First, the significant increase in Chinese export exposure from 2010 to 2013 identified in Figure 2 was not experienced by any other major US trading partner in Figure 5, nor by all of the other US trading partners taken together (as shown by the ‘All but China’ line).
The surge in Chinese export exposure witnessed between 2010 and 2013 was not replicated in other major trading partners of the United States. Source: Global Trade Alert. 4 October 2020.

Second, after 2010 Chinese export exposure consistently exceeded that of the rest of the BRICS group, although the gap narrowed after 2012 – a finding not inconsistent with China being treated differently. Third, Chinese export exposure falls short of comparable Japanese export exposure, which begs the question as to whether resisting import competition from East Asia was a driver of US sub-national policy intervention, rather than competition from China in particular. Fourth, Chinese export exposure ended the period pretty much in line with the export exposures of other US major trading partners, such as its NAFTA partners and the European Union.
Indeed, taking these third and fourth findings together suggests an alternative hypothesis: namely that in the years after 2009 the pattern of US sub-national government intervention was such that China was no longer treated as a ‘BRIC’ but much more of a major US trading partner that it had, in fact, become. To the extent that there was any targeting, then, by US sub-national governments it could be seen as bringing China into line with the major competitors for customers in US markets – not in singling out China for especially harsh treatment.Footnote 31
Having written this, the surge in relative Chinese export exposure from 2010 on was followed by a partial reversal after 2014 (as shown by the ‘All but China’ line in Figure 5). Still, on the basis of the evidence presented here – in particular the intertemporal evidence – the notion that Chinese export exposure moved in line with other major US trading partners can be set to one side. At a minimum, the trade incidence of harmful US sub-national policy intervention from 2009 to 2019 was not neutral across major US trading partners and the remaining BRICS.
4.3 Contemporary Economic Statecraft in Light of These Findings
What are the implications of these empirical findings for our understanding of contemporary economic statecraft? Since 2009, US cities and states have taken hundreds of measures to favour local firms, the great majority of such interventions involved granting various forms of firm-specific subsidies. As a result, by 2013 over 40% of Chinese exports faced worse competitive conditions in US markets on account of sub-national policy intervention that had been imposed since 2009. That percentage continued to grow to nearly 50% in 2019. In the ten traded goods sectors hit most often by harmful sub-national intervention, the percentage was just below 100% in 2014 and has stayed at that elevated level. From 2014 on, if any new harmful sub-national measures have compounded the difficulties facing Chinese exporters hit in the past. These findings indicate both the importance of the sub-national dimension to international trade relations and the ability of sub-national decision-makers to act independently of the central government. The actions of US sub-national decision-makers belie a strong commitment to preserving a level commercial playing field.
The increase in the number of US Federal measures that discriminated against Chinese commercial interests was one clear manifestation of the US–Sino trade war, as was the sharp increase in the share of Chinese exports facing disadvantages on account of Federal action. However, only from 2018 onwards did the Chinese export exposure to harmful US Federal government measures exceed their exposure to harmful measures taken by the US cities and states. If anything, US cities and states moved first and the Federal government later.
Neither the counts of, nor the Chinese export exposure to, US sub-national harmful measures rise sharply during 2018 and 2019. However, some Chinese exports that had faced harmful sub-national policies before the trade war faced more policy-induced disadvantages during that war. Still, it is doubtful that key economic statecraft considerations were uppermost in the minds of political leaders in US cities and states as trade relations deteriorated between Beijing and Washington. Why? Since 2017, those sub-national decision-makers did not shift their favouritism markedly towards local firms in sectors where technological rivalry with China is intensifying. Like the Federal government, much sub-national intervention harmful to Chinese commercial interests in recent years targeted sectors associated with the manufacturing jobs of yesteryear. This suggests defensive considerations held greater sway. Ultimately, governments have more than one reason to tilt the commercial playing field towards domestic firms. But this does not imply that the decisions of policymakers in US cities and states are irrelevant for understanding economic statecraft. Any state strategy to confer relative advantage on one country's economy or its leading firms over another's ought to take into account the cross-border commercial spillovers generated by decisions of other levels of government. Central governments are not the only source of such spillovers – but they do receive the lion's share of attention in writing on economic statecraft. In light of the evidence presented here, perhaps a corrective is in order.
Furthermore, in countries where political leaders must win competitive elections before taking national office then the position taken on economic statecraft during a national election campaign (and afterwards) may well be influenced by trends witnessed at the sub-national level. This may be particularly germane in the United States where the Electoral College system gives the state electoral outcomes in Federal elections a central role.
In the case of the United States, city and state governments were tilting the commercial playing field more and more in favour of locally based firms and thereby pushing back against commercial interests based abroad on a significant scale well before the election of President Trump. To what extent, if at all, was the reception of his America First message on trade policy eased by greater local favouritism? The hypothesis here is that shifts in the preferences and actions of sub-national decision makers may have influenced national level choices on economic statecraft. Further research could test this hypothesis.
5. Concluding Remarks: The Narcissism of Small Differences?
Before drawing any conclusions, it is important to acknowledge and discuss two caveats of this analysis. The first is that the evidence on US sub-national policy intervention referred to here relates to frequency of policy intervention, sectoral coverage, and import coverage. While substantial, a complete understanding would require estimates of the cross-border effects of such intervention.Footnote 32
In reflecting on the significance of this point, it is worth bearing in mind that many US and European policymakers, analysts, and journalists have criticized the global consequences of Chinese sub-national policies without basing their case on compelling evidence of their effects.Footnote 33 For many, evidence of existence of policy, or worse apparently compelling anecdote, was enough to condemn the Chinese development model. They did not wait for econometric evidence.
Furthermore, given the growing sophisticated econometric literature that demonstrates the cross-jurisdictional spillovers of the subsidy and other policies of US state, city, and town governments, on what reasonable grounds should we suppose that the spillovers are entirely confined to within US borders? Even if this were the case, the commercial interests of the United States’ trading partners whose firms have foreign direct investments in America would still be implicated. There is a high bar to cross in demonstrating that US sub-national policymaking is of no economic interest to foreign governments.
The second caveat concerns the completeness of the available data on US sub-national policy decisions. This remains incomplete – how incomplete only time will tell as the GTA team continues to collect relevant information. Given that, to date, for every policy intervention by a US state, city, or town found to potentially benefit Chinese commercial interests there were 13 that likely harmed Chinese firms, then unless future data collection uncovers a markedly different policy intervention mix, documenting more US sub-national policy interventions will almost certainly reinforce many of the findings reported here. Having said that, the composition of sectors implicated by such policy intervention and the intertemporal variation could alter in meaningful ways.
It is worth reflecting on why information about US sub-national policy intervention is so scarce, not least since the August 2015 Statement No. 77 of the US Governmental Accounting Standards Board (GASB 77) came into effect. This statement requires US states, cities, and towns to publicly disclose the tax abatements awarded to companies. Before that, there was no requirement under established government accounting procedures to so disclose. There is little evidence that US sub-national governments chose to disclose such abatements before GASB 77 came into effect. What is of greater relevance here is that, according to the monitoring undertaken by the Good Jobs First initiative, disclosure remains patchy (Good Jobs First, 2020).
The reluctance of US sub-national governments to embrace accepted notions of transparency casts one important aspect of the debate over Chinese state capitalism in a different light. US accusations about lack of Chinese transparency are vitiated by the actions of their own sub-national governments. A plague on both your houses might be a tempting conclusion. Another, more constructive way of looking at this matter is that it highlights the potential benefits of international obligations to disclose information, in so far as those obligations are complied with.Footnote 34 However, if proper, wholehearted disclosure is ultimately a voluntary choice, then convincing policymakers at all levels of government of the benefits of transparency is necessary. Once again, the outcomes of domestic political discourse on fundamental governance matters are an important determinant of the extent of cross-border commercial harm induced by policymaking.
Suppose for the moment that the scale of imports into China affected by sub-national policy intervention that favors local firms is large. Given the finding that half of US imports from China are likewise affected by favouritism by US states, cities, and towns, then combined with lack of transparency, there are strong parallels on both sides of the Pacific. It is tempting to conclude that this is an example of the narcissism of small differences obscuring an important policy debate about how to reconcile different types of capitalism that include active states with the principles of a liberal international trading system. This is not to imply that contemporary American and Chinese capitalism are identical or equivalent. Rather it is to imply that, on the basis of observed metrics, the sub-national policy intervention seen in both nations may in many essential respects be more similar than previously acknowledged. Which then brings us back to the central question of this paper: Is there a sub-national dimension to contemporary economic statecraft?
On the basis of the evidence presented in this paper, it would be unwise to rule it out. So long as leading economic powers – not only China and the United States – have constitutional structures, which give sub-national governments rights to favour local firms, then analysts ought to be alert to the possibility of a sub-national dimension to economic statecraft. The extent to which national constitutions allow de jure or de facto for independent action by sub-national governments is another important consideration.
Having said that, those wishing to demonstrate that this dimension is important must recognize two fundamental points. First, like national governments, sub-national governments have motives other than those underlying economic statecraft and so care must be taken in attributing any particular policy intervention to geo-strategic competition. Second, once one allows for sub-national governments to engage in economic statecraft, then the question surely arises as to whether policymakers at different levels of government in a nation share the same objectives and commitment to any particular strategy for geo-strategic competition. The potential for conflicting policy interventions exists, raising in turn questions about the effectiveness of cooperation between levels of government in designing, deciding, and executing economic statecraft.
Lastly, to the extent that sub-national governments contribute consciously to geo-strategic competition, then surely the notion of economic statecraft needs to be reformulated? After all, that notion appears to have been largely conceived with national government strategy and policy intervention in mind, perhaps heavily influenced by the contest between Moscow and Washington DC during the Cold War (amongst other episodes of great power rivalry). To the extent that the sub-national dimension is relevant, it begs questions about the relevant unit of analysis but also the relationship between different decision-making units and the whole.Footnote 35
Acknowledgements
I thank participants at a conference titled Great Power Competition in the 21st Century: Linking Economics and Security, held at Berkeley on 24 October 2019 for comments on a powerpoint presentation that became the basis of this paper. I also thank the reflections of two anonymous referees, James Davis, and Jonathan Fried.