I. INTRODUCTION
Strengthening metals involves introducing barriers to inhibit the motion of dislocations. These barriers can be grain boundaries, interfaces, dislocations, precipitates, and second phase particles. In the case of precipitates, the dislocation bypass mechanisms at room temperature are classified as cutting, bowing around the particle with the formation of an Orowan loop on the original glide plane or cross slip that may generate one or more loops on either side of the particle, e.g., the Hirsch bypass mechanism.Reference Humphreys and Hirsch1 The operational mechanism is dependent on the dislocation character, edge, screw or mixed, and partial or perfect; the precipitate coherency and size; the intersection of the active slip plane with respect to the precipitate; the availability of slip on multiple slip systems; the local shear stresses on the available slip systems; and the deformation history. Increasing the test temperature introduces additional possible bypass processes that involve dislocation climb. Although the strengthening mechanisms have been the focus of attention from dislocation theory, electron microscopy including time-resolved studies,Reference Clark, Robertson, Dougherty, Ahn and Sofronis2, Reference Dougherty, Robertson and Vetrano3 and more recently computer simulations,Reference Xiang, Srolovitz, Cheng and Weinan4, Reference Xiang, Chang, Srolovitz and Weinan5 there remains a lack of understanding about them. What has emerged from these studies is that the classical interactions form a small subset of the possible interactions between the dislocations and particles.
For example, Xiang et al.,Reference Xiang, Srolovitz, Cheng and Weinan4 using the level set method for dislocation dynamics, investigated the interaction of dislocations with penetrable and impenetrable particles at ambient temperature and found a wide range of bypass processes that included particle cutting, dislocation loop formation, and a combination of these processes. Dislocation loops were found in front, behind, on the sides of particles, and around them. The bypass processes were both classical and new. For example, Xiang et al.Reference Xiang, Srolovitz, Cheng and Weinan4 showed that a screw dislocation interacting with an array of misfitting particles generates an array of loops around them. This dislocation structure can continue to evolve as the loops interact. This interaction destroys the loops and produces a new dislocation with the same Burgers vector as the original dislocation and another in the opposite sense around the particles. This latter dislocation, because of the misfit stress around the particle, forms two new loops around each side of the particle. They suggested that, as this finding was fortuitous, there should exist other interactions that also generate new dislocations. Applying this method to higher temperatures, Xiang et al.Reference Xiang and Srolovitz6 reached a similar conclusion that the classical bypass mechanisms are just a subset of the many possibilities that exist. Examples of new bypass processes involving edge dislocations would include climb over a particle without leaving a loop and pushing past the particle and creating a loop around or adjacent to it. A screw dislocation could create a helical structure around the particle or leave multiple loops around it. The bypass mechanism again depend on the particle, penetrable or impenetrable, the dislocation, the point of intersection on the particle of the slip plane, and the extent of dislocation climb.
The alternate method for investigating dislocation particle interactions is to perform straining experiments in the electron microscope.Reference Clark, Robertson, Dougherty, Ahn and Sofronis2, Reference Dougherty7 Such efforts yielded similar conclusions as the dislocation dynamic simulations, namely that numerous processes exist by which a dislocation can bypass a particle. One difference was the role of having multiple slip systems active such that different dislocations were impacting the particle simultaneously or sequentially. The simultaneous interaction on multiple systems impacts the interaction of both dislocations with the particle and can effectively retard the bypass process.Reference Clark8 Furthermore, having more than one slip dislocation active permits interaction with and annihilation of the debris created by previous interactions, which impacts subsequent dislocation interactions with this particle. The TEM experiments suffer from the difficulty that the micrograph is a two-dimensional projection of the three-dimensional (3D) dislocation structure on the electron exit surface of the specimen. Consequently, critical information in the beam direction, the z-direction, is lost. It is possible to recapture some of this lost information by stereo microscopy, using stereo images or red–blue anaglyphs. A more versatile visualization capability is to use electron tomography, a technique pioneered by the biological community,Reference McEwen and Marko9, Reference McEwen, Renken, Marko, Mannella, John and Detrich10 to produce a 3D reconstruction of the through-thickness information.Reference Midgley and Dunin-Borkowski11
To form an electron tomogram, many images, as many as one per degree of tilt, of the area of interest must be acquired over a large angular range (±70° is typical) with minimal variation in image contrast.Reference McEwen and Marko9–Reference Midgley and Dunin-Borkowski11 The angular tilt limitation introduces a loss of resolution in the through-thickness direction, the so-called missing-wedge effect. The need to minimize contrast fluctuations across such a large data set imposes obvious practical conditions. This limitation makes high-angle annular dark-field (HAADF) imaging in the scanning transmission electron microscope (STEM) the preferred imaging mode over bright-field and dark-field dynamical and kinematical imaging conditions.Reference Midgley and Dunin-Borkowski11 Sharp et al. have suggested that if the degradation in the resolution can be tolerated, annular dark-field STEM should be used over two-beam dynamical and kinematical imaging conditions for exploring the 3D distribution of dislocations.Reference Sharp, Kaneko, Higashida and Midgley12 Despite the limitations and challenges, diffraction contrast images have been used to study the 3D distribution of dislocations in GaNReference Barnard, Sharp, Tong and Midgley13 and Si.Reference Tanaka, Higashida, Kaneko, Hata and Mitsuhara14–Reference Tanaka, Sadamatsu, Liu, Nakamura, Higashida and Robertson17
In this study, the results of the application of electron tomography to dislocation interactions with precipitates along with conventional analysis of dislocations are presented to understand how dislocations interact with and bypass particles. It will be demonstrated that the tomogram can be used to construct a 3D model of the dislocation structure that includes a correctly oriented Thompson’s tetrahedron. That is, it is possible to include in the 3D model the coordinate system of the specimen. It also will be shown that these visualization tools along with conventional g·b analysis can provide a full characterization of the dislocation structure that provides new insight to dislocation interactions and processes.
II. EXPERIMENTAL METHODS
An Al–4 wt% Mg–0.3 wt% Sc alloy was homogenized at 848 K for 6 h and then aged at 553 K for 8 h to produce Al3Sc precipitates. Specimens for TEM observation were prepared using twin-jet electropolishing in a 33% nitric acid/67% methanol solution at 245 K and 6 V.
Acquisition of tilt-series images and additional microstructural analyses were carried out using a 2010(LaB6) transmission electron microscope (TEM; JEOL, Tokyo, Japan) operating at 200 kV using a standard double-tilt holder with a tilt range of ∼±35°. The dataset was collected by aligning one Kikuchi band with the primary axis of tilt, which was enabled near maximum angular collection. The imaging method used, unless otherwise indicated, was weak-beam dark-field imaging with the same g-vector and deviation parameter maintained over the entire tilt-series—the diffraction vectors were of low order and a (g, 3g) condition was used. Micrographs were recorded with a Smartscan CCD camera (Gatan, Pleasanton, CA) in gain-normalized mode.
Images from the tilt-series were aligned using the EM3D 2.0 software with a number of computer-assigned and user-defined markers, most of which corresponded to small defects a few nanometer in size or dislocation junctions, as these features were easy to identify and remained present throughout the series. Construction of a 3D visualization model was enabled by tracing and labeling the dislocations using toolsets within University of California, San Francisco Chimera software (build 1.4.1).
III. RESULTS AND DISCUSSION
Before presenting the results from the tomographic reconstruction of dislocation reactions, a method for incorporating the specimen coordinate system within the tomogram was developed. This capability is essential for a complete analysis of the dislocation interactions in, for example, the determination of the slip plane on which dislocation lines and loops reside. The method utilizes matching projected distances and the angles between these projected vectors in the tomogram and in an electron micrograph acquired at a known beam direction, preferably at a major zone. When a match is found, the relationship between the reciprocal and real lattice vectors is used to assign directions in the tomogram. This process is repeated for several different beam directions. Using this approach, it is possible to position a correctly oriented Thompson tetrahedron in the tomogram and the 3D model that rotates with both.
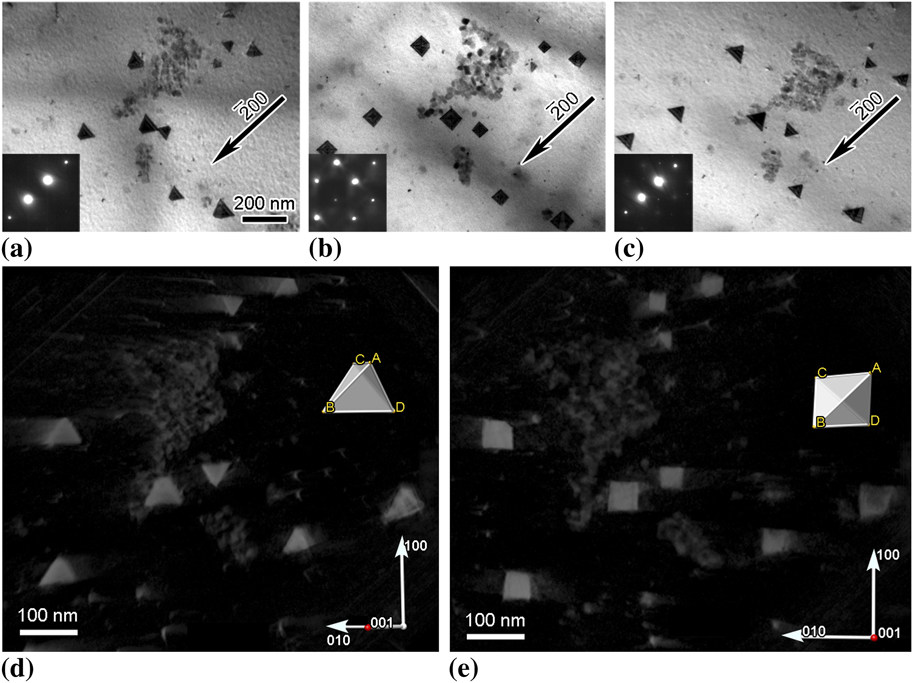
To illustrate the viability of the approach and to estimate its accuracy, a tomogram of large stacking-fault tetrahedra in quenched gold was reconstructed from a series of images acquired over the angular range from −29.1° to +39.3°; this corresponded to traversing from the  zone through the (001) zone, to just pass (012). The tetrahedra are bound by stair-rod dislocations that lie along the <110> edges of the {111} planes that form the tetrahedra. For the same diffraction vector, the projected shape of a tetrahedron depends on the beam direction and changes from triangular form near a {110} type zone to square at {001} zone, then back to triangular form as the beam direction approaches another {110} zone. These changes in projected image shape are seen in the bright-field micrographs presented in Figs. 1(a)–1(c). Knowing that the edges of the tetrahedron must lie along <110> directions provides an internal reference that can be used to verify the placement of lattice directions and a Thompson tetrahedron locked within the tomogram. Using this approach for multiple beam directions, it was found that the Thompson tetrahedron could be oriented within ±3° of the projected edges of the actual tetrahedra. The correlation between the Thompson tetrahedron and the Au tetrahedra can be ascertained from the snapshots from different viewing directions presented in Figs. 1(d) and 1(e) and in supplemental movie file 1.
(a)–(c) Change in the projected image of stacking fault tetrahedra in Au for the same diffraction vector but different beam directions. Beam directions were near [011], [001], and [ ]for images (a), (b), and (c), respectively. (d) and (e) Select snapshots of the tomographic reconstruction of the tetrahedra showing the projected shape along with a Thompson tetrahedron inserted based on a constellation matching method. The [001] direction, marked with a red dot on the coordinate axes, is coming out of the page at (d) ∼45° and (e) ∼90°.

From previousReference Clark, Robertson, Dougherty, Ahn and Sofronis2 and current post-deformation and time-resolved TEM straining experiments on particle-strengthened alloys, it is known that there is a wide variety of possible interactions between dislocations and particles. These interactions generate dislocation structures on and adjacent to the particles. The electron micrographs presented in Fig. 2 show examples of possible structures generated by dislocation–particle interactions. In these images, dislocation lines and loops can be seen extending from the particles and existing separate from them. Some line dislocations extend between the particles, suggesting that they were produced by an interaction that involved multiple particles [Figs. 2(c) and 2(d)]. This formation mechanism has been observed in time-resolved in situ TEM straining experiments. Similarly, the loops away from the particle are generated as part of the dislocation–particle interaction, with the loop pinching off and breaking free after completion of the interaction. Although the time-resolved experiments provided insight about the sequence and dynamics of dislocation–particle interactions, discovering the reasons for the different interactions is limited as information on the spatial relationship is missing. The dislocation dynamic simulations demonstrated that knowledge of this spatial relationship was important to differentiate between the various reaction possibilities.Reference Xiang, Srolovitz, Cheng and Weinan4, Reference Xiang, Chang, Srolovitz and Weinan5
Examples of dislocation structures created through the interaction of dislocations with Al3Sc particles in an Al–Mg–Sc alloy.

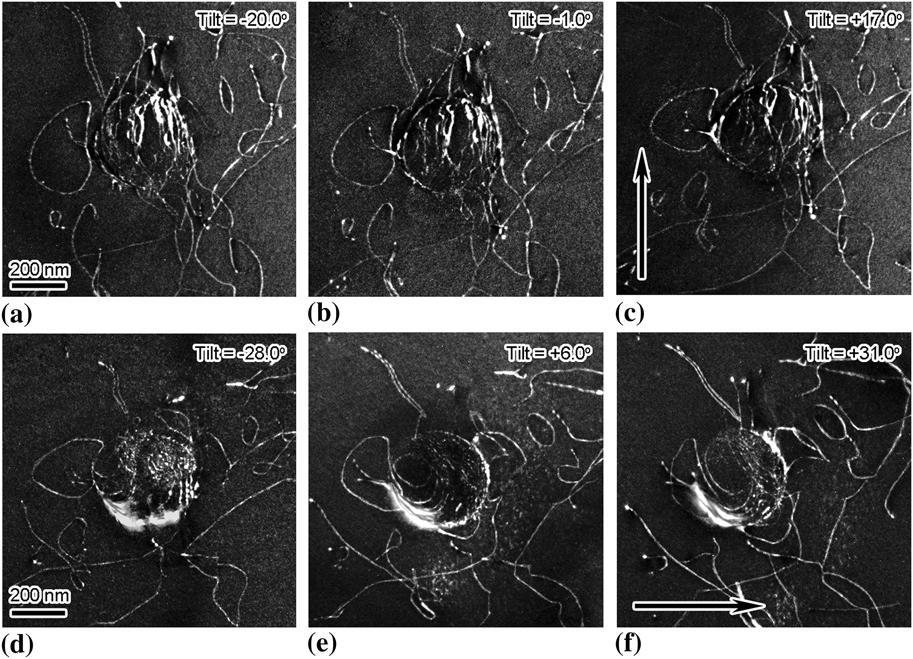
To explore the feasibility of using tomograms to provide information on the spatial relationship between the dislocations and the particles, weak-beam dark-field images of such interactions in lightly deformed samples of an Al–Mg–Sc alloy were acquired every one degree over an angular range of −28° to +32° (X-tilt only) while maintaining a constant deviation parameter and diffraction vector. In one case, two image sets were acquired with orthogonal 020-type diffraction vectors with the intent of combining them to reduce the missing wedge effect—this proved impractical for this image set because of intensity variations and the loss of visibility of some dislocations as they satisfied the |g·b| invisibility condition. Select images from both sets are presented in Figs. 3(a)–3(c) for one diffraction vector, g =  and Figs. 3(d)–3(f) for the other, g = 200. Dislocations are seen curved around the particle, partial loops are attached to the particle interface, and dislocation loops and lines extend away from the particle. Application of g·b analysis revealed that the majority of the dislocations have a common Burgers vector of
 —these have been colored differently from each other for clarity of visualization. The rest of the dislocations, traced in white in Figs. 4(c) and 4(d), have Burgers vectors of a / 2[101, a / 2[110] and
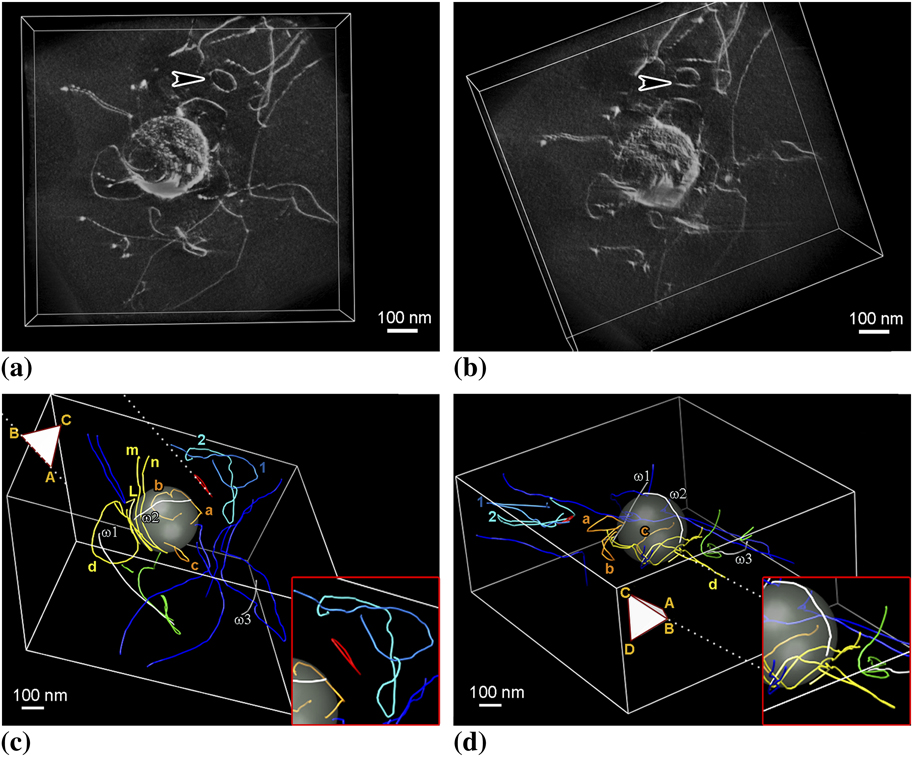
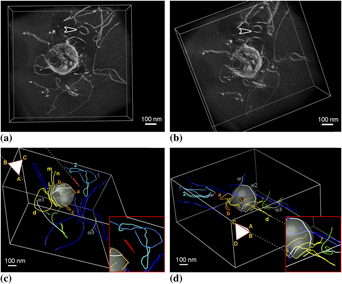
 as indicated. The images presented in Figs. 4(a) and 4(b) show views of the dislocation structure extracted from the tomographic reconstruction. Despite the image broadening and the corresponding decrease in the spatial resolution, the distribution of the dislocations around the particles is clear when compared with Figs. 3(a)–3(f). Dislocations bowing around the particle and dislocation loops attached to the particle can be seen; the arrowed prismatic loop was most likely released from the particle.
Dislocation structure produced around an Al3Sc particle by deformation; the imaging condition was (g, 3g) using g =  for (a)–(c) and g = 200 for (d)–(f). The arrows indicate tilt direction.

Spatial relationship between the dislocations and the particle. All colored dislocations have the same Burgers vector, b =  ; dislocations traced in white have Burgers vectors from left: (ω1) b = a / 2[101], (ω2) b =
 , and (ω3) b =
 , respectively. (a) and (b) Views from different viewing directions extracted from the tomographic reconstruction. (c) and (d) Views from different viewing directions extracted from the three-dimensional (3D) model. Insets show enlargements of parts of the interactions.

The visualization of the dislocation structure and interactions can be further improved from the tomogram by effectively tracing the positions of the dislocation image using toolsets in UCSF Chimera. Here the dislocation position was assumed to be the region of highest intensity when viewed spatially. The positioning was verified by inspecting the traced images superimposed back onto the tomogram. It was found that the traced lines produced good matching from all viewing directions. That is, 3D dislocation positions are faithfully reproduced in the model. Examples of the dislocation structure and interactions as seen from different viewing directions are shown in the series of images presented in Figs. 4(c) and 4(d); enlargements of specific interactions, in particular, the slip plane of select defects with respect to the Thompson tetrahedron are shown in the insets.
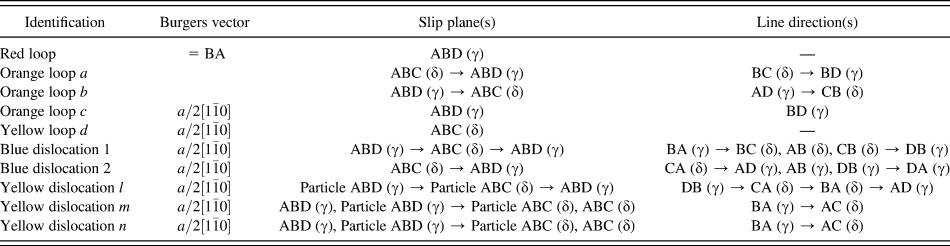
By using the tetrahedron included in these images, it is possible to specify which planes the various loops reside on. Table I lists the slip planes and line directions of the relevant dislocations. For example, in Figs. 4(c) and 4(d), the red loop detached from the particle has a Burgers vector of  (BA) and resides on the ABD (or γ) plane. The orange loops labeled a and b attached to the particle surface lie on different planes, with loop a lying on the ABC (or δ) plane and b on the ABD (or γ) plane. Away from the particle surface, both loops cross slip such that loop a now resides on the γ-plane and loop b on the δ-plane. The Burgers vector of the loops, namely,
 is consistent with the common direction for the intersection of the δ-plane and γ-plane. It is believed that the loops cross-slipped as they extend away from the particle to glide on more energetically favorable slip planes. Orange loop, c, lies on the γ-plane, whereas the large yellow loop, d, resides on the δ-plane. To the authors’ knowledge, cross slip of dislocation half-loops, which themselves resulted from a previous interaction between matrix dislocations and the particle, from the particle–matrix interface has not been simulated, though abundant examples do exist suggesting a variety of possible dislocation debris structures as a result of such interactions.Reference Xiang, Srolovitz, Cheng and Weinan4, Reference Xiang, Chang, Srolovitz and Weinan5
Line directions and planes of the dislocation loops and lines shown in Figs. 4(c) and 4(d).

Identification of the true line direction of the dislocations, however, is more complex because the direction can change as the dislocation line stretches from the top to the bottom surface of the foil. For example, the blue dislocation segment labeled 2 has a Burgers vector b =  and a line direction and slip plane that changes, from the side closest to the red loop, from CA (δ) → AD (γ) → AB (γ) → DB (γ) → DA (γ), indicating that it has cross-slipped as it approaches a foil surface. Dislocation 1 has the same Burgers vector and a line direction that changes from the side closest to the red loop from BA (γ) → BC (δ) → AB (δ) → CB (δ) → DB (γ). Since both 1 and 2 end on the same-side foil surface, it is suggested that they could have been loops similar to the red loop, which have grown large enough to eventually intersect the foil surface. The change in line direction as the surface is approached is consistent with the influence of surface image forces on the direction of the line dislocation.
Two dislocations labeled m and n in Fig. 4(c) curve around the particle, both have a Burgers vector of b =  , reside mostly on the δ-plane, and change line direction as the foil surface is approached due to image forces. For both dislocations, the ends of the dislocations terminate on the same foil surface. Dislocation l, on the other hand, ends on the particle interface while conforming to the interface. This was not the case for any other dislocations in the current data set, though this is a common observation.
What is not known is how these dislocation interactions with the particle will continue with further deformation. It is possible for a portion of the dislocation conforming to the particle surface to pinch off, producing the partial-loop configurations similar to orange loops a and b, with the remaining segment extending from the matrix–particle interface to the free surface. Alternatively, the loops could cross-slip with pinch off occurring at the cross-slip point to release one loop from the particle and leave another tethered to it. The tethered loop may expand again under the influence of an applied load allowing the process to repeat or it could collapse onto the particle–matrix interface and be accommodated on the interface. Both release of loops from particle–matrix interfaces and collapse of half loops onto the interface have been observed during in situ TEM straining experiments.
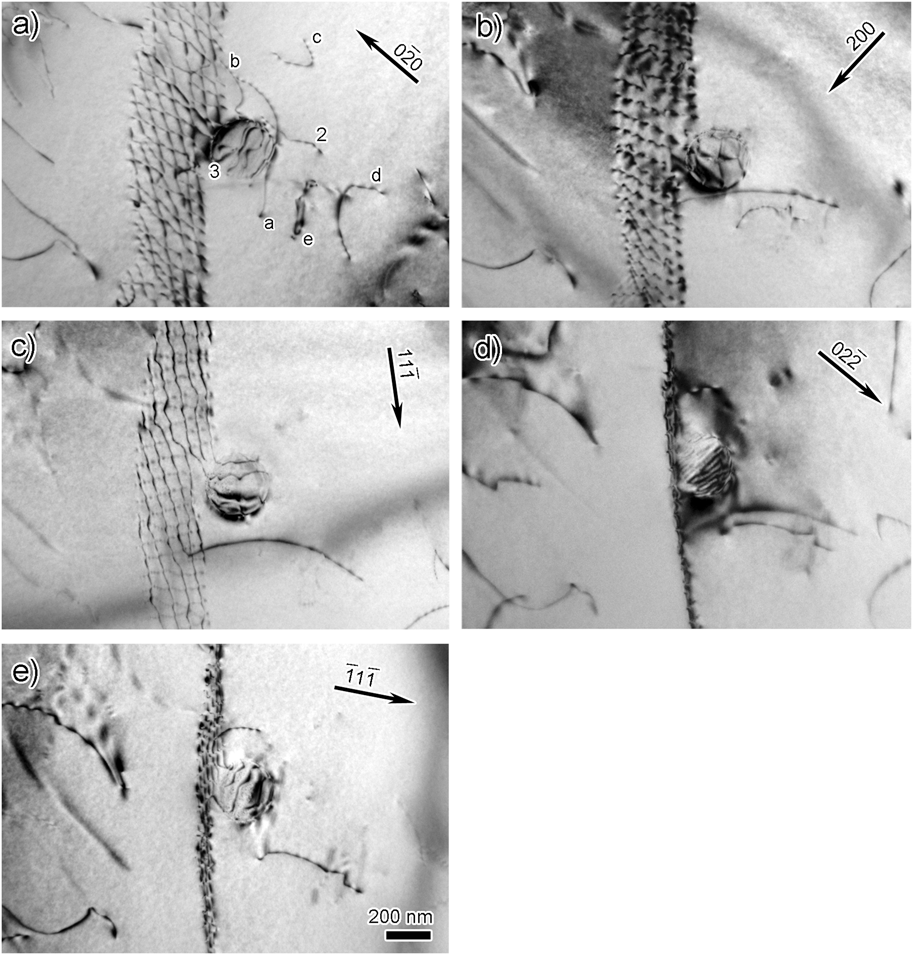
The previous example emphasized the interaction of individual dislocations with particles. However, interactions occurring between particles and sub-grain and grain boundaries are important in processes such as static and dynamic recrystallization, grain growth, superplasticity, etc. In situ TEM straining experiments at elevated temperatures show that the interaction between an array of dislocations and a large particle, one with interfacial dislocations, can involve the interaction of the array dislocations with interfacial ones.Reference Clark, Robertson, Dougherty, Ahn and Sofronis2, Reference Dougherty, Robertson and Vetrano3, Reference Dougherty7 Such interactions decreased the mobility of the array dislocations by about 30%, which was less than expected, and the array reformed after the interaction. The bright-field images taken with different diffraction vectors and presented in Fig. 5 show the later stages of an interaction of a twist-boundary with an Al3Sc particle. Some dislocations from the array remain connected to the particle and dislocation lines and loops reside in the vicinity of it. This tethering of the boundary to the particle after an interaction is common.Reference Clark, Robertson, Dougherty, Ahn and Sofronis2, Reference Dougherty7 From these images, the Burgers vector of the dislocations can be determined. The screw dislocations forming the boundary have Burgers vectors of either b =  or b =
 , and dislocations with b = ±a / 2[010] form at the intersection nodes of the two screw dislocations.
Bright-field images taken with different diffraction vectors showing the dislocation arrangement of a twist boundary interacting with a Al3Sc particle. The same dislocations as those shown in the reconstruction, Figs. 6(c)–6(e), are labeled for comparison.

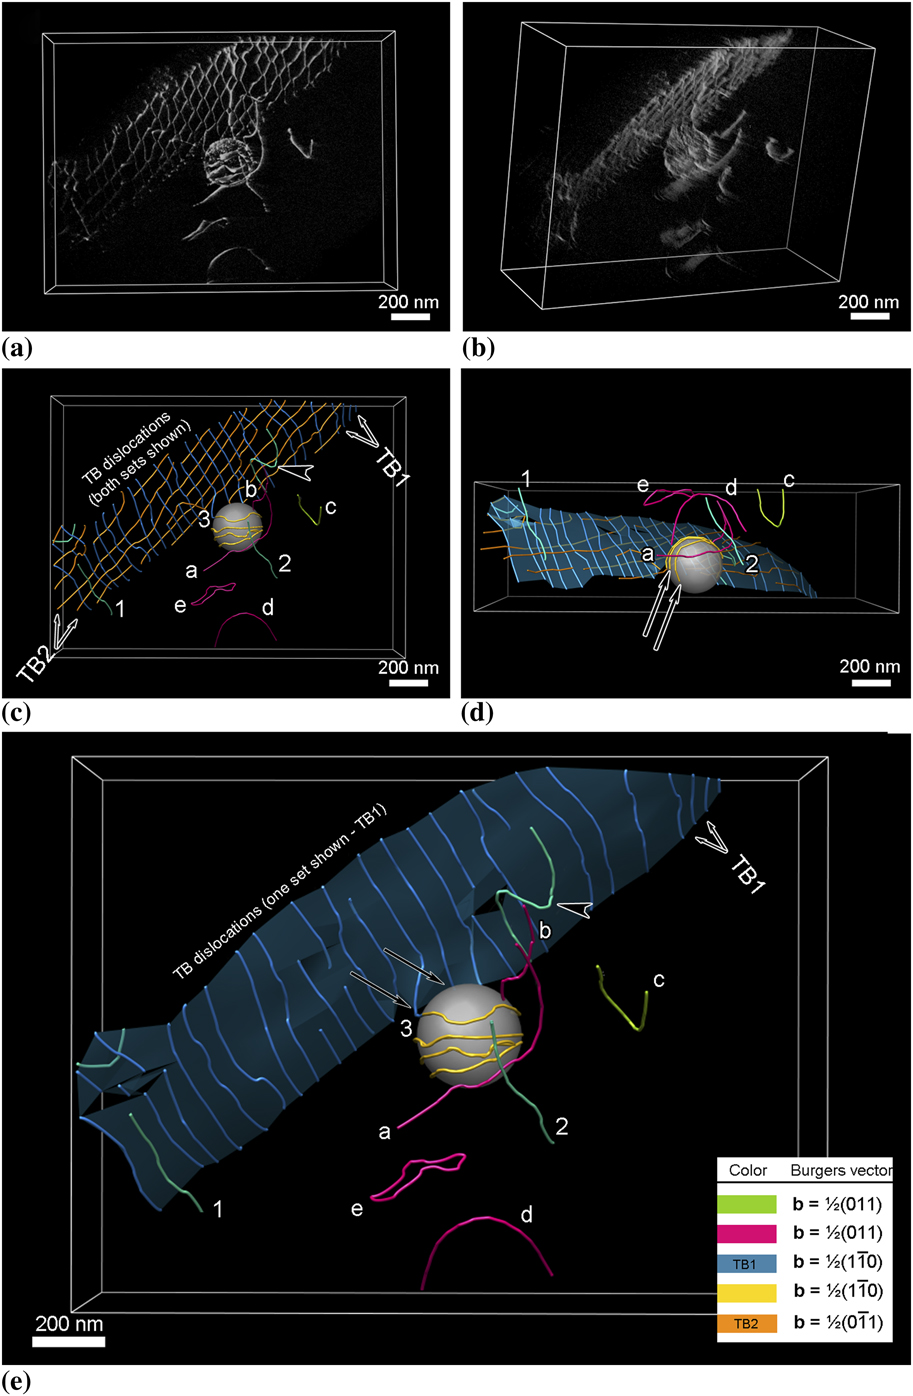
To show the dislocation arrangement, a weak-beam dark-field series of images was acquired over the angular range from −21.3° to +37.3° with the diffraction condition maintained with g = 020 and sg = 6.7 × 10⁻³ Å−1. These images were aligned into a stack, and supplemental movie file 2 shows a fly-through of this tilt-series. Using the same method for alignment and reconstruction, a tomogram and a 3D model were constructed and select images from different vantage points from both are shown in Fig. 6; in the case of the traced images, the junction reaction in the boundary plane was ignored for simplicity.
Spatial relationship between the twist boundary, the dislocations, and the particle. (a) and (b) Views from different directions extracted from the tomographic reconstruction. (c)–(e) Views from different directions extracted from the 3D model. In (c), both sets of dislocations in the twist boundary are shown, whereas in (e) one set is removed for clarity and shown with an overlay of the boundary. The “side view” shown in (d) is equivalent to a viewing direction perpendicular to the electron beam, which is normally inaccessible. The arrows indicate dislocations residing in the particle–matrix interface.

The first noticeable feature is that not all the dislocations that appear in the conventional micrographs as being part of the twist boundary actually reside on the boundary plane despite having the same Burgers vector as one of the dislocation sets that form the boundary. For example, dislocations 1 and 2 in Fig. 6(e) have a Burgers vector of b =  , which is the same as the twist boundary dislocations labeled TB1 and colored blue. Certainly, dislocation 1 appears in the conventional electron micrographs to be an integral dislocation of the twist boundary—but from the tomogram it is clear that this is merely a projection effect. Additionally, the dislocation indicated by the arrowhead in Figs. 6c and 6e is part of the dislocation array but remains bowed out from the array plane, indicating that this particular dislocation may have interacted with the particle and has yet to realign with the other dislocations. Alternatively, it is possible, although not verified in this case, that this dislocation is in the process of detaching from the array. This ejection of dislocations from the twist boundary may explain the origin of dislocations 1 and 2, which may indicate the instability of this boundary after it has interacted with the particle.
One boundary dislocation, 3, appears to remain attached to the particle and to have formed a partial loop around the particle, before appearing to terminate on the particle–matrix interface. However, as the angular tilt range was not sufficient to “see” behind the particle, the actual termination point of this dislocation could not be determined unequivocally. Dislocation lines a and b, partial loops c and d, and full loop e have a Burgers vector of b = ±a / 2[011] and reside on different planes. Line dislocation b extends from the particle surface to the free surface, whereas dislocation a extends through the foil and interacts with the particle as evidenced by its curvature. Partial loops c and d reside on the α-plane, although there is some distortion as the free surface is approached; such distortions are expected from consideration of surface image force effects on line dislocations. It should be noted that as the tomogram is formed with only one excited reflection, 020 in this instance, dislocations with a Burgers vector of either b =  or b = ±a / 2[101] are invisible and this can lead to misinterpretation of tomographic images in a similar manner as it would in conventional micrographs. For example, the complete loop e appears to lie on two different planes, the lower portion resides on the β-plane but the upper portion does not coincide with an allowed plane. From bright-field images formed with different diffraction vectors, two additional dislocations, one with a Burgers vector of b = ±a / 2[101] and the other with b =
 , intersect the loop at the two locations at which it is kinked. These interactions yield segments with Burgers vectors of b =
 and b = ±a / 2[110], respectively. These reactions are consistent with the Burgers vector analysis using the images presented in Fig. 5. These interactions account for the observed form of this dislocation loop. Thus, it is possible to specify in detail the configuration of the dislocations interacting with and in the vicinity of the particle.
IV. CONCLUSIONS
Pseudo weak-beam dark-field images acquired over a large angular range have been used to reconstruct tomograms that enable viewing of dislocation structures from any vantage point. In addition, 3D models of the dislocation distribution have been produced by tracing the dislocation structures in the tomogram, with particular attention paid to ensuring that the traced lines are correct in three dimensions. Coupling these visualization tools with conventional analysis of dislocations provides the ability to fully characterize the structure in terms of Burgers vector, line direction, slip plane, and the 3D spatial distribution. Furthermore, a strategy for incorporating the tomogram and the 3D model in a Thompson’s tetrahedron makes it possible to visualize the slip planes and systems as well as determine unique directions within the model. The functionality of this combined approach to dislocation analysis has been demonstrated by means of examples of dislocations and a twist boundary interacting with Al3Sc particles in an Al–Mg–Sc alloy. It is suggested that this analysis strategy can be combined with time-resolved straining experiments in situ in the TEM to provide a powerful tool for discovering the mechanisms that control the mechanical properties in particle-strengthened systems.
ACKNOWLEDGMENTS
The electron microscopy was performed at the Center for Microanalysis of Materials in the Frederick Seitz Materials Research Laboratory, University of Illinois. EM3D was developed by the McMahan Lab, Stanford University School of Medicine, and Chimera by the Resource for Biocomputing, Visualization, and Informatics at the University of California, San Francisco. G.S. Liu is grateful to Mr. Thomas Goddard at UCSF for fruitful discussions and correspondence and Dr. Martha Briceno for provision of gold foils. This work was supported by the U.S. Department of Energy, Office of Basic Energy Sciences under contract DE-FG02-07ER46443.