Bovine mastitis is the most costly disease in the dairy industry and exists, to varying degrees, in every herd. Recent research conducted by DairyNZ shows that mastitis costs the New Zealand dairy industry $180 million annually (Malcolm, Reference Malcolm2006). Early detection of mastitis is important to minimize economic loss and to safeguard the welfare of the herd because it allows prompt treatment leading to a higher rate of recovery (Milner et al. Reference Milner, Page and Hillerton1997), reduces the risk of spread of infection and helps prevent the development of chronic infections.
The presence of mastitis can be detected in-line by detection models embedded in automatic milking systems (AMS). These advanced milking systems use electronic sensors and management information systems to assist the herdsman in monitoring and detecting mastitis incidence in the herd. While AMS are not common in New Zealand, they are a useful research tool for developing mastitis detection systems.
Mastitis detection systems based on electrical conductivity (EC), which reflects changes in the blood-milk barrier due to bacteria entering the udder, have been in use for many years (Milner et al. Reference Milner, Page, Walton and Hillerton1996). However, the value of EC as a method for monitoring mastitis has been debated because although changes in EC reflect changes in the udder due to infection, EC is also easily influenced by a number of factors unrelated to infection status, including food and water intake (Mein et al. Reference Mein, Sherlock and Claycomb2004; Grennstam, Reference Grennstam2005). In a previous study, a thorough investigation of raw EC quarter readings clearly demonstrated that not all infected quarters have the highest EC and the lowest milk yield (QY) in an udder (Sun, Reference Sun2008). Similar observations were made by Grennstam (Reference Grennstam2005) who developed an EC-based mastitis detection model for AMS, with specificity and sensitivity of 77% and 53%, respectively. The model assumes that a quarter is mastitic at milking if EC is more than 15% higher than the average of the two quarters with the lowest EC. Other researchers have reported 65% and 75% specificity and sensitivity, respectively, using EC alone (Batra & McAllister, Reference Batra and McAllister1984; Lansbergen et al. Reference Lansbergen, Nielen, Lam, Pmngov, Schukken and Maatje1994). Later studies have shown that the inter quarter ratio (IQR), which is the relative deviation of quarter EC from the lowest EC quarter of a cow, has provided much improved results compared with those from EC alone, reaching an accuracy of 81% for clinical and 45% for subclinical quarters (Norberg et al. Reference Norberg, Hogeveen, Korsgaard, Friggens, Sloth and Lovendahl2004).
Since other milk parameters such as QY can be measured automatically during milking, it would be desirable to test whether this information could improve predictability when incorporated into the models. Change in milk production has been reported to be a significant factor associated with the presence of clinical mastitis (CM) and computational detection of mastitis (Nielen et al. Reference Nielen, Schukken, Brand, Haring and Ferwerdavanzonneveld1995b; Yang et al. Reference Yang, Lacroix and Wade1999; Heald et al. Reference Heald, Kim, Sischo, Cooper and Wolfgang2000; Wang & Samarasinghe, Reference Wang and Samarasinghe2005).
Furthermore, as early detection is crucial for effective management of herds, the identification of cows with subclinical, as well as clinical mastitis, is very important. Investigating the health of cows several days before and after the date they have been diagnosed with mastitis could shed light on subclinical mastitis (SCM) states. Bramley et al. (Reference Bramley, Dodd, Mein and Bramley1992) report that during the infection period, there is a 15·3±2·5% reduction in milk yield of the clinical quarter. Capturing this information in computational models can help detect the stage of progression of the disease. This is important because the ability to detect mastitis early depends strongly on the length of the period leading up to an infection becoming established.
In this study, mastitis detection models based on artificial neural networks (ANN) were developed incorporating EC and QY. ANNs are well-suited for detecting and exploring mastitis as cows with mastitis have different milk trait patterns, such as higher EC and lower QY than healthy cows (Aoki et al. Reference Aoki, Notsuki and Ichikawa1992; Lake et al. Reference Lake, Hillerton, Ambler and Wheeler1992). An ANN consists of computational neurons that process data and learn to recognize linear and nonlinear patterns through iterative learning that minimizes an error criterion, such as means square error. Two well-known ANNs are multi-layer perceptron (MLP) and self-organizing maps (SOM). MLP is a regressor that nonlinearly relates inputs to output(s) through processing in the hidden layer of nonlinear neurons, and is useful for detecting whether a quarter is infected or healthy. In order to identify the stage of infection, SOM is proposed. SOM is an unsupervised neural network that does not require an output but finds clusters solely based on inputs. It projects quarter readings onto a map of neurons while preserving the proximity of the health state of quarters, thereby revealing the whole mastitis spectrum. Additionally, SOM reveals whether quarters naturally form clusters representing distinct health states. Thus, SOM is suitable for capturing the mastitis spectrum and assessing the stage of progression and specific health state of a quarter within the spectrum.
The objectives of this study were to develop: (1) an accurate mastitis detection model using MLP network based on EC and QY; and (2) an SOM to capture the mastitis spectrum and detect the stage of progression of mastitis in a quarter within the mastitis spectrum.
Materials and Methods
Data and variables
Data for this research were generated from a DairyNZ research herd (Hamilton, New Zealand). Cows of mixed breed (80% Holstein Friesian, remainder Jersey and Jersey-Holstein Friesian crossbred) were managed as described by Jago et al. (Reference Jago, Bright, Copeman, Davis, Jackson, Ohnstad, Wieliczko and Woolford2004) and Kamphuis et al. (Reference Kamphuis, Sherlock, Jago, Mein and Hogeveen2008). Cows calved seasonally, were kept outside all year and fed a mainly pasture-based diet (approximately 0·5 kg concentrate per cow per day). Cows were milked on average 1·3-times a day by two Merlin AMS (Fullwood Ltd., Ellsmere, UK). The average milk production for the complete 2006/07 milking season was 3700 kg/cow, with an average bulk tank somatic cell count (SCC) of 189×103 cells/ml.
The dataset contained treatment and milking data. Treatment data consisted of quarters that were treated with antibiotics and included cow identification (cowID), time of treatment, infected quarter, cow-level SCC measured approximately every 2–3 weeks and pathogen type. Cows and quarters suspected to have CM were identified using multiple indicators as described in Kamphuis et al. (Reference Kamphuis, Sherlock, Jago, Mein and Hogeveen2008). These included data at the herd level (e.g. clots on the filter sock, raised bulk tank SCC, which caused the staff to search for clinical quarters) and at the cow level [e.g. mastitis attention lists generated by the AMS software, results of bacteriological culturing collected at calving, at dry-off and at suspicion of CM, a high in-line SCC result (Cellsense®) and results of regular SCC monitoring]. Clinical mastitis was determined by trained farm staff by visually checking the milk from suspected quarters and was confirmed if quarters showed clear signs of wateriness or clots or other clear signs of CM such as udder swollenness or redness. If confirmed these quarters were sampled for bacteriological analysis and treated with antibiotic. Some quarters were treated more than once. The pathogen types isolated from bacteriological analysis of clinical quarter fore-milk samples were Streptococcus uberis, Escherichia coli, Staphylococcus aureus, coagulase-negative staphylococci and other organisms. The most common pathogen isolated was Str. uberis. Composite udder SCC data were obtained from milk samples analysed using the Fossomatic technique (FSCC) (CombiFoss 5000, FOSS Electric, Hillerød, Denmark) as described in Kamphuis et al. (Reference Kamphuis, Sherlock, Jago, Mein and Hogeveen2008).
The milking data included measurements taken by the AMS up to 3-times a day for each quarter of each cow during each milking. It contained 48 546 records (samples) from 194 cows for the period July 2006 to early April 2007. The variables in this data file were QY, EC, cowID and time of milking. EC was the peak EC recorded by the AMS during each milking of a quarter. To account for within and between cow variation and erroneous readings due to occasional machine malfunction, the milk variables were transformed into three new variables for each quarter. These were running mean of normalized quarter-yield fraction (nyfRM); running mean of normalized electrical conductivity (necRM); and fractional deviation from the smallest necRM value (necFD) as explained below:
Running mean of normalized milk parameters of QY (nyfRM); EC (necRM); and fractional deviation of EC (necFD):
A cow and herd normalized running mean was calculated as the ratio of the running mean of a milk parameter for a particular quarter (left back, right front etc.) of a cow to the running mean of the same parameter for that quarter for the herd. For example, running mean of QYF (QYF is the ratio of milk yield of a quarter in a milking to the total milk yield from all four quarters in that milking) was:

where χ′t is the running mean of QYF at time t, χt is the measured QYF at time t, χt−1 is the measured QYF at time t−1 and a is a coefficient that represents ‘running mean length’. For the herd-level running mean, a value of 50 was assigned to a. With a herd size of 194 cows, these last 50 milkings were invariably of 50 different cows. The cow-level running mean was calculated for individual quarters over their own history of milking with a being equal to the last 5 milkings. The nyfRM for a quarter was the ratio of cow-level running mean to herd-level running mean.
The running mean of normalized EC (necRM) was calculated from EC using the same procedure as that for the nyfRM. The only difference was that instead of QYF in equation 1, χ refers to the measured peak EC of a quarter in a milking. The fractional deviation EC (necFD) is the relative deviation of necRM of each quarter of a cow at each milking with respect to the lowest necRM among four quarters as shown below:

where necFD i is necFD of any of the four quarters of a cow, necRM i is normalized EC running mean of the same quarter, and necRM min is the smallest value of necRM between four quarters. Since not all four quarters are usually infected at a given time, necFDi can effectively reveal infected quarters of a cow.
Selecting mastitic and healthy quarters for model development
The health state of each quarter was assessed on the basis of necRM, necFD, nyfRM and information in the treatment data. According to the treatment data, 88 quarters (including repeat treatments) from 43 cows that received antibiotic treatment were recognized as clinically mastitic. Then, two thresholds based on EC and QY were applied to these CM quarters to ensure that infected quarter readings at various stages of progression of mastitis were identified in the dataset. Specifically, all quarter milking data from the CM quarters, before or after the date antibiotic treatment was given, were considered mastitic if they had a 12·8% drop in milk yield and 15% higher EC than the average of the two quarters with the lowest EC and were from cows whose SCC value (per cow) exceeded 150 000 cells/ml. Since the exact health status before or after the date of diagnosis was not known, these data can contain both CM and SCM quarter readings. These were combined with the originally detected CM cases into a dataset of ‘infected’ quarters. Healthy quarters were identified as follows: the weekly SCC value per cow was below 150 000 cells/ml and the quarter was not treated for CM. Based on these criteria, 895 infected (CM or SCM) and 3235 healthy quarter milkings (total of 4130) were found in the milking data. The ratio of healthy to infected samples approximated 3·6:1.
Data analysis
Scatter plots and Pearson's correlation coefficient were employed (SPSS, 2007) to assess trends and relationships in the data that would aid and simplify the subsequent model development.
Model development: multilayer perceptron (MLP) networks:
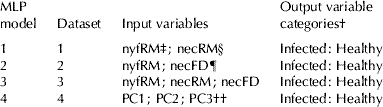
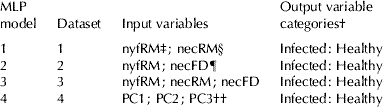
Four data sets were generated according to combinations of input variables (Table 1). Datasets 1, 2 and 3 were used to explore whether or not multi-collinearity had any effect on model performance. A fourth, new dataset, with three PC variables was generated using PC analysis (PCA) (SPSS, 2007) so that the performance of non-PC and PC-based models could be evaluated in terms of prediction accuracy. The best model was retained. These models predicted whether a quarter was healthy or infected.
Datasets with different input variables for multilayer perceptron (MLP) neural networks
† Infected or healthy
‡ Running mean of normalized quarter-yield fraction
§ Running mean of normalized electrical conductivity
¶ Fractional deviation from the smallest necRM
†† PC1, PC2 and PC3 are first, second and third principal component, respectively
A three-layer MLP was used for developing prediction models. Each dataset in Table 1 was randomly divided into training (70%) and validation subsets (30%). All modelling was performed on SYNAPSE software (2007). A genetic algorithm optimizer was used to automatically search for optimum model parameters (e.g. numbers of hidden neurons, learning parameters etc.). The performance accuracy was evaluated by the sensitivity, specificity and overall correct classification rate (CCR) on the validation set.
Model development: self-organizing maps (SOM):
For SOM models, the dataset 3 with three inputs of necRM, necFD and nyfRM (Table 1) was used but the output variable was not used. A 15×15 SOM (225 neurons) was trained and the SOM results were evaluated using k-means clustering, ANOVA and least significant difference (SPSS, 2007).
Results
Correlation between milk parameters and infection status
There was a strong positive (P<0·05) correlation (r=0·869) between necRM and necFD, whereas nyfRM was negatively correlated (P<0·05) with both necRM and necFD (r=−0·369 and −0·371, respectively). Furthermore, the necRM and necFD had a positive relationship (P<0·05) with mastitis status (r=0·58 and 0·531, respectively), whereas nyfRM had a smaller negative relationship (P<0·05) with mastitis status (r=−0·438).
Mastitis prediction results from MLP
The performance of the PC-based model in terms of classifying the validation data set was superior (CCR=90·74%) than non-PC-based models (Table 2). The sensitivity of the model for correctly detecting infected cases was higher than other non-PC-based models. Although the specificity of model 1 was slightly higher than that of the PC-based model, its overall CCR and sensitivity were poorer. For non-PC-based models, models 1 and 2 showed similar performance in overall CCR (89%); however, their specificity and sensitivity differed. Model 2 with EC deviation (necFD) was slightly superior in detecting infected cows. Model 3 had the lowest CCR and sensitivity of 87·21% and 78·93%, respectively.
Prediction accuracy of the best multilayer perceptron (MLP) models for the four sets of inputs

† Mean square error
‡ Overall correct classification rate
§ Running mean of normalized quarter-yield fraction
†† Running mean of normalized electrical conductivity
‡‡ Fractional deviation from the smallest necRM
PC1, PC2 and PC3 are first, second and third principal component, respectively
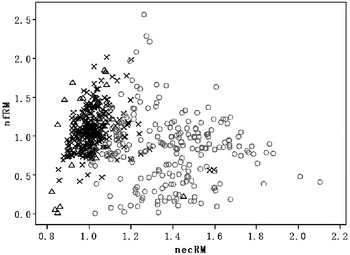
In Fig. 1, the misclassified infected cases from model 3 were superimposed on its validation data for necRM and nyfRM. It revealed that the misclassified infected quarters were closer to, or within, the healthy region and that the most misclassified infected cases are those that have neither high necRM nor low nyfRM.
Relation of misclassified infected cases to healthy and infected cases for the validation data set. Crosses represent healthy cases; circles represent infected cases; triangles represent infected cases that were wrongly detected as healthy cases.

Assessing stage of progression of mastitis in a quarter in the mastitis spectrum
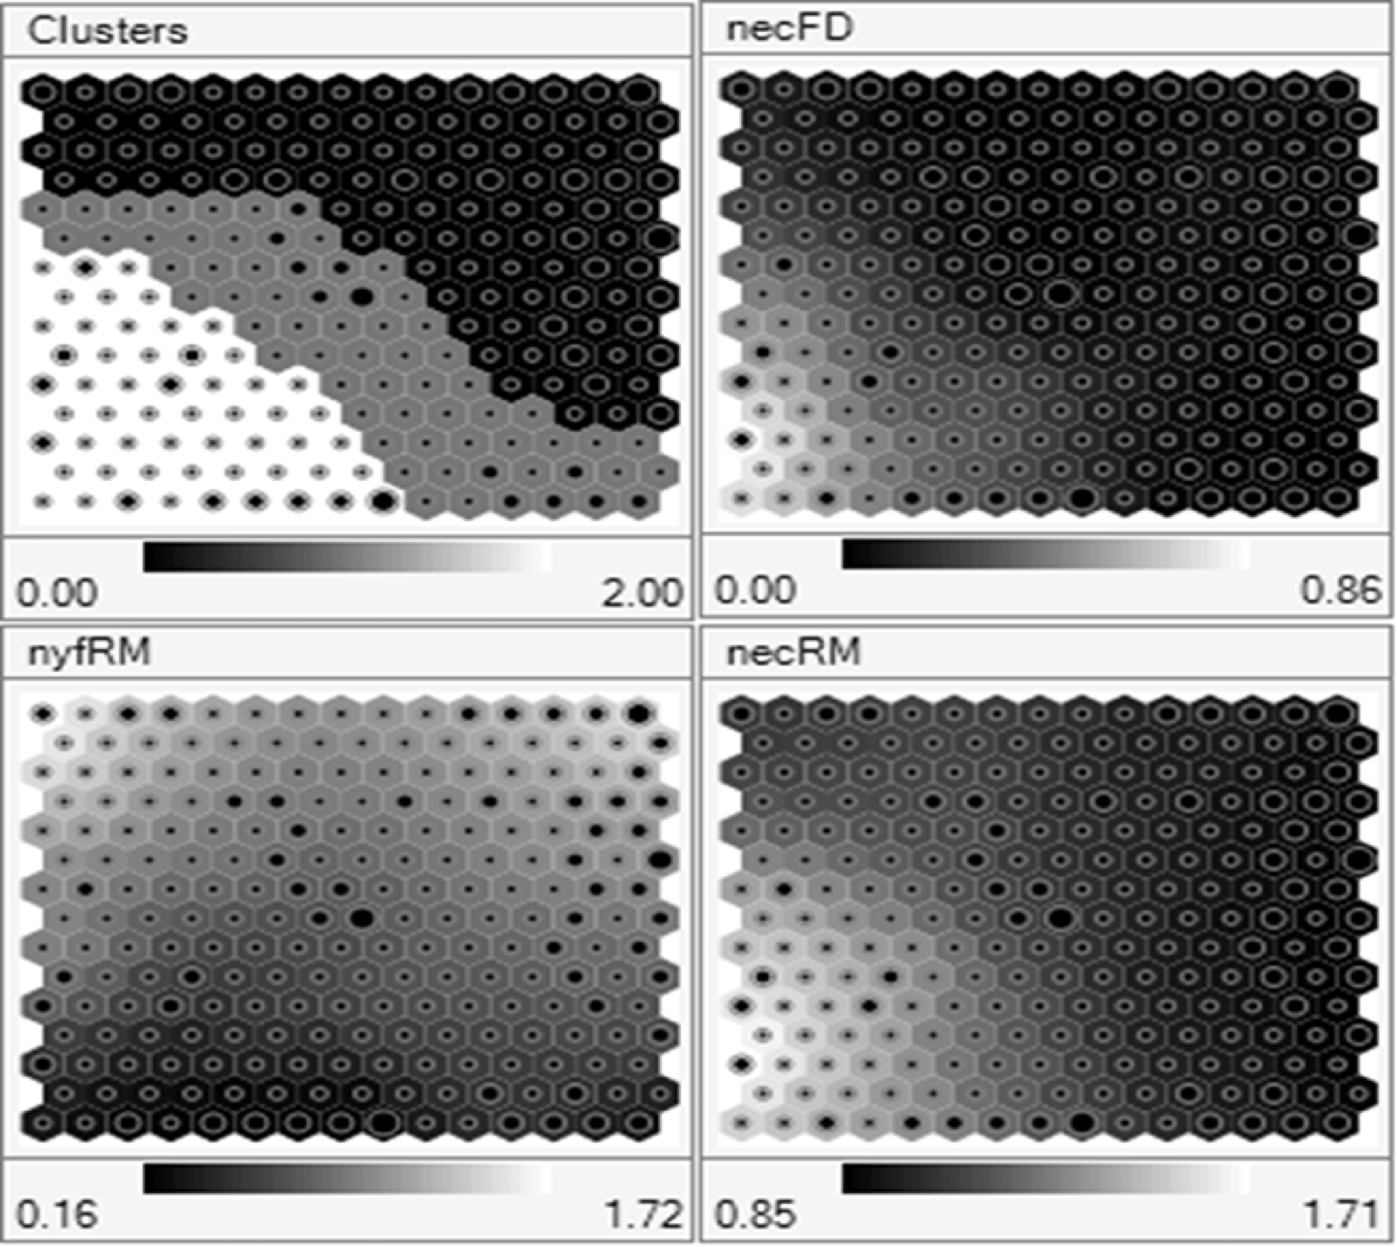
The SOM displayed the mastitis spectrum and revealed three distinct quarter health states within it (top-left panel in Fig. 2). These were named: healthy, moderately ill and severely ill. Each hexagonal cell represents a neuron and the black dots inside the neurons indicate the number of quarters that fell in that neuron (or location) on the map. A larger dot indicates a larger number of quarters. The size and location of dots shed light on the distribution of quarters in the spectrum of the three health states. Accordingly, most of the healthy cows (dark area) were very healthy and a large proportion of the sick cows (light area) were very ill, and these two clusters were separated by a cluster populated with moderately ill quarters.
Mapping of 3-dimensional data onto a two-dimensional SOM. The top-left panel shows the health states in terms of three clusters (white, grey and black clusters represent severely ill, moderately ill and healthy states, respectively). The other three panels show the distribution of the three input variables (necFD, nyfRM, and necRM) on the map. The bar below each panel shows the range of values for each variable. necRM, running mean of normalized electrical conductivity; necFD, fractional deviation from the smallest necRM; nyfRM, running mean of normalized quarter-yield fraction.
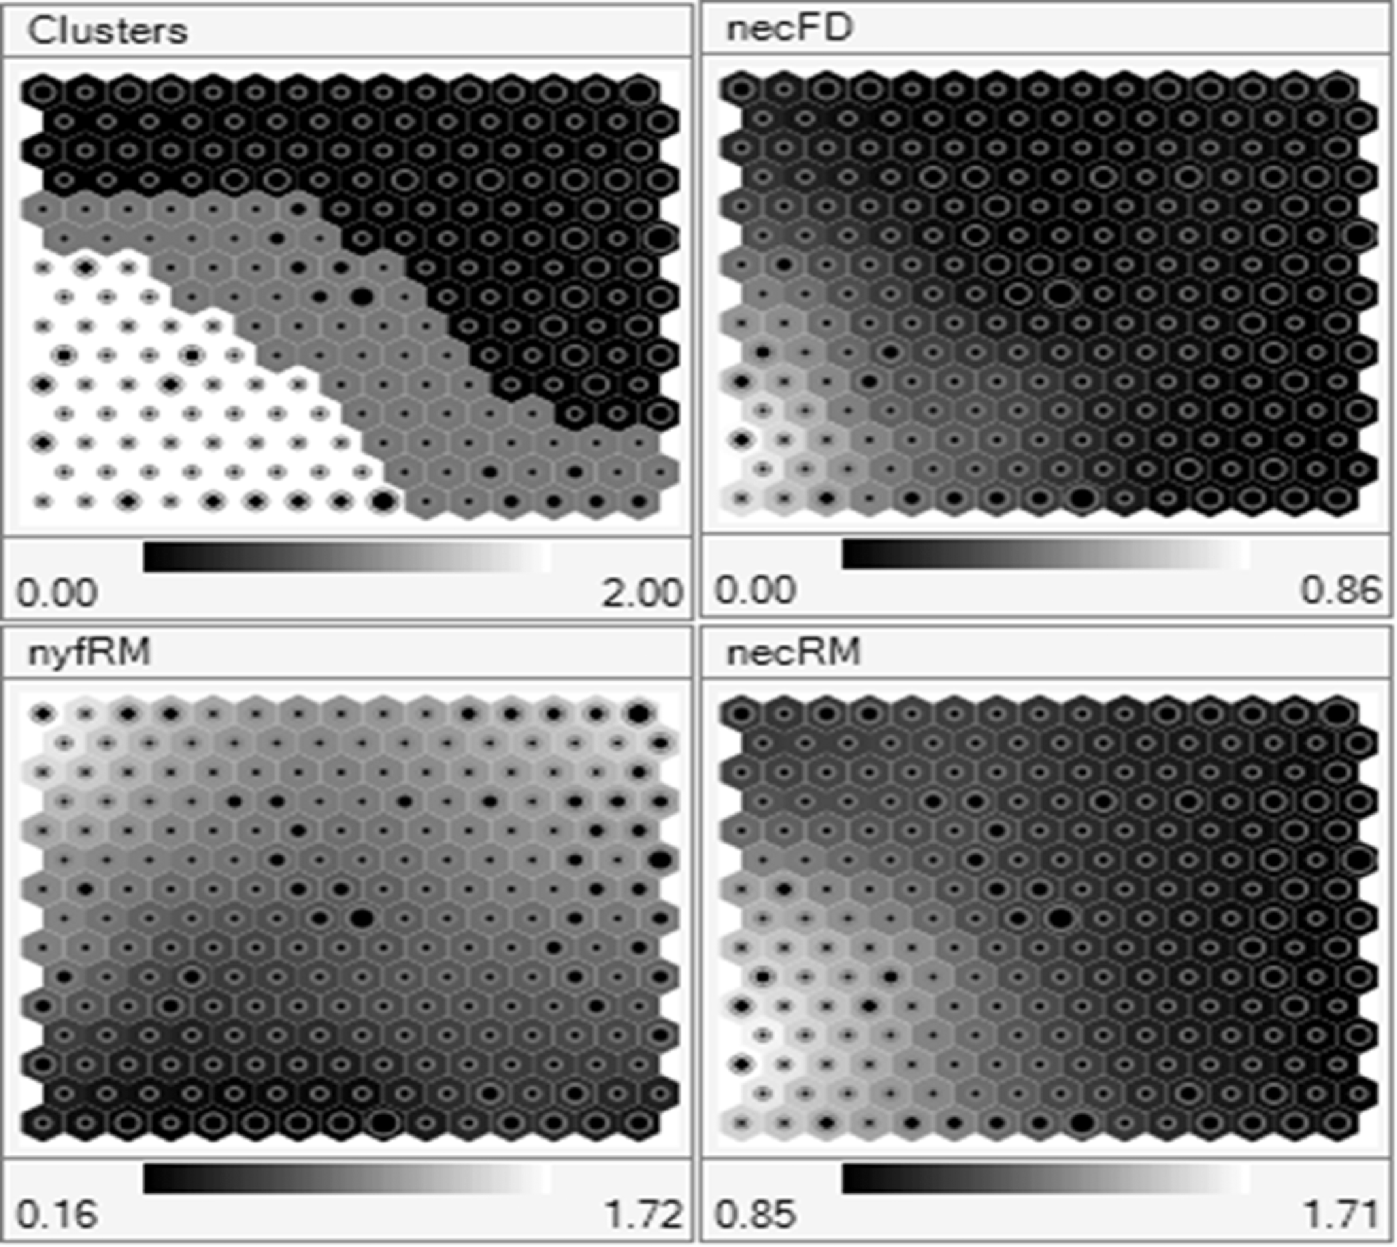
The distribution of individual input variables (necFD, nyfRM and necRM) in the location of the corresponding quarters on the map is shown in Fig. 2. In the case where a neuron represents more than one quarter, the average of the quarter readings for an input variable is displayed at the location of that neuron on the map. The lighter areas indicate higher values and the darker areas represent lower values.
A valuable feature of SOM is that the location of neurons on the panels representing individual input variables corresponds to the same neuron location on the cluster panel. Thus, following the location of a particular neuron, the cluster as well as the average value for the three variables for a quarter represented by that neuron can be easily determined. Accordingly, Fig. 2 revealed that necFD and necRM increased (i.e. the shade in Fig. 2 became lighter) as the health status of a quarter deteriorated gradually from healthy to severely ill. Also, as the health state deteriorated, the nyfRM decreased progressively from healthy and moderately ill to severely ill (from lighter to darker colour). Thus an infected quarter had higher than normal EC and produced less milk. The SOM detected this trend well.
As stated previously, EC (necFD and necRM) was more strongly correlated with health state than milk yield (nyfRM). PCA corroborated this evidence by demonstrating that the very first PC almost exclusively consisted of necFD and necRM, capturing the largest amount (70%) of variation in data. The SOM confirmed this by highlighting that the three health states (Fig. 2, cluster panel) were demarcated strongly according to the levels of necFD and necRM. Although the influence of nyfRM was overshadowed by necFD and necRM on the cluster panel, milk yield played a meaningful role as shown by the nyfRM panel in Fig. 2 and as explained previously. Owing to the high correlation between necFD and necRM, the panels representing necFD and necRM showed similar patterns of variation.
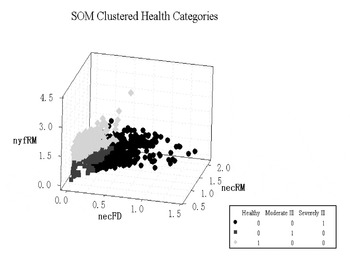
Figure 3 illustrates the structure of the spatially organised data in the SOM in 3-D format. It revealed meaningful cluster structures where healthy quarters (circles) had high yield (nyfRM) and severely ill quarters (triangle) had very high EC (necFD and necRM). The moderately ill (gray dots) cluster had in-between values for these variables.
SOM clustered three health categories (healthy, moderately ill, and severely ill) with respect to inputs (nyfRM, necFD and necRM) (empty circles indicate healthy, filled gray circles indicate moderately ill, and empty triangles indicate severely ill quarters). necRM, running mean of normalized electrical conductivity; necFD, fractional deviation from the smallest necRM; nyfRM, running mean of normalized quarter-yield fraction.

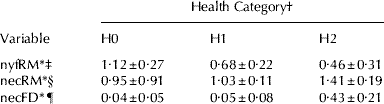
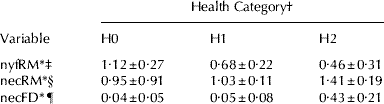
The mean of the three variables (necFD, nyfRM and necRM) were significantly different across the three clusters (P<0·05) (Table 3). Milk yield declined sharply as healthy quarters deteriorated into moderately ill and decreased much less dramatically from moderately ill to severely ill. In contrast, the two conductivity-related variables, showed a marked increase in the transition between moderately ill and severely ill states. Of these two variables, necFD showed the most marked increase. Correlation between the clusters obtained from SOM and k-means was 0·82 (P<0·01).
Mean and sd of the variables in each self-organizing map (SOM) based health category
* Means of all health categories differ (P<0·05)
† H0, H1 and H2 are healthy, moderately ill, and severely ill categories, respectively
‡ Running mean of normalized quarter-yield fraction
§ Running mean of normalized electrical conductivity
¶ Fractional deviation from the smallest necRM
Discussion
The PC-based MLP model achieved a detection accuracy of 91% specificity, 87% sensitivity and 91% CCR, across a dataset of 4130 quarter readings (895 infected and 3235 healthy). To put these results in perspective, Nielen et al. (Reference Nielen, Spigt, Schukken, Deluyker, Maatje and Brand1995a) developed an MLP with 100% specificity and 92% sensitivity but they used only 13 mastitic and 17 healthy quarters. It is possible that such a small dataset may not represent population characteristics of conditions induced by mastitis. Yang et al. (Reference Yang, Lacroix and Wade1999), Nielen et al. (Reference Nielen, Schukken, Brand, Haring and Ferwerdavanzonneveld1995b) and López-Benavides (Reference López-Benavides, Samarasinghe and Hickford2003) developed ANNs with EC and/or other variables including SCC, milk components and days in milk (DIM) with accuracies ranging from 67% to 80%. The above mentioned Nielen et al. (Reference Nielen, Schukken, Brand, Haring and Ferwerdavanzonneveld1995b) study compares three analysis techniques: PCA, linear logistic regression and MLP for in-line detection of mastitis. The variables included are QY, EC and milk temperature, and MLP has slightly higher sensitivity and specificity.
Recently, Wang & Samarasinghe (Reference Wang and Samarasinghe2005) developed a mastitis detection model for AMS using MLP based on cow- and herd-normalized quarter EC, QY and maximum relative EC deviation among four quarters. The sensitivity and specificity for MLP are 84% and 100%, respectively. Linear discriminant analysis (LDA) has only 81% sensitivity with 100% specificity. Their study has only 32 clinical cases based on monthly veterinary tests and 1026 healthy cases, and the large proportion of healthy to infected cases may have improved the specificity of their model. This is the study that comes closest to our study in terms of the variables used and results obtained. The main difference is that they have very few mastitis cases and they assume that an infected quarter has the highest EC and lowest QY in the udder; whereas, in our study, threshold were used for both EC and QY based on a thorough examination of raw quarter readings of a large number of cows, along with an additional threshold on cow-based SCC levels. This allowed for subclinical states to be present in the data. Heald et al. (Reference Heald, Kim, Sischo, Cooper and Wolfgang2000) used ANN and LDA to predict bacterial causes of mastitis using SCC, lactation number, DIM and several inputs related to herd management practices. Their sensitivity and specificity for 300 cows are 39% and 79%, respectively, with poorer results for LDA.
For all our models, specificity was higher than sensitivity. This could be due to the high proportion of healthy cases in the training data. Other researchers (Nielen et al. Reference Nielen, Schukken, Brand, Haring and Ferwerdavanzonneveld1995b; Yang et al. Reference Yang, Lacroix and Wade1999; Hassan et al. Reference Hassan, Samarasinghe and López-Benavides2009) state that high proportions of healthy cases increase the specificity of the predictions. The PC-based model not only provided the best performance (CCR=90·74%) but also had the least complex network structure (i.e. the smallest number of hidden neurons), providing the smallest validation mean square error among the four models (Table 2). Inferior results of model 3 and the improvement achieved by the PC-based model proved that multi-collinearity existed within the input variables and that PCA dealt with this to significantly improve the sensitivity.
In research, mastitis is commonly defined based on SCC and bacteriological analysis. Owing to the EC and QY thresholds used in this study, the proportion of infected cases was high leading to a relatively low error rate i.e. the model had gained more relevant knowledge about mastitis and in turn more accurately detected infected quarters. Typically, EC values vary from cow to cow and not all clinical quarters have very high EC or even have a reduced QY. For such cases, it is difficult or impossible for a model to detect them correctly as illustrated by the misclassified cases in Fig. 1.
The SOM model illustrated the mastitis spectrum in the data by preserving the proximity of the health state of quarters on the map. The statistically significant means of the variables across the three clusters indicated that the yield was quite sensitive to infection and was affected either early on in the disease or in a minor pathogen infection as also has been stated by Mein et al. (Reference Mein, Sherlock and Claycomb2004). The marked increase in necRM and necFD in the transition from moderately ill to severely ill cluster reflected the known biological evidence that EC increases as a result of breaking of blood-milk barrier at later stages of a major pathogen infection (Mein et al. Reference Mein, Sherlock and Claycomb2004). A similar observation on EC has been made by Hassan et al. (Reference Hassan, Samarasinghe and López-Benavides2009) with an SOM that clustered quarters based on milk parameters into no-infection, minor- and major- pathogen infections. They show that an increase in EC is statistically significant for major pathogen infections but not for minor pathogen infections.
Thus, statistical significance of the three health clusters declared by SOM and the trends in the changes in conductivity and milk yield across the clusters indicated the high likelihood that they corresponded to healthy, SCM and CM. The strong agreement with k-means clustering provided further validity to the three SOM clusters. The k-means is a simpler linear version of SOM but without the proximity preserving quality of SOM. These two aspects: ability to handle nonlinear cluster boundaries and preserving proximity of the clusters, give SOM an added advantage over k-means (Samarasinghe, Reference Samarasinghe2006).
In conclusion, the best MLP model developed in this study has a higher rate of detection of mastitis than the previously reported models for AMS. Furthermore, the SOM model could be used to identify the stage of progression of mastitis in a quarter by identifying the health cluster it belongs to as well as its location within the cluster (i.e. how close or distant this location is from the surrounding clusters on the map) so that further testing and treatment can be considered before the clinical symptoms are manifest. Therefore, the models could be used as decision aids in detection and management of mastitis in a herd. This study highlighted the strong likelihood that the three SOM clusters of healthy, moderately ill and severely ill quarters represented healthy, SCM and CM, respectively. Field validation of this would be advantageous. Additionally, our study used a limited number of mastitis indicators; therefore, in future research, more informative milk traits related to mastitis should be added so that the detection models could be improved further.
The authors thank Dr Robert Sherlock of SmartWorks Ltd. for valuable comments. The data were generated through a research project funded by DairyNZ and the Foundation for Research Science and Technology, New Zealand.