Introduction
Regionalized critical-care systems can provide a number of benefits to patients.Reference Singh and MacDonald 1 By concentrating medical resources and expertise in a small number of centers of excellence, care can be standardized and costs can be reduced. However, efficient transfer of patients among facilities within the system remains a large obstacle to effective patient care, especially for long-duration transfers.Reference Singh and MacDonald 1 For medical transport systems where dispatchers are responsible for planning these interfacility transfers, accurate estimates of transfer times play a crucial part in their medical triage and resource-allocation decisions. Previous research has shown that dispatchers and on-scene responders often underestimate the time required to transfer patients.Reference Giang, Donmez, Fatahi, Mahvareh and MacDonald 2 – Reference Propp and Rosenberg 4 Furthermore, accurate estimates of transfer times can impact a patient's prehospital management plan.Reference Propp and Rosenberg 4 Therefore, accurate models of interfacility transfer times and appropriate decision aids may play a large role in improving patient care in regionalized critical-care systems.
Rain, snow, and other types of precipitation may have a large impact on transfers by delaying the transfer or by making transfer conditions more hazardous. During interfacility transfers, patients are exposed to risks due to long out-of-hospital times, risks associated with transportation, and the lack of resources available to the patient at the sending facility if transfers cannot be completed.Reference Singh, MacDonald, Bronskill and Schull 5 – Reference Martin 7 Precipitation negatively impacts driving conditions and is associated with an increased number of traffic collisions and injuries,Reference Andrey, Mills, Leahy and Suggett 8 differences in free-flow speeds,Reference Do, Oh and Kim 9 , Reference Rakha, Farzaneh, Arafeh and Sterzin 10 and longer travel times.Reference Tsapakis, Cheng and Bolbol 11 However, there has been no research on the relationship between precipitation and land ambulance travel times for interfacility transfers. Emergency vehicle travel times are, in general, shorter than regular vehicle travel times as the use of sirens reduces travel times,Reference Fleischman, Lundquist, Jui, Newgard and Warden 12 and emergency vehicles have the right-of-way and are impacted less by traffic volume.Reference Kolesar, Walker and Hausner 13
The objective of this study was to examine the effects that different types of precipitation have on travel times of urgent and emergent interfacility land transfers. It was hypothesized that the effect would differ based on the type of precipitation (snow vs rain vs no precipitation), and that the effects of precipitation would accumulate as the transfer distance increased. In addition, inclement weather limits air transportation options, which are often used when transporting patients among different cities. Thus, the authors also explored possible differences that may have existed between intercity (transfers between cities) and intracity (transfers within a city) interfacility transfers, with a focus on examining the effects of precipitation within each of these transfer types.
Methods
Setting
Ontario is a large province in Canada, covering an area of roughly 1.1 million km2 (424,000 square miles). 14 It is also Canada's most populous province, with the majority of its population of 13 million concentrated in the south, 15 along the border with the United States (approximately 140,000 km2). Within the entire province of Ontario, a single medical transport system, Ornge, is responsible for the majority of the air and land critical-care interfacility transfers.
Study Population
A total of 4,591 interfacility transfers carried out by Ornge's land transfer units from 2005 through 2011 formed the study population. The study population excluded those transfers that were not urgent or emergent, or if a vehicle was dispatched but there was no patient carried. This study was approved by the University of Toronto's Research Ethics Board.
Transfer Factors
The data set contained information about the Global Positioning System (GPS) location of the sending and receiving facilities, the Ornge base which responded to the transfer, the time and date of the transfer, and the duration of the transfer between the two facilities. Based on these parameters, a number of secondary characteristics of the transfers were identified to analyze the effects of precipitation on travel time: driving distance, transfer being intercity versus intracity, and the type of precipitation encountered during the transfer.
Driving Distance
While specific route information was not available in the data set, driving distances between the sending and receiving facilities were estimated using an online mapping service (Bing Maps; Microsoft Corporation, Redmond, Washington USA) using the GPS locations of the two facilities for each transfer. 16 Routes created were optimized for driving time without the use of traffic congestion information.
Intercity Versus Intracity Transfers
Each transfer was categorized as being either an intercity or intracity transfer based on the city of the sending and the receiving facilities.
Type of Precipitation
Each transfer was linked to hourly weather information from Environment Canada's (Gatineau, Quebec, Canada) Historical Climate Data Set. Characteristics of weather other than precipitation, such as temperature, have been shown to have negligible or low associations with travel times and traffic volume,Reference Tsapakis, Cheng and Bolbol 11 , Reference Keay and Simmonds 17 thus the focus of this current study was on different precipitation types. The climate data set classified precipitation into three levels of intensity: light, moderate, and heavy. The different types of precipitation were further categorized into three major types: liquid precipitation (ie, rain), freezing precipitation (ie, freezing rain), and frozen precipitation (ie, snow). 18
Specific route information was not available, thus the following methodology was used to assign precipitation information to the rest of the transfer data. In general, precipitation type was queried for the sending location at the time of the transfer's departure and for the receiving location at the arrival time. When climate data were only available for one of these locations, the precipitation type recorded for that location was assigned to the transfer. When climate data were available for both locations and the type of precipitation was the same, this precipitation type was assigned to the transfer. Both the sending and the receiving facility locations were typically affected by the same weather system and had the same precipitation conditions. Transfers that were affected by different precipitation (excluding clear) were removed due to low sample size (three percent of transfers with precipitation data for both cities). Finally, if one of the cities was reported to have clear weather and the other one had precipitation, the entire transfer was labeled to have precipitation (four percent of transfers with precipitation data for both cities).
Data Analysis
The effects of precipitation type on travel time were investigated using linear modeling techniques and analysis of variance. Linear models were fit to interfacility land ambulance travel times with distance and precipitation type as regressors. The interaction between these two regressors was also included given that the delays experienced due to precipitation should accumulate as the distance travelled increases. Regression models containing only distance as a regressor were fitted to provide a baseline comparison. In addition, planned contrasts between different levels of precipitation were performed. Whether the transfer was intercity or intracity was not used as an explanatory factor; rather, the transfer data were broken into two subsets, and separate models were built for intercity and intracity transfers. The reason for this choice was the high level of correlation between this variable (ie, intercity vs intracity transfer) and distance, which would lead to issues of multi-collinearity.
Results
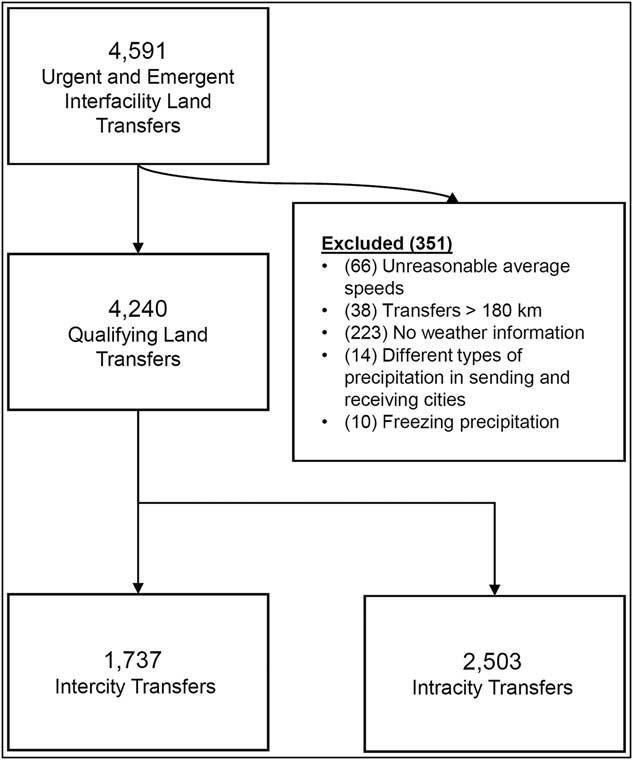
Transfers in the data set occurred among 82 medical facilities in the province of Ontario and over 583 different routes. The 4,591 transfers were reduced based on the accessibility of weather condition information from local weather stations and by filtering out interfacility transfers with unreasonable ambulance travel speeds and distances greater than 180 km (Figure 1). Ornge typically only uses ground transportation for transfers under 160 km, thus transfers for distances larger than 180 km are rare and are only made under extremely unique circumstances.
Study Data Set.

Characteristics of Intercity and Intracity Transfers
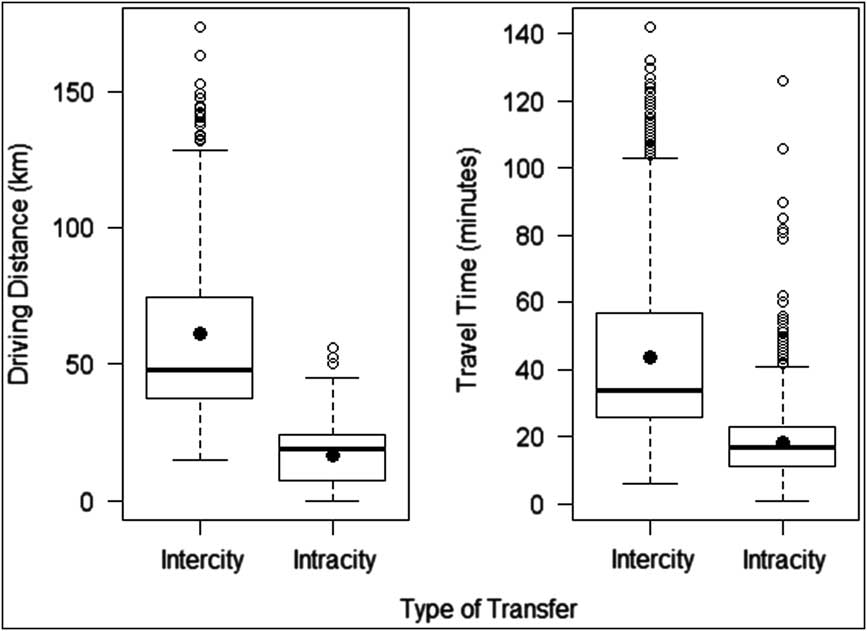
Intracity travel distances (mean = 16.8 km, 95% CI; 16.4-17.2) tended to be much shorter (P < .0001) than intercity travel (Figure 2; mean = 61.18 km, 95% CI; 59.5-62.8). Travel times for intracity transfers (mean = 18.2 minutes, 95% CI; 17.8-18.5) were also faster (P < .0001) than those for intercity transfers (mean = 43.6 minutes, 95% CI; 42.4-44.8).
Driving Distance and Travel Time vs Type of Transfer (the Box-plots Represent the Minimum, First Quartile, Median, Third Quartile, and Maximum, as well as Potential Outliers Indicated with Hollow Circles and Means Indicated with Solid Circles).

A qualitative examination of the estimated routes revealed that intercity transfers tended to contain travel along rural roads and freeways. In contrast, almost all of the intracity transfers (97%) occurred around Ontario's largest city, in the Greater Toronto Area, which had a wide variety of road types, such as freeways, local roads, collectors, and arterial roads. In comparison to freeway driving, urban roads have lower speed limits and more frequent stops. In fact, this was evident in the data set with the average speed of intercity transfers (86.0 km/h, 95% CI; 85.2-87.0) being significantly faster (P < .0001) than intracity transfers (54.6 km/h, 95% CI; 53.5-55.6). Even when transfers of comparable distances (< 30 km) were considered, intercity transfers (75.9 km/h, 95% CI; 73.2-78.7) had a higher average speed (P < .0001) compared to intracity transfers (52.5 km/h, 95% CI; 51.4-53.5).
Precipitation
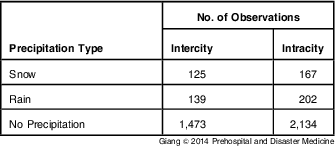
Only 10 transfers occurred during freezing precipitation conditions and were subsequently removed due to low sample size. No occurrences of other extreme weather phenomena, such as tornados, were found in the data set. Different intensities were also not examined as there were not enough samples within each intensity category. The large majority of the transfers occurred under conditions of no precipitation (Table 1).
Precipitation Types

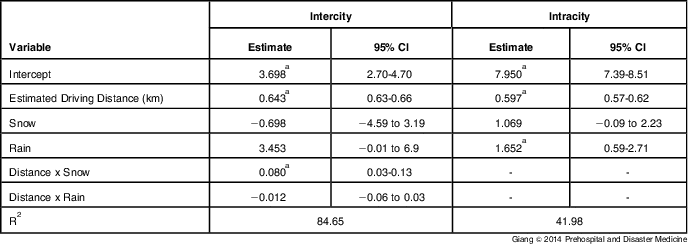
Intercity Transfers—The full model fit for intercity transfers (Table 2) explained a large amount of variability (R2 = 84.7%). In this model, Distance (P < .0001) and the Distance x Precipitation interaction (P = .004) were found to be significant, suggesting that precipitation does impact travel times for intercity transfers, and that there is an interaction with distance travelled. A restricted model with only an intercept and a distance term was also fitted and was found to explain a similar level of variability (R2 = 84.2%). Thus, the majority of variability in travel times was found to be due to distance.
Regression Models for Intercity and Intracity Transfers (the Dependent Variable is Travel Time in Minutes; No Precipitation is the Baseline Case)

a Denotes significant coefficients (P < .05).
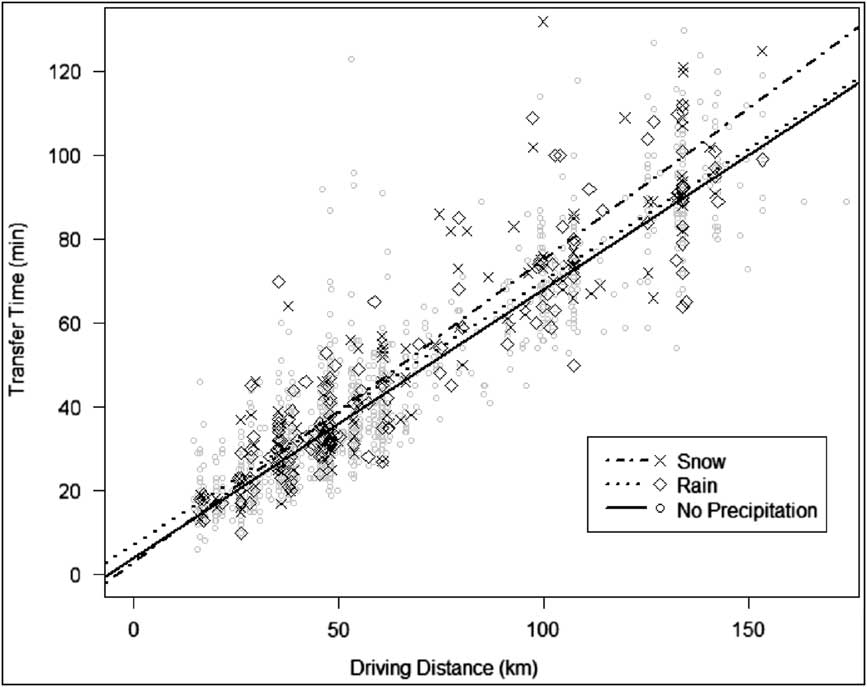
Figure 3 shows a scatter plot of the data as well as the fitted regression lines for each precipitation type. The comparison of slopes across different precipitation types revealed that only the slope for snow was found to be significantly different than the slope for no precipitation. Every 5 km increase in distance was associated with a 0.51 minute (95% CI; 0.24-0.78) average increase in travel time for snow compared to no precipitation. Furthermore, the slope for snow was significantly different than the slope for rain. A 5 km increase in driving distance was estimated to result in a 0.55 minute (95% CI; 0.21-0.89) average increase in travel time for snow compared to rain.
Regression Lines and Scatter Plot for Intercity Transfers.

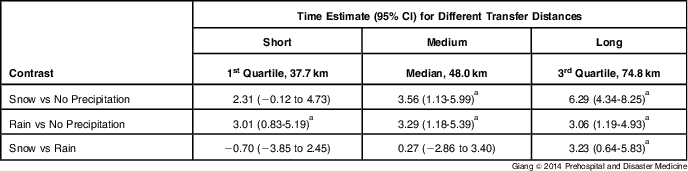
Further comparisons were conducted to examine varying distances of travel (Table 3). In particular, short, medium, and long distances were characterized by the first quartile (37.7 km), the median (48.0 km), and the third quartile (74.8 km), respectively. For short-distance transfers, rain resulted in a 3.01 minute average increase in travel time, a 10.8% increase from the average travel time of 27.9 minutes observed for no precipitation. For medium-distance transfers, average travel time for no precipitation was 34.5 minutes long. Similar to short transfers, rain resulted in a 2.9 minute average increase in travel time when compared to no precipitation, an 8.4% increase. In addition, snow also resulted in a 3.1 minute, or a 9.1%, average increase compared to no precipitation. Finally, at long distances (74.8 km), the average travel time under no precipitation was 51.8 minutes. Rain was again significantly different than no precipitation with a 2.6 minute, or a 5.0%, average increase. The effect of snow was the most pronounced for long-distance transfers, resulting in significantly longer travel times than both no precipitation (5.3 minutes, 10.2% average increase) and rain (2.7 minutes, 5.0% average increase).
Comparisons of Estimated Transfer Times between Different Precipitation Types for Intercity Transfers Calculated at Three Different Trip Distances (Time Estimates are in Minutes)

a Denotes significant contrasts (P < .05).
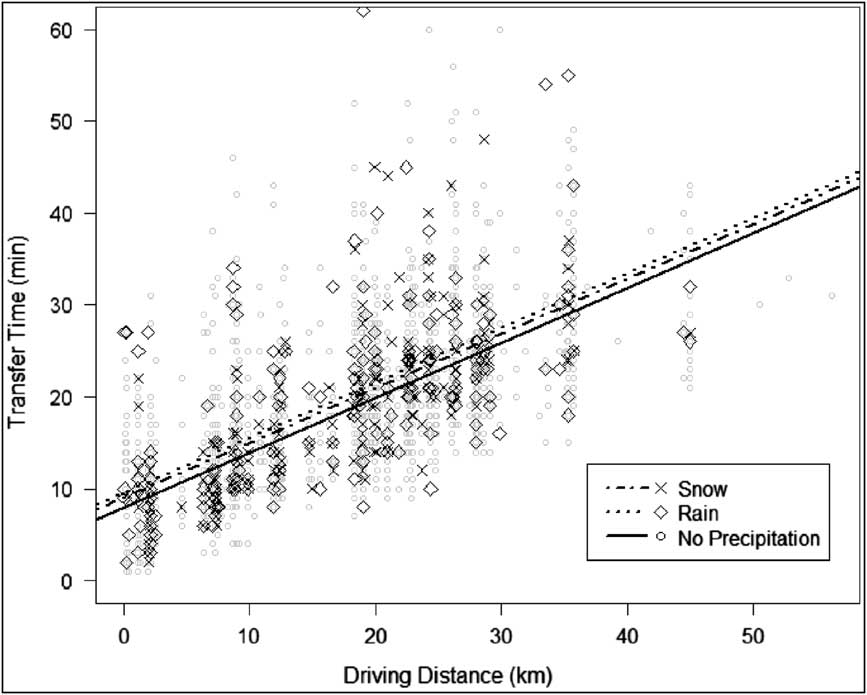
Intracity Transfers—Table 2 also shows the final regression equation for intracity transfers. The interaction effect was not significant (P = .40), thus it was not included in the final model. Unlike the model built for intercity transfers, the intracity model had a much lower R2 value (42.0%). Both the distance (P < .0001) and the precipitation (P = .003) factors were significant; however, distance, again, appeared to explain most of the variability (for the distance-only model, R2 was 41.7%). Figure 4 shows the scatter plot for the intracity transfer model. Rain increased travel time by 1.65 minutes, on average (95% CI; 0.59-2.71), compared to no precipitation, an 8.6% increase from the average travel time of 19.2 minutes observed for no precipitation. Snow was also marginally different from no precipitation with a nonsignificant average increase of 1.07 minutes (5.6%; 95% CI; -0.09 to 2.23; P = .07)
Regression Lines and Scatter Plot for Intracity Transfers.

Discussion
Precipitation Effects on Travel Times
Precipitation affected both transfer types. For intercity transfers, the magnitude of the delays increased as driving distance increased. For median-distance intercity transfers (48 km), snow produced delays of approximately 9.1% (3.1 minutes), while rain produced delays of 8.4% (2.9 minutes). For intracity transfers, the magnitude of delays attributed to precipitation did not depend on distance driven. Transfers in rain were 8.6% longer (1.7 minutes) compared to no precipitation, whereas only statistically marginal effects were observed for snow. These results may also be medically relevant. There exist a limited number of acute illnesses and injuries that require time-sensitive interventions available only in regional referral centers. In the setting of a limited number of conditions, a few minutes can have a significant impact on patient morbidity and mortality.
These results follow other studies on the effects of precipitation on traffic (eg, Tsapkis et alReference Tsapakis, Cheng and Bolbol 11 shows a review of changes in operating speeds from several studies). Tsapakis et alReference Tsapakis, Cheng and Bolbol 11 examined freeway travel in the metropolitan area surrounding London, UK, which has comparable distances to medium intercity distances in these data, and found reductions in speed of about 7.4%-11.4% for freeway travel under conditions of snowfall of more than 2.0 mm/hr. However, they found that rain was associated with only 1.3%-3.8% reductions in speed for intensities between 0.2-6.0 mm/hr, and 3.6%-6.0% reductions for intensities greater than 6.0 mm/hr. The findings from this study indicate that rain may have a stronger effect on medical transfers, specifically for interfacility transfers, than it does for other traffic; these delays may be attributed to patient transportation-related factors rather than factors such as operating speeds.
For intercity transfers where there was an interaction effect, it appeared that the delays associated with snow accumulated as the distance travelled increased, while rain was associated with an increase in travel times that was not dependent on the distance travelled. One possible explanation for the differences observed between rain and snow is that, unlike snow, which can have significant buildup on road surfaces, the effects of rain are more transient. Further, since it may not be raining over the entire duration of a trip, the effects of rain may not result in longer delays as distance increases. For intracity transfers, the effect of rain was more prominent compared to that of snow. Travel within a city typically relies on local, collector, and arterial roads instead of freeways. It is possible that rain plays a larger role in urban driving on nonfreeway roads. Other studies of precipitation on travel times have focused on freeway travel instead of travel on local roads, thus further investigation is required to see if this effect is present, in general, and whether it is unique to interfacility land ambulance travel.
Decision Support and Predicting Future Transfer Times
One of the key benefits of investigating the effects of precipitation on travel times is the use of these models in helping predict future interfacility transfers through decision aids. Furthermore, these models can be used in discrete event simulations to test different resource allocation and dispatch policies.Reference Lam, Zhang, Oh, Ng, Wah and Hock Ong 19 Fleischman et al built and validated a model of ambulance arrival times using historical data from Multnomah County, Oregon (USA).Reference Fleischman, Lundquist, Jui, Newgard and Warden 12 They found that estimated travel time, the use of lights and sirens, rush hour, and daylight were significant predictors of arrival time. However, presence of wet weather (any transfer that occurred during a day with more than 0.01 inches of precipitation) and patient-related conditions were not significant predictors. The discrepancy between the current analysis of precipitation and their analysis may be due to the low resolution of their weather data. A decision support aid built using their models was found to be accurate, within five minutes, 73% of the time.Reference Fleischman, Lundquist, Jui, Newgard and Warden 12 In previous work, the authors of the current study also used a similar technique to aid dispatchers in interfacility transfer scenarios and produced estimates of time to definitive care that were, on average, 21 minutes more accurate than the dispatchers’ own estimates, which had an average error of 54 minutes.Reference Giang, Donmez, Fatahi, Mahvareh and MacDonald 2 The models presented in this study can be incorporated in similar aids and models to improve the accuracy of estimated times. This research also highlights the large differences in the variability of travel times that exist for different transfer types. Further investigation of how this variability information can be incorporated into decision aids may help improve patient-care decisions.
Limitations
While previous studies have shown that different intensities and types of precipitation affect travel times, collision rates, and free-flow speeds to different degrees,Reference Andrey, Mills, Leahy and Suggett 8 , Reference Rakha, Farzaneh, Arafeh and Sterzin 10 , Reference Tsapakis, Cheng and Bolbol 11 this data set had few occurrences of moderate and heavy precipitation (less than one percent). Therefore, the authors were not able to go further than a comparison of rain, snow, and no precipitation. Further data are needed to investigate the effects of intensity, as well as other weather phenomena that may affect travel times (eg, fog). The low sample size for transfers made under inclement weather conditions may partially be explained by dispatchers being less likely to authorize interfacility patient transfers during such conditions.
Despite the fact that the authors used a web-mapping tool to estimate the routes taken, the model fit for intercity transfers was very high. Still, not using the actual route taken is another limitation of this study. The variations in actual driving distance in comparison to the estimated driving distance are likely to be larger for shorter distance travel. Therefore, the authors expect intracity transfers to be influenced more from potentially inaccurate estimates of travel distance. Further, in addition to a transfer being intercity or intracity, it may be important to classify the type of roads used by the transfer. Collecting such data would require accurate transcriptions of routes taken by the ambulance during transfers, and further investigation of this topic is required.
Finally, there were limitations associated with the spatial and temporal resolution of the weather data. In particular, five weather stations located in five different cities covered most of the sending and receiving facility locations and were used for precipitation information. However, 47% of intercity transfers occurred between a city without weather information (usually smaller towns) and a city for which there was precipitation information. Yet, the current analysis still improves on the quality and specificity of weather's impact on ambulance travel compared to existing models.Reference Giang, Donmez, Fatahi, Mahvareh and MacDonald 2 , Reference Fleischman, Lundquist, Jui, Newgard and Warden 12 In general, the lower resolution is expected to generate more conservative effects of precipitation.
Conclusion
Precipitation increases the duration of interfacility land ambulance travel times by eight percent to ten percent. For transfers between cities, snow is associated with the longest delays (versus rain), but for transfers within a single city, rain is associated with the longest delays.
Acknowledgements
The authors gratefully acknowledge the support of Emil Kerimov, David Belvedere, and Wenbing Luo, students from the University of Toronto, for their help in data cleaning, model building, and data analysis.