INTRODUCTION
Potassium is the most abundant inorganic cation in plants and is present mainly in cytoplasm and vacuoles. Many studies have demonstrated the key roles of potassium as: (i) an activator of enzymatic reactions (Evans & Sorger Reference Evans and Sorger1966), (ii) a charge-regulating ion and pH regulator for sugar conversion and transport (Giaquinta Reference Giaquinta1977) and (iii) an ionic osmoregulator of turgor, especially in stomata (Fischer Reference Fischer2004). There is a three-phase physiological impact when the leaf K concentration declines: firstly, the vacuole K concentration drops, but this is offset by an increase in the levels of other cations such as sodium, magnesium and calcium (Leigh & Wyn Reference Leigh and Wyn Jones1984; Triboulot et al. Reference Triboulot, Pritchard and Levy1997; Bednarz et al. Reference Bednarz, Oosterhuis and Evans1998), which has little physiological impact and is dependent on the possibility of compensating with other osmotica (Barraclough Reference Barraclough1993). As the K deficiency increases, its concentration in vacuoles declines, osmotic functions are affected and there are obvious effects on mechanisms such as cell growth and division and stomatal conductance. The cells maintain their cytoplasmic K concentration to ensure their biochemical functions (Leigh & Wyn Reference Leigh and Wyn Jones1984; Walker et al. Reference Walker, Leigh and Miller1996). Finally, under severe K deficiency, the cytoplasmic K concentration drops. Photosynthetic processes are affected, including a decrease in chlorophyll content and net photosynthesis (Reddy & Zhao Reference Reddy and Zhao2005), an increase in respiration, sugar uptake in chloroplasts and a decrease in starch synthesis (Amtmann et al. Reference Amtmann, Hammond, Armengaud and White2006). The decline in chlorophyll concentration is caused by a lack of ascorbate-dependent H2O2 scavenging enzymes (Cakmak Reference Cakmak1994), causing leaf chlorosis and necrosis.
Potassium plays an important role in cotton production by enhancing lint yield and fibre quality. K deficiency often appears in cotton grown in soils where other crops are not affected by K deficiency (Cassman et al. Reference Cassman, Kerby, Roberts, Bryant and Brouder1989). This peculiarity could be related to an unfavourable root/shoot ratio (Cassman et al. Reference Cassman, Kerby, Roberts, Bryant and Brouder1989), an inability of cotton roots to fully take advantage of surface soil where K availability is greatest (Gulick & Cassman Reference Gulick and Cassman1989) and a high K demand during boll development (Bednarz & Oosterhuis Reference Bednarz and Oosterhuis1999), leading to premature senescence (Gwathmey & Howard Reference Gwathmey and Howard1998; Wright Reference Wright1999). Bt cotton varieties grown in developing countries, including China (Pray et al. Reference Pray, Huang, Hu and Rozelle2002), South Africa and India (Morse et al. Reference Morse, Bennett and Ismael2007), show yield increases due to better fruit protection, which may result in a higher K demand during boll development. While the detrimental effects that deficient soil K levels can have on lint yield and fibre quality are well documented (Cassman et al. Reference Cassman, Kerby, Roberts, Bryant and Higashi1990; Pettigrew et al. Reference Pettigrew, Heitholt and Meredith1996; Pettigrew Reference Pettigrew1999), the effects on physiology and growth are not completely understood, especially for rain-fed crops. Field studies suggest that K deficiency decreases photosynthetic capacity at the individual plant level (Pettigrew & Meredith Reference Pettigrew and Meredith1997). However, it is not clear whether this decrease results from a decrease in leaf area index (LAI) alone or in combination with adverse effects on photosynthetic processes (Caporn et al. Reference Caporn, Ludwig, Flowers and Scaife1982; Scherer et al. Reference Scherer, Schubert and Mengel1982; Xi et al. Reference Xi, Lihua, Yongsong, Qizhao, Caixian and Lianxiang1989; Reddy et al. Reference Reddy, Hodges and Varco2000; Zhao et al. Reference Zhao, Oosterhuis and Bednarz2001). Reddy & Zhao (Reference Reddy and Zhao2005) suggested that these phenomena succeed one another as the deficiency gradually increases and proposed two critical K concentrations (16·8 and 12 mg/g measured on the upper expanded leaves), which may account for the observed limitation in leaf area expansion and photosynthesis, respectively. The marked decrease in LAI associated with K deficiency has been highlighted by many authors for diverse cultivated species (Rama Rao Reference Rama Rao1996), including cotton (Xi et al. Reference Xi, Lihua, Yongsong, Qizhao, Caixian and Lianxiang1989; Pettigrew & Meredith Reference Pettigrew and Meredith1997; Zhao et al. Reference Zhao, Oosterhuis and Bednarz2001). In cotton, however, there is often little analysis of which processes are impacted by K stress (Mutsaers Reference Mutsaers1983).
Cultivated soils in West Africa often have low nutrient contents, particularly for K. Agricultural practices may increase K deficiencies because of insufficient K restitution and a decrease in the inclusion of fallows in rotations. The effects of unbalanced fertilization on soil K availability are amplified by the prevailing soil and climatic conditions in West Africa (Poss et al. Reference Poss, Fardeau and Saragoni1996), where kaolinic particles induce high selective K adsorption and where annual rainfall can be locally very high, thus leading to K leaching. Richard (Reference Richard1974) found that the plant K status was closely linked to cumulative rainfall from cotton crop emergence.
The objective of the present study was to test the influence of K deficiency on leaf formation patterns in cotton, using two rain-fed experiments in Benin. The effect of K deficiency on the conversion of intercepted radiation and the allocation of assimilates produced between the above-ground organs were also assessed. Focus was placed on these variables since they represent the three main steps of the crop biomass simulation model proposed by Monteith (Reference Monteith1977). Leaf formation pattern was analysed through simple indicators such as leaf emergence rate, number, size and senescence. Radiation interception and conversion to biomass were estimated by calculating the radiation-use efficiency (RUE=g dry matter (DM)/MJ of photosynthetically active radiation (PAR) intercepted by the canopy), which has been successfully used to quantify crop photosynthesis (Monteith Reference Monteith1994), especially in tropical agricultural conditions (Black & Ong Reference Black and Ong2000). Insight into the impact of K deficiency on seasonal time courses of LAI, RUE and resource allocation is of major importance for interpreting, modelling and enhancing lint yield and fibre quality under the widespread the K-limiting conditions commonly experienced in West African countries.
MATERIALS AND METHODS
Experiments
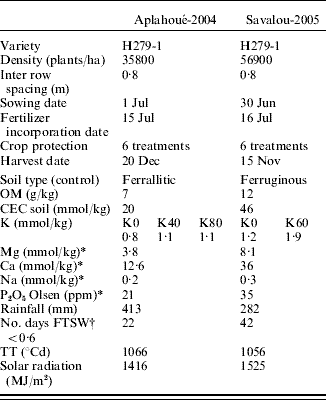
Potassium fertilization trials were carried out for cotton crops grown at Aplahoué (6°57′N, 1°40′E, 80 m) in 2004 and at Savalou (7°55′N, 1°55′E, 228 m) in 2005 in Benin. Hereafter, these experiments will be referred to as Aplahoué-2004 and Savalou-2005 to avoid confusion between experimental year and location. The soils were ferrallitic (Inceptisol) at Aplahoué and partially hardened tropical ferruginous (Alfisol) at Savalou. The average physical characteristics in the 0–600 mm horizons were as follows (measurements at 60 days after emergence (DAE)). At Aplahoué, the soil was a deep (>2 m) sandy soil containing 110 ml clay/l and 30 ml loam/l, pH 6·2, 7 g organic matter (OM)/kg, 20 mmol cation exchange capacity (CEC)/kg and 21 ppm P2O5 Olsen; at Savalou, the soil contained 40–60% gravel by volume with a thick hardpan layer at a depth of 800 mm, including 120 ml clay/l, 120 ml loam/l, 46 mmol CEC/kg, pH 6·8, 12 g OM/kg and 35 ppm P2O5 Olsen. At Aplahoué, three levels of fertilization had been applied since 2003 (0, 40 and 80 kg K2O/ha), which were termed the K0, K40 and K80 (=control) treatments, respectively. At Savalou, two levels of fertilization had been applied since 1969 (0 and 60 kg K2O/ha), identified as K0 and K60 (=control). For both sites, the applied potassium fertilizer was a 1:1 blend of KCl and K2SO4; crop residues were buried in the soil. No irrigation was applied. A randomized block experimental design was used with six replications. As shown in Table 1, exchangeable K concentrations in the soil (at 60 DAE) were low, even for the well-fertilized plots (1·1 mmol/kg for Aplahoué-2004 and 1·9 mmol/kg for Savalou-2005, corresponding to 43 and 74 ppm, respectively). This was probably the result of K uptake by plants during growth. However, exchangeable K concentrations were significantly lower in the K0 plots. Other main soil conditions and agricultural practices are summarized in Table 1.
Cotton crop management sequences and soil-climate conditions from emergence until 90 DAE in trials carried out at Aplahoué in 2004 and at Savalou in 2005. Average nutrient concentrations in soil are measured at mid season, for the 0–400 mm horizons
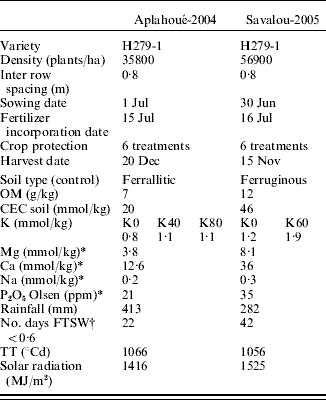
* Measured at 60 DAE and averaged on 0–400 m horizons on control K treatments plots.
† Number of days where the FTSW is below 0·6.
Climatic conditions and general trends
Data for climatic variables were collected using a portable automatic μmetos PESSL device (PESSL Instr. GES.M.B.H., Weiz, Austria) installed alongside the experimental plots. The following parameters were recorded: minimum and maximum air temperatures (°C, SMT 160-30 sensor), rainfall (mm, tipping-spoon rain gauge), global solar radiation (W/m2, pyranometer EG&G VACTEC VTB 4051 sensor) and wind speed (m/s, MD512 sensor). Potential evapotranspiration (ETP) was calculated according to the Penman–Monteith method (Monteith Reference Monteith1985).
Thermal time (TT) was calculated daily as

where T max is the maximum daily temperature, T min is the minimum daily temperature and T base is the threshold temperature for cotton (13°C).
Cumulated temperatures and solar radiation were almost identical for both study periods (Table 1) and both years were characterized by low rainfall. Cumulated rainfall from emergence until flowering (100 DAE) was 413 mm at Aplahoué-2004 and 282 mm at Savalou-2005. Drought conditions were particularly severe during the very early stages of crop growth at Aplahoué-2004, but were more evenly distributed over the growing period at Savalou-2005.
Soil water status
The daily water balance was calculated for each trial using a reservoir model with two compartments. The first layer was bounded by the soil surface and the depth of the rooting front and the underlying layer by the rooting front and a depth of 1 m. The soil water reserve was calculated as the difference between the maximum soil water content (measured on the day after rainfall events >40 mm) and the minimum soil water content (measured at the onset of the dry season). The depth of the rooting front was calculated assuming a daily extension rate for cotton of 20 mm/day until 60 DAE, 15 mm/day until 90 DAE and then 0 mm/day (Coelho Reference Coelho1998). The validity of the root depth model was checked by monitoring the soil-root profile at 60 and 120 DAE (data not shown).
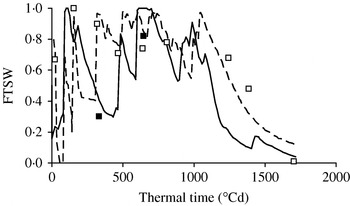
The available soil water reserve for the first layer was calculated daily on the basis of the sum of rainfall, the previous reserve and the quantity of water accessed by daily root growth, while subtracting evapotranspiration and possible water drainage. Available soil water for the second layer was calculated daily on the basis of first layer drainage, previous reserve, quantity of water lost by daily root growth and possible water drainage. Drainage for each layer was calculated as the difference between the soil water content and soil water reserve. Only positive values were taken into account. The initial available soil water reserve was measured for the 0–400 mm soil surface horizon at emergence. The fraction of transpirable soil water (FTSW) was calculated as the quantity of water available to the plant divided by the maximum soil water reserve (Fig. 1). To check the quality of the simulation, soil water contents determined on the basis of the water balance were compared with gravimetric moisture measurements for soil samples collected at 30, 60, 90 and 120 DAE. The number of days from emergence until 90 DAE when the FTSW could be considered as limiting (below 0·6) was 22 for Aplahoué-2004 and 42 for Savalou-2005 (Fig. 1, Table 1).
Simulated and observed FTSW. Lines link daily simulated data for Aplahoué-2004 (solid line) and Savalou-2005 (dotted line) and squares represent observed data in Aplahoué-2004 (□) and Savalou-2005 (▪).

Plant sampling and monitoring
Ten randomly selected plants per plot were non-destructively monitored at 10-day intervals. The same 10 plants were monitored on each occasion. Main stem nodes were counted between the cotyledonary scar and the uppermost-unfolded leaf node. The flowering date was taken as the date when half of the plants in individual plots had flowered. After this date, the final numbers of developed (>100 mm) fruiting and vegetative branches were determined and plant height was measured.
Biomass measurements were made for 10 randomly selected plants in all plots at 15-day intervals until 90 DAE (c. 1000°Cd). The samples were sub-divided into three categories (stems+petioles, leaves and fruit) and dried for 3 days at 80°C to determine their dry weights.
Chemical analyses
K, Ca, Mg and Na concentrations were measured by atomic emission or absorption after calcination at 550°C and dissolved in HNO3. Soil analysis was carried out according to the association française de normalisation (AFNOR) standard for ammonium acetate (pH 7, NFX31-108) extractible cations.
Calculations and parameterization of leaf growth and radiation conversion
In Aplahoué-2004, the area of individual leaves was calculated from the length of the left leaf vein as follows:

where X is the leaf vein length (mm) and Y is the leaf area (mm2). This equation was obtained by determining the regression between leaf vein length and leaf area for 185 leaves (R 2=0·955). Leaves were counted as senescent when less than half of their area was green. Senescent leaf ratio (SLR) was calculated at Savalou-2005 as the number of senescent leaves divided by the total number of leaves. LAI was calculated as total leaf area/plant multiplied by plant density.
In Savalou-2005, LAI was measured with a LAI-2000 Plant Canopy Analyser (Li-COR Inc., Lincoln, NE, USA). Measurements were performed early in the morning under uniformly overcast conditions (Hicks & Lascano Reference Hicks and Lascano1995). The accuracy of the LAI-2000 measurements was checked on five dates throughout the entire experimental period by determining individual leaf areas for 10 plants in every plot. Good correspondence was observed between both methods. In Aplhoué-2004 and Savalou-2005, daily LAI values were calculated by linear interpolation between measurement dates. Relative LAI values were calculated as: LAI of the K0 treatment divided by that of the control treatment.
PAR intercepted daily by plants was calculated as

where k (light extinction coefficient) was taken as 0·87, as obtained by Constable (Reference Constable1986) and Sadras (Reference Sadras1996) for cotton crops with populations with a similar density (5 plants/m2). Lower values (ranging from 0·6 to 0·8) have been used by other authors for crops with higher plant densities (Rosenthal & Gerik Reference Rosenthal and Gerik1991; Sadras & Wilson Reference Sadras and Wilson1997). Ratio of PAR to total radiation (R PAR) was taken to be constant at 0·5, a value frequently used in previous studies (Monteith Reference Monteith1972; Sinclair & Muchow Reference Sinclair and Muchow1999; Lizaso et al. Reference Lizaso, Batchelor, Westgate and Echarte2003). Maximum efficiency of radiation interception by a cotton canopy (∊i) was set at 0·95 (Ludwig et al. Reference Ludwig, Saeki and Evans1965).
RUE was calculated between 10 and 90 DAE on the basis of the slope of the regression between above-ground dry biomass (g/m2) and cumulated intercepted PAR (MJ/m2) for all measurement dates. In the present study, intercepted PAR was calculated instead of the more rigorous absorbed PAR, calculation of which requires measurement of canopy and soil reflectance (Bonhomme Reference Bonhomme2000) or the use of a constant correction factor as proposed by Sinclair & Muchow (Reference Sinclair and Muchow1999). This simplified calculation has already been widely used (Lacape Reference Lacape1998).
Statistical analysis
The data were processed by analysis of variance using SAS software (SAS Institute Inc. 1997).
RESULTS
Plant development
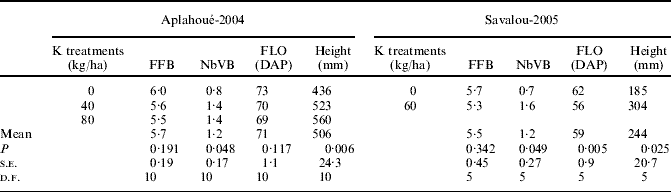
Plant development can be partly described through the rate of main stem node formation and the date of flowering. The number of main stem nodes was linearly related to TT until the rise in nutrient sink strength generated by fruit development, which occurred at around 1000°Cd at Aplahoué-2004 and Savalou-2005 (data not shown). During the linear phase of each curve, the rate of node appearance on the main stem was 0·015 nodes per °Cd for Aplahoué-2004 and 0·016 nodes per °Cd for Savalou-2005, irrespective of K treatment. This led to a final number of nodes of c. 18 and 17, respectively. However, the onset of flowering was significantly delayed at Savalou-2005 by 6 days (Table 2) in the K-deficient treatment.
Effects of K applications on the node number of the first fruiting branch (FFB), number of vegetative branches (NbVB), number of days between planting and flowering (FLO) and plant height in the field experiments at Aplahoué in 2004 and at Savalou in 2005. FFB, NbBV and height are the means for 60 plants
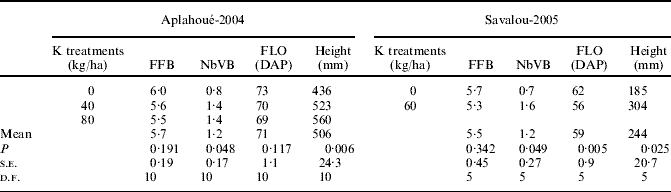
s.e.: standard error of the mean; d.f.: degrees of freedom; DAP: days after planting. Measurements were performed at mid-season stage, on 9 Sep 2004 and 13 Sep 2005.
Plant architecture
The mean number of vegetative branches was lower in K-deficient plants (c. 0·7) than in control plants (c. 1·5; Table 2) at both sites. However, the position of the first fruiting branch was not modified (non-significant difference of 0·5 nodes) in K-deficient plants, indicating that abscission or abortion of vegetative branches alone could account for their lower number.
Leaf characteristics
Leaf number
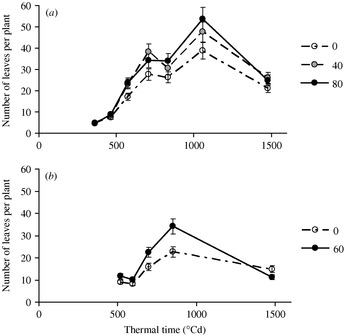
Figure 2 shows the influence of TT and K treatment on leaf number. Bell-shaped curves were obtained, with a reduction in leaf numbers towards the end of the growth period. This is a common phenomenon in cotton plants that results from changes in the balance between nutrient source and sink organs (Patterson et al. Reference Patterson, Buxton and Briggs1978). Cotton leaves were 1·5 times more numerous at Aplahoué-2004 (Fig. 2a) than at Savalou-2005 (Fig. 2b). Between 500 and 900°Cd, significant differences were noted between K-deficient and control plants (K80 at Aplahoué-2004 and K60 at Savalou-2005). During this period, the relative leaf number values for K-deficient cotton plants (K0/Control) were 0·75 for Aplahoué-2004 and 0·65 for Savalou-2005. These differences disappeared by the end of the cycle (1200–1500°Cd).
Number of leaves per plant for different K treatments in the Aplahoué-2004 (a) and Savalou-2005 (b) experiments. Each point represents the mean for 60 plants. The horizontal bar indicates that the difference in the number of leaves between K0 and K60 or K80 is significant at P<0·05. Vertical bars are confidence intervals at P<0·05.

Individual leaf areas
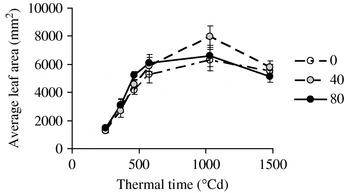
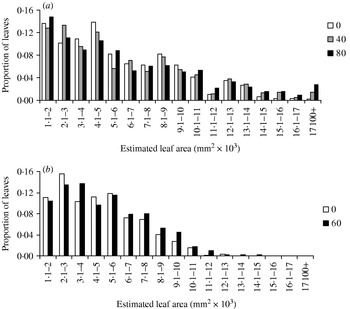
The average area of individual leaves was calculated for each measurement date. This approach provides a simple way to assess the effect of K treatments on individual leaf area, but must be considered with caution since it does not distinguish between growing leaves and adult leaves, which have already reached their final size. After a period of increase, the values stabilized to provide constant mean area values, probably reflecting an equilibrium between small young leaves and larger mature ones (Fig. 3). At steady state, the average areas of individual leaves were significantly lower in the K0 treatment at both experimental sites (data not shown for Savalou-2005). For instance, the mean individual leaf areas attained 60 days after planting (DAP, i.e. at 550°Cd at both sites) were 5600 v. 6300 mm2 for K0 and K80 in Aplahoué-2004, and 4000 v. 4500 mm2 for K0 and K60 in Savalou-2005. These discrepancies reflect the slight effect of K treatment on the distribution of individual leaf areas 60 DAP (Fig. 4), when the proportion of large leaves (>12 000 mm2) was significantly higher in K80 than in K0 in Aplahoué-2004, but not in Savalou-2005. Conversely, the proportion of small leaves (<3000 mm2) was significantly higher in K0 than in K60 in Savalou-2005, but not in Aplaouhé-2004.
Average area of individual leaves as a function of TT for three K treatments at Aplahoué in 2004. Each point represents the mean for 60 plants. Vertical bars are confidence intervals at P<0·05.

Distribution of individual leaf area for cotton crops at early flowering (60 DAP) for the different K treatments at Aplahoué in 2004 (a) and at Savalou in 2005 (b). Proportions were calculated for all leaves in 60 plants per treatment, representing 2900 leaves in the Aplahoué-2004 and 1500 in the Savalou-2005 experiments.

Leaf senescence
SLR (data not shown) ranged from 0·25 to 0·35, i.e. a relatively high ratio, until flowering began and followed a bell-shaped curve, with the peak value corresponding to 600°Cd. No significant difference between K treatments was observed during the vegetative or flowering periods.
LAI
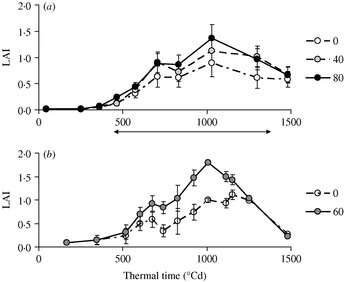
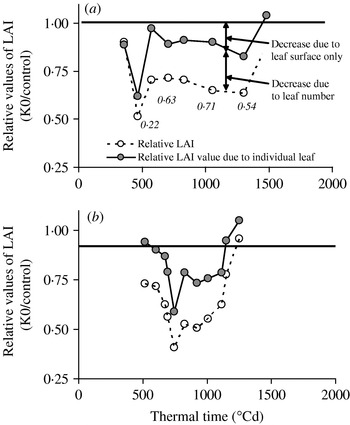
Figure 5 shows the time course of LAI for all K treatments. LAI at Aplahoué-2004 was lower than at Savalou-2005 and was significantly higher in the control treatment than in the K-deficient treatments at both sites. In both trials, LAI differed between treatments from around 500°Cd. The greatest differences were observed between 600 and 1000°Cd (Fig. 6). During this period, the ratio of LAI values for the K-deficient treatments divided by those for the control treatment was c. 0·7–0·8 at Aplahoué-2004, while at Savalou-2005 the difference was greater as the ratios ranged from 0·4 to 0·7. Towards the end of the growth period, LAI decreased to similar values in all treatments, probably because demand for assimilate by the fruit slowed and eventually stopped vegetative growth and promoted leaf abscission. However, the previous relative differences for LAI had a marked impact on the proportion of intercepted radiation, as shown below.
LAI for a cotton crop as a function of the post-emergence TT for the different K treatments at Aplahoué in 2004 (a) and at Savalou in 2005 (b). Each point represents the mean for 60 plants. The horizontal bar indicates periods where the differences in LAI between K0 and K60 or K80 were significant at P<0·05. Vertical bars are confidence intervals at P<0·05.

Relationship between the relative LAI and TT at Aplahoué in 2004 (a) and Savalou in 2005 (b). The lower curve (dotted line) represents the relative LAI (LAI K0/LAI control), which estimates the LAI reduction due to the reduced size of individual leaves and the reduced number of leaves. The upper curve represents the relative LAI of a K0 treatment that would have the same number of leaves as the control (LAI K0 calc/LAI control). This curve estimates reduction in LAI due to the reduced size of individual leaves only. The numbers in italics represent the proportion of the total reduction of the LAI that is accounted for by the lower number of leaves.

RUE
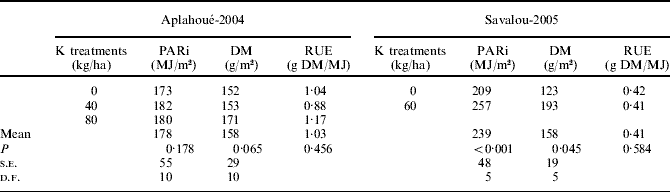
The results for biomass production, cumulative radiation interception and its conversion efficiency to produce above-ground DM are shown in Table 3. Intercepted PAR values were lower in Aplahoué-2004 than in Savalou-2005 mainly because of the smaller LAI, although interception measurements continued for 3 more days than in Aplahoué-2004. However, mean DM production was identical in both trials, resulting in substantially different conversion efficiencies, i.e. 1·03 g DM/MJ in Aplahoué-2004 but 0·41 g DM/MJ in Savalou-2005. K applications had a marked effect on intercepted radiation and biomass production at Savalou-2005, but no effect on conversion efficiency in both experiments (Table 3).
Effects of K applications on cumulative intercepted radiation from emergence to 90 DAP (PARi; MJ/m2), above-ground biomass production at mid-flowering (g/m2) and radiation use efficiency (g DM/MJ) in field experiments at Aplahoué in 2004 and at Savalou in 2005. All data represent means for 60 plants
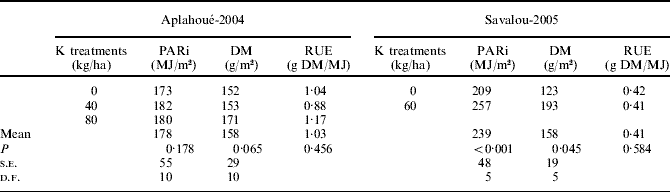
s.e.: standard error of the mean; d.f.: degrees of freedom; DM=dry matter. RUE: radiation use efficiency=regression slopes of DM and PARi.
Assimilate partitioning
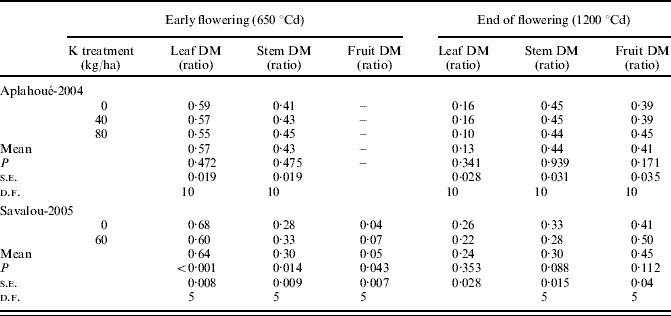
DM partitioning between the different above-ground plant organs is summarized in Table 4. Leaves accounted for 0·55–0·6 of the above-ground biomass at flowering onset but this gradually declined to 0·10–0·24 by the end of flowering. This decline reflected the gradual development of fruiting sites that competed with the vegetative organs of the plant for assimilates and mineral nutrients. K applications not only affected total biomass production but also its partitioning between organs. At flowering, K-deficient plants had a smaller proportion of their biomass in stems and fruits and a higher proportion in their leaves, especially in Savalou-2005.
Effects of K applications on above-ground biomass partitioning in the field experiments at Aplahoué in 2004 and at Savalou in 2005. All data represent means for 60 plants
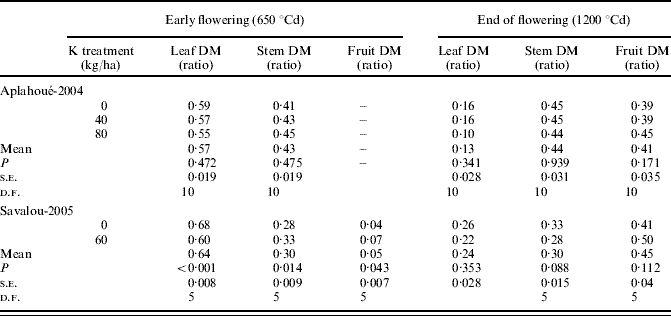
s.e.: standard error of the mean; d.f.: degrees of freedom; DM=dry matter. DM ratio represents organs DM/total above-ground DM.
Leaf K concentration
Figure 7 shows the influence of cumulative TT and K treatment on K concentrations in cotton leaves. For each experimental site, the ranking of K concentrations in the leaves was consistent with the K fertilization regime and corresponding soil exchangeable K (Table 1). Differences between K0 and the other K treatments were statistically significant (P=0·05) for the first five dates at Aplahoué-2004 and for all sampling dates at Savalou-2005. The peak value recorded in Aplahoué-2004 was reached 600°Cd after emergence (30 mg/g) and was followed by a progressive decrease to 10 mg/g. The K-deficient plants followed the same general pattern, although the values were consistently lower until after 1000°Cd. The classical shape of those curves attests to the natural dilution process, as plants grow larger (Braud Reference Braud1975; Burns Reference Burns1992; Greenwood & Karpinets Reference Greenwood and Karpinets1997; Jordan-Meille & Pellerin Reference Jordan-Meille and Pellerin2004). Unexpectedly, the curve shapes obtained in Savalou-2005 were quite different. The possible origins of this discrepancy are discussed below.
Leaf potassium concentrations for different K treatments in the Aplahoué-2004 (a) and Savalou-2005 (b) experiments. K was applied to the soil at 130°Cd post-emergence. K was determined for whole plant leaves and expressed on a dry weight basis. Vertical bars are confidence intervals at P<0·05.

Leaf cation concentration
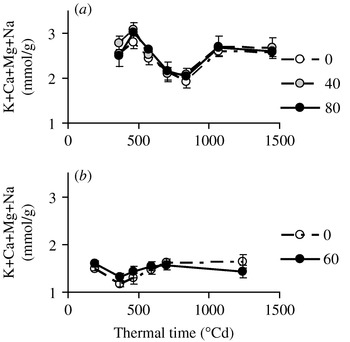
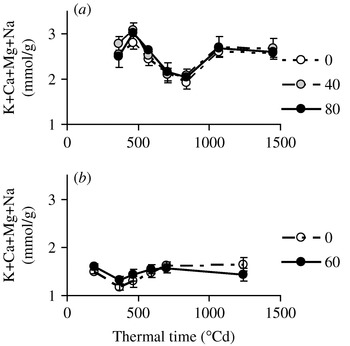
Figure 8 shows total inorganic cation (K, Ca, Mg and Na) concentration patterns in cotton leaves in relation to TT and K treatment. Molar cationic concentrations were not significantly lower in K0 plants except at Savalou-2005 before 500°Cd, suggesting that the ionic equilibrium was partially maintained through compensation phenomena. Leaf cation concentrations fluctuated between 2 and 3 mmol/g at Aplahoué and between 1 and 2 mmol/g at Savalou.
Leaf cation concentrations for different K treatments in the Aplahoué-2004 (a) and Savalou-2005 (b) experiments. K was applied to the soil at 130°Cd post-emergence. Cation concentrations were expressed on a leaf dry weight basis. Vertical bars are confidence intervals at P<0·05.

DISCUSSION
Comparison of experimental sites
The experimental sites used for the present study were chosen to be representative of agricultural conditions in West Africa, especially in southern Benin, where crops are not irrigated. Both sites (Aplahoue-2004 and Savalou-2005) were characterized by poor rainfall during the experimental period; similar dry periods occur on average once every 5 years. These dry conditions probably impacted on the results obtained, as indicated by the low LAI values for the control treatments, i.e. 1·3 in Aplahoué-2004 and 1·85 in Savalou-2005, compared with the much higher LAI values of well-irrigated cotton crops of 2·4–3·5 reported previously (Heitholt et al. Reference Heitholt, Pettigrew and Meredith1992; Hicks & Lascano Reference Hicks and Lascano1995; Pettigrew & Meredith Reference Pettigrew and Meredith1997). Moreover, the RUE values in the present study were lower than those reported under irrigated conditions, e.g. Rosenthal & Gerik (Reference Rosenthal and Gerik1991) reported RUE values for different cotton cultivars ranging from 1·2 to 1·66 g DM/MJ under irrigated conditions. The present results are closer to those reported by Lacape (Reference Lacape1998), who obtained RUE values based on intercepted radiation ranging from 0·8 to 1·5 g DM/MJ for a closely related cotton variety (Stam F) under similar rainfall conditions.
The two experimental sites were characterized by differences in soil, climate and agricultural practices, which may have impacted on the growth of cotton crops and their response to K treatments (Fig. 1, Tables 1 and 5). Plant development (node number, position of the first fruiting branch and number of vegetative branches) was similar at both sites (Table 2). In the control K treatments, the lower cation concentrations observed in cotton leaves in Savalou-2005 compared with Aplahoue-2004 (Figs 7 and 8) cannot be explained by the availability of K and other cations in the soil (Table 1). They may be the consequence of the very poor rainfall conditions experienced during 2005 in Savalou and the consequent effects on soil water content (Fig. 1), transpiration and transport of ions to roots by mass flow. The possible effect on water supplies may also explain the contrasting shape of the relationships between K concentration in leaves and TT between sites (Fig. 7). In the control treatments, the smaller number of leaves and area of individual leaves at Savalou-2005 compared with Aplahoue-2004 may have been the consequence of the greater plant density (Constable Reference Constable1986). Differences in the number of leaves cannot be explained by differences in the rate of plant development or the numbers of vegetative branches, as these were comparable for both sites (Table 2) and may have been the consequence of the lower plant density in Aplahoué-2004 (Table 1). Buxton et al. (Reference Buxton, Briggs, Patterson and Watkins1977) showed that the indeterminate nature of development in cotton led to an increase in leaf and node numbers per branch in low-density crops. The drier climatic conditions experienced at Savalou-2005 may also have contributed to the reduced leaf number and area of individual leaves. The higher LAI and lower RUE observed in the treatments well-supplied with K in Savalou-2005 compared with Aplahoue-2004 are likely to be due to the higher plant density, with a possible additional negative effect of drought on RUE at Savalou-2005.
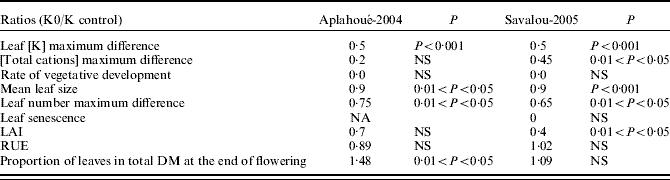
Summary of the specific effects of K deficiency on rain-fed cotton crops at Aplahoué in 2004 and at Savalou in 2005. Figures are the ratios calculated for each variable between the K deficient treatment and the control (K0/K80 and K0/K60 for Aplahoué-2004 and Savalou-2005, respectively)
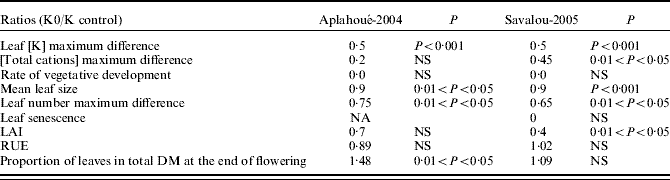
NS: not significant.
NA: data not available.
LAI=leaf area index.
RUE=radiation use efficiency.
Influence of K supplies on the growth characteristics of rain-fed cotton crops
Despite the differences between experimental sites, the growth variables affected by K deficiency were comparable at both sites (Table 5). On the main stem, it seems that the number and position of fruiting branches were not modified. The main significant difference concerned final plant height, which was greatly reduced in the K0 treatment. The lower height (Table 2) resulted solely from reduced inter-node length as node development was not modified. The numbers of vegetative branches and above-ground DM/m2 were also significantly reduced by K deficiency at both sites (Tables 2 and 3). The onset of flowering was delayed by 6 days in the K-deficient treatments at Savalou-2005 (Table 2), which was not due to changes in main stem node emergence rates (Table 2) but could be explained mainly by the abundant shedding of flower buds in deficient plants (data not shown). Biomass partitioning between the above-ground organs was modified, i.e. the K0 treatments plots had a larger proportion of DM in the leaves (Table 4). The changes in carbon partitioning are in accordance with previous results that showed low assimilate export (Cakmak et al. Reference Cakmak, Hengeler and Marschner1994) and low sink activity (Kanai et al. Reference Kanai, Ohkura, Adu-Gyamfi, Mohapatra, Nguyen, Saneoka and Fujita2007) in K-deficient plants. The number of leaves, average area of individual leaves and LAI were significantly lower in the K0 treatment (Figs 2–5). The effect of K deficiency on LAI in cotton is consistent with previous reports (Xi et al. Reference Xi, Lihua, Yongsong, Qizhao, Caixian and Lianxiang1989; Pettigrew & Meredith Reference Pettigrew and Meredith1997; Zhao et al. Reference Zhao, Oosterhuis and Bednarz2001). K concentrations in the leaves of deficient plants in the present study were below the critical value for leaf area expansion (16·8 mg/g) reported by Reddy & Zhao (Reference Reddy and Zhao2005). In the K0 treatment, K concentration in leaves was below this threshold during the whole growing period in Savalou-2005 and from 600°Cd in Aplahoué-2004 (Fig. 7).
Effects of abiotic stress factors on LAI may result from differences in leaf number, individual leaf size and/or leaf senescence. Under the present experimental conditions, senescence is unlikely to explain the difference in LAI as this did not differ significantly between K treatments at Savalou-2005. The lower LAI in K0 was therefore the consequence of the reduced number of leaves (Fig. 2) and their smaller individual area (Figs 3 and 4). To illustrate the relative contribution of each effect on LAI, Fig. 6 shows (i) the observed relative LAI for each sampling date (LAI K0/LAI control) and (ii) the calculated relative LAI if plants in the K0 treatment had the same number of leaves as those in the control treatment ((LAI K0/LAI control)×(number of leaves in control/number of leaves in K0)). The first calculation measures the reduction in LAI due to the reduced number of leaves and their decreased size, whereas the second estimates the extent of the LAI reduction resulting from the reduced size of the leaves. It appears that the reduction in LAI was mainly accounted for by the decreased leaf number in Aplahoué-2004, whereas the contribution of both processes was similar in Savalou-2005.
Growth variables not affected by plant K status
In the present study, variables that were not affected by K deficiency were foliar inorganic cation molarity, main stem node development, position of the first fruiting branch, senescence and RUE. Ionic equilibrium in leaves was partially maintained through compensation phenomena by Mg and Ca. The initial concentration of Na and its increase were almost negligible. Such compensation phenomena are commonly observed in plants enduring K deficiency (Pujos & Morard Reference Pujos and Morard1997) and are often suggested to be a response to maintain their internal osmotic potential. However, it must be remembered that cation concentrations were measured at the whole organ scale (leaves) in the present study, which is not fully appropriate to test the osmotic compensation hypothesis.
The lack of effect of K deficiency on senescence may be surprising, since leaf chlorosis is often reported as a visible symptom of K deficiency. This chlorosis has been suggested to be related to photosynthetic activity. In K-deficient leaves, the concentration of H2O2 scavenging enzymes is low. Toxic O2 molecules produced by photosynthesis thus accumulate in leaves and damage chloroplast components, particularly chlorophyll (Cakmak Reference Cakmak1994). This phenomenon may not have been expressed under the dry conditions in the present study because photosynthesis may have been limited by stomatal closure.
The lack of effect of K deficiency on RUE, even though LAI was significantly reduced, is consistent with previous findings, which have shown that critical K concentrations for leaf area expansion are higher than those for photosynthesis per unit leaf area (Reddy & Zhao Reference Reddy and Zhao2005). The present RUE results may be surprising as some authors have shown that, during mild K deficiency, photosynthesis was affected (Bednarz et al. Reference Bednarz, Oosterhuis and Evans1998; Pervez et al. Reference Pervez, Ashraf and Makhdum2004). Two points should be considered: firstly, Bednarz et al. (Reference Bednarz, Oosterhuis and Evans1998) and Pervez et al. (Reference Pervez, Ashraf and Makhdum2004) determined canopy photosynthesis rather than photosynthesis per unit area. Secondly, RUE is not solely linked to the rate of CO2 exchange at light saturation (Monteith Reference Monteith1977; Black & Ong Reference Black and Ong2000) but also to factors affecting biomass accumulation (Arkebauer et al. Reference Arkebauer, Weiss, Sinclair and Blum1994), particularly because K-deficient plants may appear to allocate fewer resources to roots (Ericsson Reference Ericsson1995) when RUE is calculated on the basis of shoot DM. Reddy & Zhao (Reference Reddy and Zhao2005) observed that cotton plants grown under greenhouse conditions exhibited decreases in chlorophyll concentration and reduced photosynthetic rate per unit leaf area when leaf K concentrations dropped below 12 mg/g. No significant effect of K deficiency on RUE was observed under the present experimental conditions, although K concentration in the K0 treatment fell below this threshold (Fig. 7). Perhaps because RUE is an integrative variable, the slight effect of K treatment on photosynthesis per unit leaf area may not be reflected by RUE. Moreover, experimental conditions differed greatly between study sites and water stress may have hidden possible effects of K deficiency on photosynthesis via stomatal closure.
Consequences for modelling and agricultural practices
The present findings suggest that the reduced biomass accumulation of rain-fed cotton under moderate K deficiency is almost fully accounted for by the effect of K supplies on LAI and consequent effects on light interception. This observation suggests that modelling the effects of K deficiency on biomass production should focus solely on the reduction of leaf area and modifications of carbon partitioning. At the crop level and under moderate K deficiency, it does not seem necessary to take the effects of K deficiency on RUE into account.
In terms of practical application, in such climatic and soil conditions, it might be advisable to increase planting density or to use late flowering varieties to increase LAI and root access to soil K resources.
The authors are highly grateful to Blaise Fadoegnon, Isidore Amonmide, Marc Adjaoke and Diane Gnitangni of the Centre de Recherche Agricole Coton et Fibres de Bohicon and Céline Gire from ENITAB, UMR TCEM in Bordeaux for their help in setting up these experimental trials. Thanks to David Manley and Georges Felix for their assistance with the English.