





People with severe mental illness (SMI), including schizophrenia, bipolar disorder and other non-organic psychoses, face significant health inequalities, as evidenced by premature death and poor physical health. Reference Baxter, Harris, Khatib, Brugha, Bien and Bhui1 Compared with the general population, patients with SMI have a life expectancy shorter by about 10–20 years. Reference John, McGregor, Jones, Lee, Walters and Owen2 Moreover, this mortality gap has been widening in recent years. Reference Hayes, Marston, Walters, King and Osborn3 Although a higher proportion of deaths in this population are attributable to unnatural causes such as suicide and accidents, the majority of preventable deaths are attributable to physical health conditions. Reference Baxter, Harris, Khatib, Brugha, Bien and Bhui1
More recent research on physical health in patients with SMI has shifted focus from single long-term conditions to multimorbidity (the co-occurrence of two or more long-term conditions). This framework represents a shift from a single disease-centred to a patient-centred perspective in clinical practice. Reference Halstead, Siskind and Warren4 Two recent meta-analyses reported that the odds ratio for physical multimorbidity in people with SMI versus those without SMI ranged from 1.84 to 2.40. Reference Halstead, Cao, Høgnason Mohr, Ebdrup, Pillinger and McCutcheon5,Reference Pizzol, Trott, Butler, Barnett, Ford and Neufeld6 In people with schizophrenia, cross-sectional studies have found that a greater physical multimorbidity burden is associated with an increased risk of premature mortality. Reference Kugathasan, Wu, Gaughran, Nielsen, Pritchard and Dobson7,Reference Kugathasan, Stubbs, Aagaard, Jensen, Munk Laursen and Nielsen8 A longitudinal cohort study that used a data-driven approach to examine multimorbidity trajectories found that patients with SMI who had similar clinical characteristics tended to develop the same conditions over time. Reference Wang, Bendayan, Msosa, Pritchard, Roberts and Stewart9 It is therefore important to consider heterogeneity within the population of patients with SMI when examining associations between long-term physical multimorbidity profiles and the risk of premature mortality.
Joint latent class modelling (JLCM) assumes that the study population is heterogeneous, comprising latent subgroups with distinct longitudinal trajectories and similar event-risk profiles. Unlike conventional group-based trajectory models, JLCM simultaneously estimates the longitudinal and survival processes. Consequently, trajectory classification is informed by both repeated measurements and time-to-event data, which mitigates bias from informative censoring, such as missing longitudinal measurements because of death. Reference Kyheng, Babykina and Duhamel10 To date, no studies have applied this approach to measure trajectories of physical comorbidity burden in patients with SMI. In this study, we used JLCM to identify distinct trajectories of physical comorbidity burden among patients with SMI managed in primary care, examine differences in mortality risk across trajectory groups, and explore baseline clinical indicators associated with trajectory membership that may support early identification of high-risk groups and the development of stratified interventions.
Method
Data source
This population-based, retrospective cohort study used data from The Health Improvement Network (THIN), a UK primary care database of anonymised electronic health records, covering approximately 6% of the national population. THIN uses the hierarchical Read coding system to capture patient health information on symptoms, examinations, diagnoses and referrals recorded by general practitioners (GPs), nurses and healthcare assistants during routine care. Reference Chisholm11 Although some practices transitioned to the Systematized Nomenclature of Medicine Clinical Terms (SNOMED CT) vocabulary during the study period, the extract used was mapped to Read codes and all code lists were developed accordingly. Only practices meeting established THIN data quality criteria – acceptable mortality reporting (AMR) and acceptable computer usage – were included. Reference Horsfall, Walters and Petersen12 THIN has been validated for use in epidemiological research, including studies of SMI in primary care. Reference Hayes, Marston, Walters, King and Osborn3,Reference Hardoon, Hayes, Blackburn, Petersen, Walters and Nazareth13
Since 2004, the management of patients with SMI has been incentivised through the Quality and Outcomes Framework (QOF), a pay-for-performance scheme that requires GPs to maintain disease registers and conduct annual health reviews for patients with SMI and other long-term conditions. The implementation of the QOF has improved the completeness of clinical data recording for this population. Reference Hardoon, Hayes, Blackburn, Petersen, Walters and Nazareth13 Our study cohort comprised patients registered with practices in England, where the QOF has remained in continuous operation, thereby avoiding potential bias from the subsequent discontinuation of the scheme in other UK nations. Reference Morales, Minchin, Kontopantelis, Roland, Sutton and Guthrie14
Ethical approval was granted by the National Health Service (NHS) South-East Multicentre Research Ethics Committee, and the study was approved by the THIN Scientific Review Committee (reference number 22-013-R1). Individual patient consent was not required for this retrospective analysis of anonymised data. Approximately 5% of the NHS population have opted out of research use of their data; this rate reflects recent national estimates and may not have been constant throughout the study period. 15
Study population
We identified SMI by using Read codes based on the QOF definition and classified recorded diagnoses as schizophrenia, affective psychoses (bipolar disorder and other affective psychotic disorder), or other psychoses, consistent with previous SMI studies (see Supplementary Code Lists in the Supplementary Material). Reference Reilly, Olier, Planner, Doran, Reeves and Ashcroft16 Where multiple SMI diagnoses were recorded, a hierarchical classification rule was applied (see Supplementary Material). Reference Osborn, Limburg, Walters, Petersen, King and Green17 The index date was defined as the date of the first recorded SMI diagnosis in primary care. This study included patients with a first recorded diagnosis of SMI between 1 January 2004 and 31 December 2023. Patients were excluded if they were younger than 18 years or older than 100 years, had been registered with a THIN practice for <1 year, had an index date before their registration date or had <1 year of follow-up after the index date. The selection process is shown in Supplementary Fig. 1.
Comorbidity burden
We used the Charlson Comorbidity Index (CCI), a validated severity- and mortality-weighted measure of concurrent non-psychiatric comorbidities, to quantify the annual physical comorbidity burden. Reference Yurkovich, Avina-Zubieta, Thomas, Gorenchtein and Lacaille18 Code lists for the 17 CCI conditions were derived from those originally developed by Metcalfe and colleagues. Reference Metcalfe, Masters, Delmestri, Judge, Perry and Zogg19 For each individual, we calculated the annual sum of weighted CCI scores. Once a CCI condition had been recorded, it was carried forward to subsequent years to capture the cumulative burden of disease over time. In cases where different severity levels of a condition were recorded in the same calendar year (for example, mild versus moderate/severe liver disease), we used the highest severity level (and its weight) for that year (see Supplementary Table 1).
Outcomes
The primary outcome was all-cause mortality. Deaths were identified from records of THIN practices meeting the AMR criteria, a validated indicator of complete mortality recording. Reference Blak, Thompson, Dattani and Bourke20 The follow-up period was defined from the index date to the earliest of the following: death, transfer out of the practice, the practice’s last data collection date, 31 December 2023 or 10 years after index date.
Baseline sociodemographic and clinical characteristics
Demographic variables were age at index date, gender and ethnicity. Socioeconomic deprivation was measured with the Index of Multiple Deprivation (IMD), categorised into quintiles from the least deprived (first quintile) to the most deprived (fifth quintile). 21 Lifestyle factors included smoking status, body mass index (BMI) category, alcohol misuse and drug misuse. Face-to-face clinical consultations and referrals to mental health services were identified from records during the 12 months before the index date. Reference Kontopantelis, Olier, Planner, Reeves, Ashcroft and Gask22,Reference Windfuhr, While, Kapur, Ashcroft, Kontopantelis and Carr23 Medication use was defined as having one or more recorded prescriptions for a given medication in the same period, identified via the Anatomical Therapeutic Chemical (ATC) classification system. Psychotropic medications included antipsychotics (ATC code N05A, excluding lithium), subcategorised into first-generation antipsychotics and second-generation antipsychotics, as well as antidepressants (ATC code N06A), anxiolytics (ATC code N05B), and hypnotics and sedatives (ATC code N05C). We additionally examined three classes of medications commonly prescribed for physical comorbidities in people with SMI: (a) antihypertensive agents (ATC codes C02, C03, C07, C08 and C09), (b) antidiabetic medication (ATC code A10) and (c) drugs for obstructive airway diseases (ATC code R03) (see Supplementary Material).
Statistical analysis
Continuous variables were presented as medians and interquartile ranges (IQRs) because of skewed distribution, as indicated by the Kolmogorov–Smirnov test. Categorical variables were presented as numbers and percentages.
The analysis followed a two-step approach (Supplementary Fig. 2). In the first step, we employed JLCM (using the R package ‘lcmm’) to identify distinct trajectories of physical comorbidity burden and their associated risks of all-cause mortality. The JLCM comprises three linked submodels: a class-membership submodel, a longitudinal submodel and a survival submodel. Reference Kyheng, Babykina, Ternynck, Devos, Labreuche and Duhamel24 These three submodels were estimated simultaneously through maximum likelihood, so that the classification was informed by both repeated measurements of CCI and all-cause mortality. Because our aim was to identify latent classes independent of baseline patient characteristics, we did not adjust for any covariates in these submodels. To determine the optimal number of latent classes, we fitted candidate JLCMs with G = 1, 2, 3, 4 and 5 classes and selected the model that best balanced the following four criteria: Bayesian information criterion (BIC) for model fit; classification quality (entropy and the posterior classification table); successful model convergence; and clinical plausibility, with each class containing a sufficient proportion of patients. Reference Kyheng, Babykina and Duhamel10
In the second step, having identified the optimal number of latent classes, each individual was assigned to their most likely class based on the maximum posterior class-membership probability. A series of posterior analyses were then conducted based on this classification. Differences in baseline characteristics among the trajectory groups were analysed with the Kruskal–Wallis H-test or the chi-squared test, as appropriate. We constructed a directed acyclic graph (DAG) to identify baseline confounders of the association between trajectory group and all-cause mortality (Supplementary Fig. 3). We then used Cox proportional hazards models to estimate hazard ratios and 95% CIs, using the ‘persistent-low’ group as the reference, as it represented the largest class with the lowest observed comorbidity burden. Two models were established: model 1 was unadjusted, and model 2 was adjusted for baseline confounders identified from the DAG. To identify clinical indicators of trajectory membership, we fitted a multinomial logistic regression model incorporating all baseline variables (dichotomised where appropriate to improve clinical interpretability; see Supplementary Table 2). Model fit was optimised with backward stepwise selection based on the Akaike information criterion. The discriminative performance of the final model was assessed by calculating receiver operating characteristic curves and the area under the curve (AUC), using a one-versus-rest strategy. Reference Luckhurst, Wiberg, Brown, Bruch, Chandler and Danielson25
All analyses were conducted with R version 4.4.0 for Windows (R Foundation for Statistical Computing, Vienna, Austria; https://www.r-project.org/). A two-sided p-value of <0.05 was considered statistically significant. Further details, including time function specification (Supplementary Table 4), are provided in the Supplementary Material.
Sensitivity analyses
We conducted two sensitivity analyses. First, we re-estimated the JLCM by using a simple count of 24 chronic conditions derived from the Charlson and Elixhauser indices to assess the robustness of the 4-class solution. Reference Metcalfe, Masters, Delmestri, Judge, Perry and Zogg19 Second, because missing baseline data (ethnicity 38.5%, BMI 17.0%, smoking 5.8%, IMD 0.3%) were handled as separate categories in the primary analysis, we used multiple imputation by chained equations to assess the impact of missingness. Reference White, Royston and Wood26
Results
Cohort description
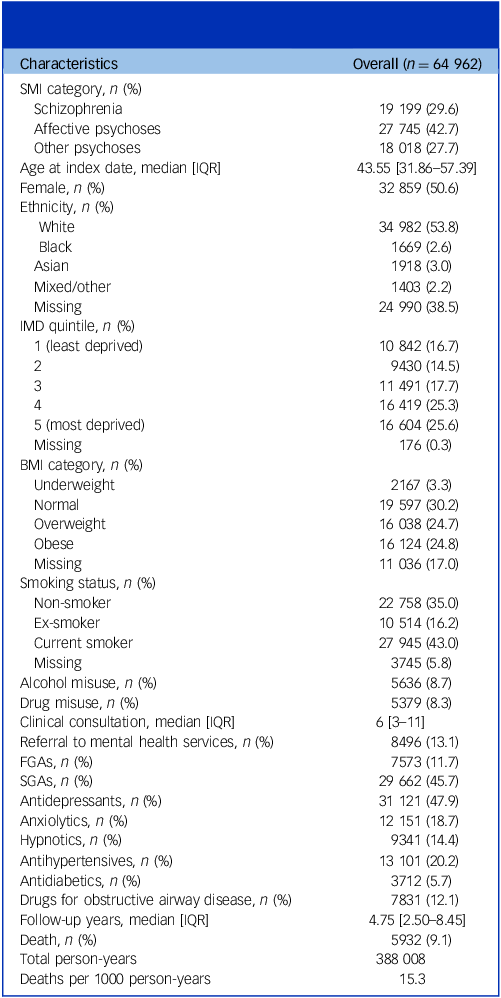
Among the 64 962 patients with SMI at baseline, 29.6% had recorded diagnoses of schizophrenia, 42.7% had recorded affective psychosis and 27.7% had recorded other psychoses. The median age at index date was 43.55 years, 50.6% of patients were female and 53.8% were White. A higher proportion of patients lived in more deprived areas: 25.3 and 25.6% were in IMD quintiles 4 and 5, respectively. For lifestyle factors at baseline, 24.7% were overweight, 24.8% were obese and 43.0% were current smokers. The prevalence of alcohol misuse and drug misuse was 8.7 and 8.3%, respectively. The median number of clinical consultations in the year before index date was six, and 13.1% of patients had been referred to mental health services. Regarding psychotropic medication use, 11.7% of patients were prescribed first-generation antipsychotics, 45.7% received second-generation antipsychotics, 47.9% received antidepressants, 18.7% received anxiolytics and 14.4% received hypnotics. The proportions of patients on medications for hypertension, diabetes and obstructive airway disease were 20.2, 5.7 and 12.1%, respectively (Table 1). In addition, the most prevalent baseline conditions among patients with SMI were chronic pulmonary disease (18.9%), followed by uncomplicated diabetes (7.5%), any malignancy (5.0%), cerebrovascular disease (3.8%) and dementia (2.8%) (Supplementary Fig. 4).
Baseline characteristics of all patients with severe mental illness

Table 1 Long description
A table with 21 rows and 2 columns. The first column lists various characteristics, and the second column provides corresponding values. Row 1: SMI category, n (%); Schizophrenia, 19 199 (29.6). Row 2: Affective psychoses, 27 745 (42.7). Row 3: Other psychoses, 18 018 (27.7). Row 4: Age at index date, median [IQR], 43.55 [31.86-57.39]. Row 5: Female, n (%), 32 859 (50.6). Row 6: Ethnicity, n (%); White, 34 982 (53.8). Row 7: Black, 1 669 (2.6). Row 8: Asian, 1 918 (3.0). Row 9: Mixed/other, 1 403 (2.2). Row 10: Missing, 24 990 (38.5). Row 11: IMD quintile, n (%); 1 (least deprived), 10 842 (16.7). Row 12: 2, 9 430 (14.5). Row 13: 3, 11 491 (17.7). Row 14: 4, 16 419 (25.3). Row 15: 5 (most deprived), 16 604 (25.6). Row 16: Missing, 176 (0.3). Row 17: BMI category, n (%); Underweight, 2 167 (3.3). Row 18: Normal, 19 597 (30.2). Row 19: Overweight, 16 038 (24.7). Row 20: Obese, 16 124 (24.8). Row 21: Missing, 11 036 (17.0).
Baseline variables were measured in the year before the index date. SMI, severe mental illness; IQR, interquartile range; IMD, Index of Multiple Deprivation; BMI, body mass index; FGAs, first-generation antipsychotics; SGAs, second-generation antipsychotics.
During a median follow-up of 4.75 years (IQR 2.50–8.45 years), 5932 deaths (9.1% of the cohort) occurred over 388 008 person-years, yielding a crude mortality rate of 15.3 deaths per 1000 person-years. The proportion of patients with SMI who had at least one long-term condition increased from 36.4% at baseline to 48.6% by the end of follow-up (Supplementary Fig. 5).
Identification of comorbidity burden trajectories and associated mortality risks
The distribution of follow-up duration and number of repeated CCI measurements is presented in Supplementary Table 3. After testing models with one to five classes, the four-class model was chosen as optimal. It had the lowest BIC, high entropy and each class contained an acceptable proportion of participants (>2%) (see Supplementary Table 5). The posterior class-membership probabilities in the four-class model ranged from 0.79 to 0.98 (Supplementary Table 6). All were above the 0.7 threshold, indicating good class separation. Reference Kyheng, Babykina and Duhamel10
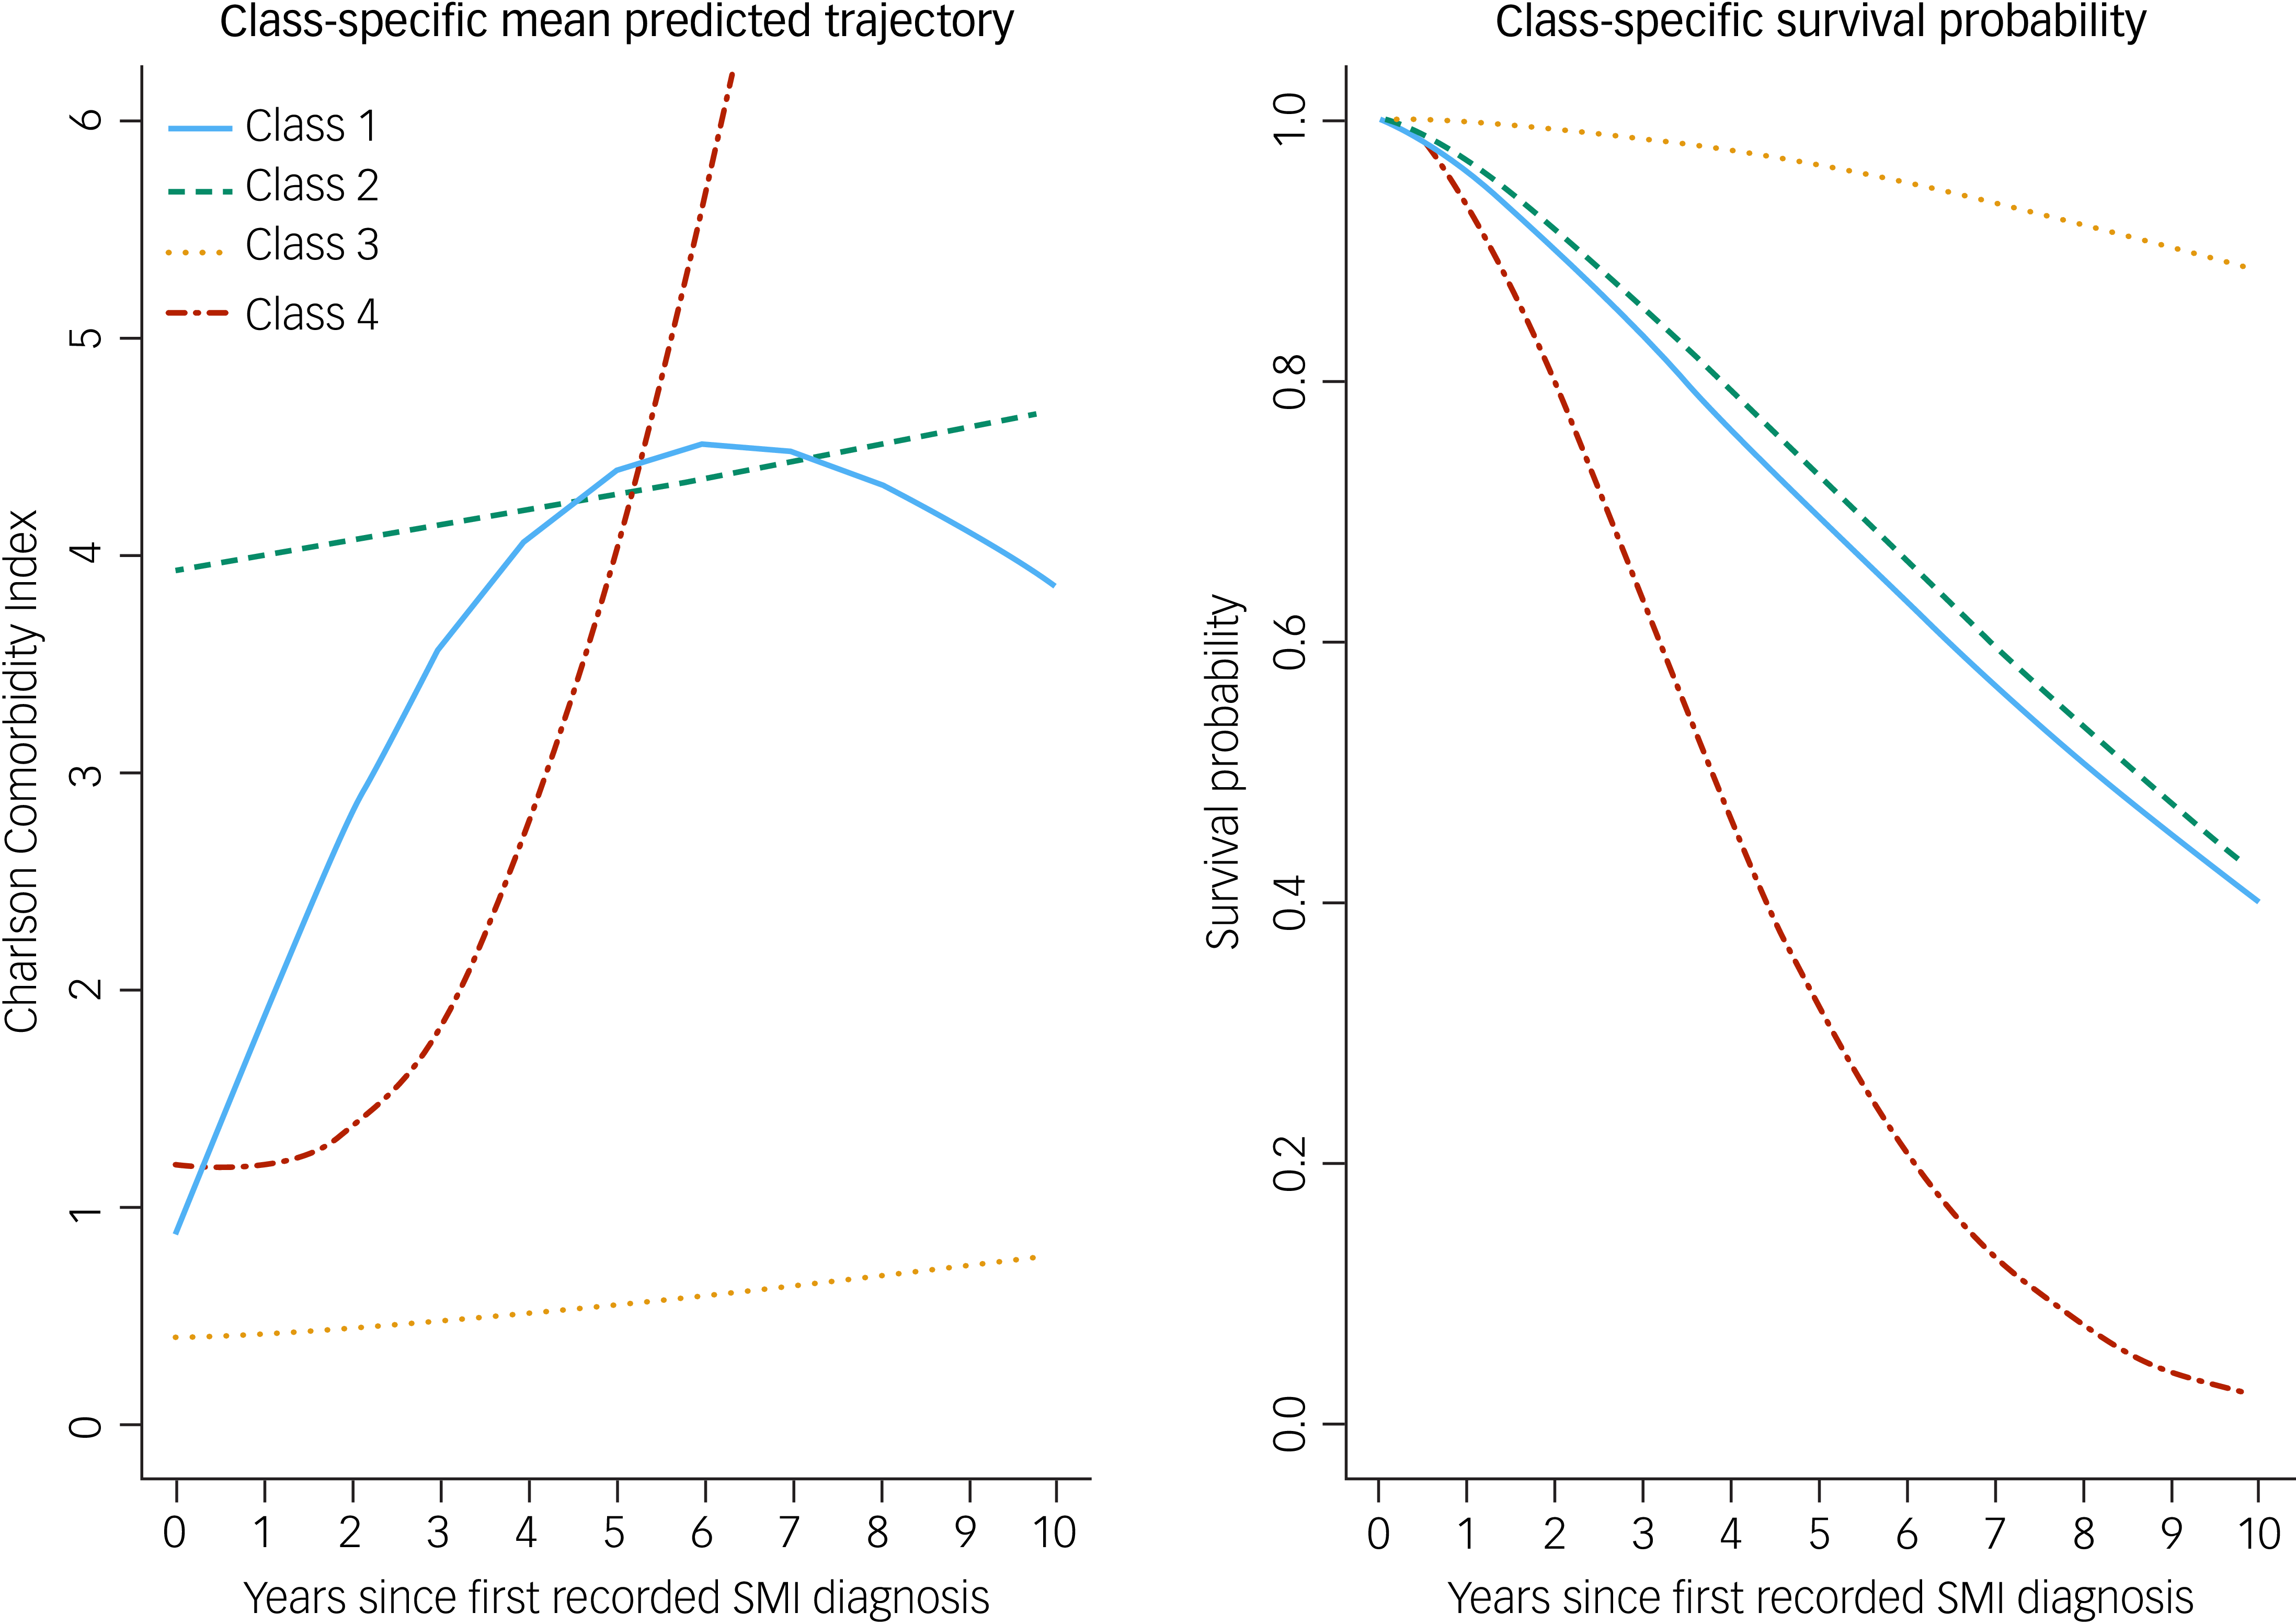
The four CCI-defined comorbidity burden trajectories are shown in Fig. 1. Class 1, the increase-stable group (2.6%), comprised patients with a low baseline CCI that increased to approximately 4 during the early follow-up period and then subsequently plateaued at this level. Class 2, the persistent-high group (5.1%), had a consistently elevated CCI stable at approximately 4. Class 3, the persistent-low group (89.9%), maintained a low CCI that gradually increased to around 1. Class 4, the rapid-increase group (2.5%), had a low baseline CCI that increased rapidly during follow-up. The persistent-low group had the lowest mortality risk, followed by the persistent-high and increase-stable groups. The rapid-increase group had the highest mortality risk.
Estimated class-specific physical comorbidity trajectory and unadjusted class-specific survival probability for four-class joint latent class model. Class 1, increase-stable group; class 2, persistent-high group; class 3, persistent-low group; class 4, rapid-increase group. SMI, severe mental illness.

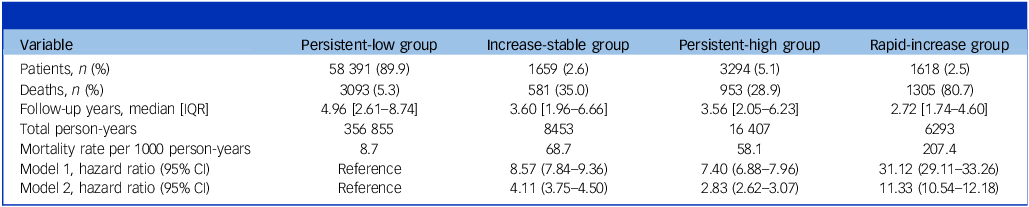
With the persistent-low group as the reference, unadjusted hazard ratios for the increase-stable, persistent-high and rapid-increase groups were 8.57 (95% CI 7.84–9.36), 7.40 (95% CI 6.88–7.96) and 31.12 (95% CI 29.11–33.26), respectively. After adjusting for baseline confounders, the hazard ratios for the increase-stable, persistent-high and rapid-increase groups were 4.11 (95% CI 3.75–4.50), 2.83 (95% CI 2.62–3.07) and 11.33 (95% CI 10.54–12.18), respectively (Table 2).
Mortality outcomes and hazard ratios across four identified trajectory groups

Table 2 Long description
A table comparing mortality outcomes and hazard ratios across four trajectory groups. The table has four columns: Persistent-low group, Increase-stable group, Persistent-high group, and Rapid-increase group. Each column contains data on patients, deaths, follow-up years, total person-years, mortality rate per 1000 person-years, Model 1 hazard ratio, and Model 2 hazard ratio. Row 1: Patients, n (%): 58391 (89.9), 1659 (2.6), 3294 (5.1), 1618 (2.5). Row 2: Deaths, n (%): 3093 (5.3), 581 (35.0), 953 (28.9), 1305 (80.7). Row 3: Follow-up years, median [IQR]: 4.96 [2.61-8.74], 3.60 [1.96-6.66], 3.56 [2.05-6.23], 2.72 [1.74-4.60]. Row 4: Total person-years: 356855, 8453, 16407, 6293. Row 5: Mortality rate per 1000 person-years: 8.7, 68.7, 58.1, 207.4. Row 6: Model 1, hazard ratio (95% CI): Reference, 8.57 (7.84-9.36), 7.40 (6.88-7.96), 31.12 (29.11-33.26). Row 7: Model 2, hazard ratio (95% CI): Reference, 4.11 (3.75-4.50), 2.83 (2.62-3.07), 11.33 (10.54-12.18).
All hazard ratios compared with the persistent-low group (reference): all p < 0.001. Model 1: unadjusted. Model 2: adjusted for baseline covariates including SMI category, age at index date, gender, ethnicity, IMD quintile, BMI category, smoking status, alcohol misuse, drug misuse, clinical consultation frequency, referral to mental health services and medication use (first-generation antipsychotics, second-generation antipsychotics, antidepressants, anxiolytics, hypnotics, antihypertensives, antidiabetics and drugs for obstructive airway disease). IQR, interquartile range; SMI, severe mental illness; IMD, Index of Multiple Deprivation; BMI, body mass index.
The progression of the 17 CCI conditions across each trajectory group is shown in Supplementary Fig. 6. Patients in the persistent-low group maintained a low, stable prevalence for all conditions throughout the follow-up period. The persistent-high group exhibited slower disease progression, but maintained a higher prevalence of malignancy and chronic pulmonary disease. In the increase-stable group, an upward trend occurred shortly after the index date, followed by a plateau; this pattern was driven largely by increases in the prevalence of malignancy and chronic pulmonary disease. Notably, the rapid-increase group showed a sharp rise in disease prevalence, particularly for malignancy and metastatic solid tumours.
Association between baseline clinical variables and identified trajectory membership
Baseline characteristics differed significantly across the four trajectory groups, with the exception of second-generation antipsychotic use (Supplementary Table 7). Regarding median age at index date, patients in the increase-stable (61.80 years, IQR 50.03–72.97), persistent-high (67.35 years, IQR 54.11–77.28) and rapid-increase (67.54 years, IQR 54.62–78.96) groups were substantially older than those in the persistent-low group (41.64 years, IQR 30.84–54.22), although the age ranges overlapped across four groups. A multinomial logistic regression model was fitted to identify baseline indicators of trajectory membership and showed good discriminative performance, with an overall AUC of 0.78 (Supplementary Fig. 7). The results indicated that older age (≥65 years) and the use of medications for hypertension, diabetes and obstructive airway disease were particularly strong indicators of belonging to a higher-risk trajectory group, with odds ratios of ≥1.5 for each of the three high-risk groups compared with the persistent-low group (Fig. 2; Supplementary Table 8). Current smoking, alcohol misuse, being overweight or obese and referral to mental health services were also significant indicators for three high-risk trajectory groups. Additionally, frequent clinical consultation was associated with the persistent-high and increase-stable groups, and higher deprivation was associated with the rapid-increase group.
Baseline indicators of estimated comorbidity trajectories by multinomial regression model, using backward stepwise selection (reference group: persistent low). BMI, body mass index; IMD, Index of Multiple Deprivation; SGAs, second-generation antipsychotics; SMI, severe mental illness.

Fig. 2 Long description
Panel A: A scatter plot with error bars showing odds ratios for various factors related to severe mental illness. The horizontal axis represents the odds ratio with a 95 percent confidence interval, ranging from 0 to 10. The vertical axis lists different factors such as age, ethnicity, smoking status, BMI category, alcohol misuse, drug misuse, clinical consultation frequency, referral to mental health services, medication use, and SMI category. Three groups are represented: Increase-stable, Persistent-high, and Rapid-increase, each with distinct markers and error bars. The Increase-stable group is marked with blue circles, the Persistent-high group with green circles, and the Rapid-increase group with red circles. The data points show varying odds ratios for each factor, with some factors like age at index date having higher odds ratios compared to others.
Sensitivity analysis
Using a simple count of 24 conditions as an alternative comorbidity measure, a similar 4-class solution with comparable trajectory shapes and class proportions was identified. The rapid-increase group remained the highest-risk group (adjusted hazard ratio 9.09, 95% CI 8.46–9.77), followed by the persistent-high (adjusted hazard ratio 5.04, 95% CI 4.65–5.46) and increase-stable (adjusted hazard ratio 4.86, 95% CI 4.46–5.29) groups (Supplementary Fig. 8; Supplementary Tables 9–11). The relative ordering of these two intermediate-risk groups differed from the primary analysis, likely reflecting the distinction between severity-weighted and unweighted multimorbidity measures.
After multiple imputation of missing baseline data, adjusted hazard ratios were 4.01 (95% CI 3.66–4.40), 2.85 (95% CI 2.63–3.08) and 11.64 (95% CI 10.83–12.51) for the increase-stable, persistent-high and rapid-increase groups, respectively. The multinomial logistic regression model showed similarly good discriminative performance (overall AUC 0.78) and identified the same set of indicator variables, with only minimal changes in odds ratios (Supplementary Tables 12 and 13; Supplementary Figs 9 and 10).
Discussion
To the best of our knowledge, this is the first study to examine physical comorbidity burden trajectories and their association with all-cause mortality among patients with SMI in primary care. Using JLCM, we identified four distinct CCI-defined comorbidity trajectories following the first primary care recording of SMI, each associated with a different level of mortality risk. Several baseline characteristics were significantly associated with trajectory membership, offering potential indicators for early patient stratification and targeted intervention. Reference Foster, Hill, OSullivan and Hancock27
In our cohort, the persistent-low group comprised 89.9% of patients and maintained a CCI value of 0–1 throughout the 10-year follow-up, with the highest survival rate among all trajectory groups. This aligns with a UK primary care cohort study reporting that most patients with SMI had a low physical multimorbidity burden during the 5 years following diagnosis. Reference Launders, Kirsh, Osborn and Hayes28 Although the CCI does not capture several prevalent conditions in this population, our sensitivity analysis using a more comprehensive measure covering 24 chronic conditions identified a similar proportion (82.3%) in this group, suggesting that the trajectory structure is robust to the choice of multimorbidity measure.
In contrast, a much smaller proportion of patients (5.1%) fell into the persistent-high group, characterised by a consistently elevated CCI of around 4 throughout the follow-up period. This group had a higher mortality risk than the persistent-low group even after adjustment for potential confounders, consistent with evidence that a greater burden of pre-existing physical comorbidities is associated with increased mortality among patients with schizophrenia. Reference Chan, Wong, Yung, Chen and Chang29 Studies in the general older population have also identified a trajectory characterised by persistently high multimorbidity levels. Reference Lee, Joo, Chai and Jun30 In the sensitivity analysis, this group accounted for 8% of the sample, suggesting that a more comprehensive multimorbidity measure captures additional long-term conditions. Patients in this group were older at the index date, and their elevated baseline CCI likely reflects the higher prevalence of chronic conditions associated with ageing rather than factors specific to SMI. Reference St Sauver, Boyd, Grossardt, Bobo, Finney Rutten and Roger31,Reference De Hert, Correll, Bobes, Cetkovich-Bakmas, Cohen and Asai32 Their elevated mortality risk likely reflects the persistent burden of pre-existing comorbidities rather than the development of new conditions during follow-up. The use of antihypertensives, antidiabetics and drugs for obstructive airway disease was notable in this group, consistent with the higher frequency of annual consultations, reflecting greater clinical management needs. A higher proportion of patients had alcohol misuse, which may be explained by the established link between alcohol consumption and various chronic conditions. Reference Stewart and McCambridge33 However, this group had a lower proportion of current smokers and overweight/obese individuals at baseline, which may partly account for the minimal progression of multimorbidity over time.
The remaining two trajectory groups (increase-stable and rapid-increase groups) had similar baseline CCI values of approximately 1, but demonstrated different progression trends and mortality risks, consistent with studies in other populations that have identified distinct upward multimorbidity trajectories. Reference Lee, Joo, Chai and Jun30,Reference Strauss, Jones, Kadam and Jordan34 Compared with the persistent-low group, mortality risk was approximately 4 times as high in the increase-stable group and roughly 11 times as high in the rapid-increase group, which had the highest mortality risk. This suggests that when evaluating the impact of physical comorbidity burden on adverse outcomes, it is important to consider not only the baseline burden, but also its progression over time. Patients in both groups were older at the index date (median 61.8 and 67.5 years, respectively) than those in the persistent-low group (median 41.6 years), consistent with evidence that individuals diagnosed with SMI at an older age tend to have a greater number of physical conditions in the post-SMI period. Reference Wang, Bendayan, Msosa, Pritchard, Roberts and Stewart9 Both groups also had a higher proportion of current smokers and were less likely to be referred to mental health services, which may reflect challenges in timely access to psychiatric care that could, in turn, worsen physical health. Reference Halstead, Sartorius, Every-Palmer, Siddiqi, de Girolamo and Siskind35,Reference Harald, Peltonen and Laatikainen36 Notably, patients in the rapid-increase group were more likely to live in more deprived areas, potentially facing greater barriers to healthcare and healthy lifestyle options. Reference Liu, Daumit, Dua, Aquila, Charlson and Cuijpers37 They also had fewer clinical visits than the increase-stable group despite a similar baseline comorbidity level, suggesting that active engagement with primary care may help stabilise the progression of long-term conditions. Furthermore, the sharp rise in metastatic solid tumours observed in the rapid-increase group likely contributed to its elevated mortality and warrants further investigation in SMI populations. Reference Mani, Deng, Lin, Wang, Hsu and Zaorsky38 However, further investigation is necessary to clarify the effects of mental illness severity and antipsychotic dosage on the rate of physical deterioration.
Health trajectories are strongly age-associated, and we acknowledge that age is likely to have contributed to the observed class separation, particularly given the substantial difference in median age between the persistent-low group and the other high-risk trajectory groups. The identified classes should therefore be interpreted as descriptive, age-related patterns of CCI-defined comorbidity burden, as they manifest after entry into primary care management, rather than as age-independent biological subtypes. Although mortality differences persisted after adjustment for baseline age and other covariates, this does not exclude the possibility that the latent classes largely reflect differences in life-course stages at the index date. Consequently, using the younger persistent-low group as a reference category primarily serves to contrast different levels of observed clinical burden within the cohort. Future studies using larger linked data-sets are needed to examine whether similar trajectory patterns emerge within narrower age subgroups, which would help to further disentangle age-related progression from age-independent comorbidity accumulation.
Our study has several strengths. First, it drew on a large sample of patients with SMI from the THIN primary care database, which has been validated for epidemiological research. Second, routinely collected primary care data enabled an extended follow-up period with sufficient repeated measurements to characterise the evolution of trajectories. Third, the application of JLCM allowed classification to be informed by both CCI trajectories and survival process, thereby reducing bias from informative censoring which can affect conventional group-based trajectory models. However, several limitations should be noted. First, our study relied exclusively on routinely collected primary care data from the THIN database, which introduces several interrelated constraints. The index date may not correspond to the true onset of SMI, as some individuals are likely to have been diagnosed in secondary care before primary care recording; our cohort therefore represents the point of entry into active primary care management. Conditions documented only in secondary care or in GP free text may have been missed, and patients with shorter registration periods may have had comorbidities underrecorded, potentially underestimating the true comorbidity burden. Second, the THIN database does not provide practice-level or regional identifiers because of its anonymisation protocols, preventing the incorporation of area-level random effects; although IMD adjustment partially captures geographical variation, residual confounding by unmeasured area-level factors cannot be excluded. Third, the CCI does not capture several prevalent conditions in this population; however, our sensitivity analysis using a broader 24-condition measure yielded a comparable trajectory structure. Future work could develop a severity-weighted index with broader condition coverage for SMI populations. Fourth, the requirement for at least 1 year of post-index follow-up may have excluded the highest-risk patients who died or transferred out shortly after the index date, potentially underestimating early mortality. Finally, as an observational study, we cannot infer causality. Covariates were measured only at baseline, leaving potential for residual confounding and reverse causation. Missing baseline data, particularly BMI and smoking status, are unlikely to be missing at random, as recording may be influenced by clinical need, which may have introduced residual bias.
In conclusion, our study identified marked heterogeneity in CCI-defined comorbidity trajectories, which were associated with substantially different mortality risks among patients with SMI in primary care. Importantly, the baseline clinical indicators associated with higher-risk trajectories – including older age, smoking and prescriptions for hypertension, diabetes and obstructive airway disease – are routinely collected in primary care. In England, the QOF-mandated annual SMI physical health checks provide a feasible opportunity for risk stratification without introducing additional assessments. Patients likely to follow high-risk trajectories could potentially be prioritised for more intensive physical health monitoring or targeted lifestyle interventions. However, it is important to note that the trajectory groups identified represent latent statistical classifications within this cohort rather than validated clinical phenotypes; future research with larger cohorts, longer follow-up and linked primary and secondary care data is warranted to refine age-specific trajectory patterns and evaluate the clinical effectiveness of stratified care approaches in this vulnerable population.
Supplementary material
The supplementary material is available online at https://doi.org/10.1192/bjp.2026.10764
Data availability
The data supporting this study’s findings are derived from the THIN database. These data are not publicly available due to licence restrictions. Access can be obtained from the authors with permission from THIN (the data provider).
Acknowledgements
This work uses data provided by patients and collected by the National Health Service as part of their care and support.
Author contributions
H.L. conceived and designed the study, performed data extraction and analyses, and drafted and revised the manuscript. W.D., S.S. and X.H. examined the statistical analyses. R.D.S. formulated the research question and supervised the research process. T.D. and S.A. reviewed and edited the manuscript. All authors contributed to interpreting the findings and approved the final manuscript for submission.
Funding
This work was supported by the University of Macau, including through a PhD scholarship awarded to H.L. R.D.S.’s research was supported by an internal grant from the Faculty of Medicine, University of Macau.
Declaration of interest
S.A. is a member of the British Journal of Psychiatry Editorial Board, but did not take part in the review or decision-making process of this paper. The other authors declare no conflicts of interest.


 Open access


eLetters
No eLetters have been published for this article.