Evidence suggests that current educational approaches with Latinos are not improving outcomes in reading (US Department of Education, 2011). Since 1975 there has been a consistent gap in reading scores on the National Assessment of Educational Progress between White and Latino students at ages 9, 13, and 17 (US Department of Education, 2011), and reading scores on the National Assessment of Educational Progress have remained essentially the same for Latinos from 2003 to 2011. This gap is of significant concern to educators and policymakers alike (e.g., Garcia & Miller, Reference Garcia and Miller2008) as the US Latino population is expected to nearly triple from 47 million in 2008 to 133 million by 2050 (US Census Bureau, 2010). Latinos are already the largest population of individuals who speak a language other than English at home, and they represent the largest minority population in the United States (US Census Bureau, 2010).
Early intervention is one promising approach to improving equity in educational outcomes, with one recent report suggesting that bilingual preschool programs have the potential to close one-fifth to one-third of the overall Hispanic–White achievement gap in reading in the early years of schooling (Garcia & Jensen, Reference Garcia and Jensen2009). Bilingual education focuses on providing native language content instruction while teaching English, a model based in large part on significant evidence that native language instruction for dual language learners (DLLs) supports improved academic and reading achievement in English (August & Shanahan, Reference August and Shanahan2006; Goldenberg, Reference Goldenberg and Neuman2008; Rolstad, Mahoney, & Glass, Reference Rolstad, Mahoney and Glass2005; Slavin & Cheung, Reference Slavin and Cheung2005). However, additional research is needed to refine the development of bilingual programs (Cárdenas-Hagan, Carlson, & Pollard-Durodola, Reference Cárdenas-Hagan, Carlson and Pollard-Durodola2007; Tong, Irby, Lara-Alecio, & Mathes, Reference Tong, Irby, Lara-Alecio and Mathes2008), especially research that focuses on preschoolers and the relationship of language of instruction to kindergarten readiness (Ballantyne, Sanderman, & McLaughlin, Reference Ballantyne, Sanderman and McLaughlin2008).
The few preschool studies that do exist suggest that Spanish language instruction improves the early literacy development and school readiness of young Spanish-speaking DLLs without significant cost to their English language development (Barnett, Yarosz, Jung, & Blanco, Reference Barnett, Yarosz, Thomas, Jung and Blanco2007; Campos, Reference Campos, García and McLaughlin1995; Durán, Roseth, & Hoffman, Reference Durán, Roseth and Hoffman2010; Farver, Lonigan, & Eppe, Reference Farver, Lonigan and Eppe2009). For example, Barnett and colleagues compared the achievement levels of native Spanish-speaking children randomly assigned to English-only (EO; n = 62) and two-way immersion (TWI; n = 85) preschool programs, with children in the TWI program rotating each week between English and Spanish instruction. The TWI classrooms also included students from diverse native languages backgrounds, with the classes being composed of 35% native English speakers, 66% native Spanish speakers, and 7% speakers of other native languages. For the Spanish-speaking children, the largest TWI program effect was on Spanish receptive vocabulary, although Spanish-speaking children also scored higher on other measures of early literacy development, including Spanish rhyming and English phoneme deletion. There were no reported differences on other English measures. While the study did not follow the children into kindergarten, these preliminary findings suggested that TWI may be a viable alternative to traditional EO models because it supports the continued development of the early language and literacy skills in Spanish that have been found to be predictive of reading achievement in English (August & Shanahan, Reference August and Shanahan2006; Cárdenas-Hagan et al., Reference Cárdenas-Hagan, Carlson and Pollard-Durodola2007).
One explanation for the relationship between early literacy skills in Spanish and English is the mounting evidence that there is a cross-linguistic transfer of phonological awareness skills between Spanish and English (Cárdenas-Hagan et al., Reference Cárdenas-Hagan, Carlson and Pollard-Durodola2007; Cisero & Royer, Reference Cisero and Royer1995). Phonemic awareness skills are thought to transfer specifically between Spanish and English because of similarities between the alphabet, orthography and phonemic representations of the two languages (Bialystok, Luk, & Kwan, Reference Bialystok, Luk and Kwan2005; Cárdenas-Hagan et al., Reference Cárdenas-Hagan, Carlson and Pollard-Durodola2007; Kuo & Anderson, Reference Kuo and Anderson2010; Restrepo & Gray, Reference Restrepo and Gray2007). For example, Leafstedt and Gerber (Reference Leafstedt and Gerber2005) demonstrated that early phonological awareness skills in Spanish, defined as onset and rime, and late phonological awareness skills, defined as segmentation and blending, exhibited cross-linguistic transfer in Spanish speakers learning to read in English. Other researchers have found similar relationships between Spanish and English literacy and language development (Dickinson, McCabe, Clark-Chiarelli, & Wolf, Reference Dickinson, McCabe, Clark-Chiarelli and Wolf2004; Durgunoğlu, Nagy, & Hancin-Bhatt, Reference Durgunoğlu, Nagy and Hancin-Bhatt1993; Lindsey, Manis, & Bailey, Reference Lindsey, Manis and Bailey2003; López & Greenfield, Reference López and Greenfield2004; Manis, Lindsey, & Bailey, Reference Manis, Lindsey and Bailey2004). Providing an alternative view, Castilla and colleagues argue that predictive relationships found in bilinguals between phonological awareness, grammatical, and semantic skills are largely the result of general language learning abilities rather than cross-linguistic transfer (Castilla, Retrepo, & Perez-Leroux, Reference Castilla, Restrepo and Perez-Leroux2009). This view implies that the same underlying language skills that lead to variation in monolingual populations also serve as determinants of second language (L2) acquisition.
It is important that, even amid the theoretical debate about cross-linguistic transfer and the role of cognitive differences in moderating bilingual literacy and language development, the majority of researchers continue to advocate first language (L1) early literacy instruction. Castilla and colleagues (Reference Castilla, Restrepo and Perez-Leroux2009) summarize this point:
For the child who is predicted to succeed, L1 education continues to be irreplaceable, as the child's L2 will take years to catch up to the same levels, and there is no justification for delaying literacy development until a child reaches sufficient L2 development to support the acquisition of literacy skills. For the child who may seem unremarkable within a classroom setting but whose L1 test scores predict slower acquisition of the L2, L1 education may be the only door to a successful literacy experience. (p. 577)
To date, only one experimental, longitudinal study has compared Spanish and EO instruction in Head Start preschool programs. Durán et al. (Reference Durán, Roseth and Hoffman2010) randomly assigned 31 Spanish-speaking preschoolers to either an EO preschool classroom or an experimental transitional bilingual education (TBE) model developed by the researchers. During the first year of the study, all TBE instruction was conducted in Spanish while in the EO condition all instruction was conducted in English. In this community, EO instruction was representative of current practice and therefore served as a “business as usual” comparison. The results from Year 1 suggest that TBE instruction offered an advantage over EO on measures of Spanish receptive and expressive vocabulary and letter–word identification. There were no significant differences between TBE and EO instruction on these same measures in English. Durán et al.'s (Reference Durán, Roseth and Hoffman2010) results are consistent with other preschool and school-age findings (e.g., Barnett et al., Reference Barnett, Yarosz, Thomas, Jung and Blanco2007; Campos, Reference Campos, García and McLaughlin1995; Farver et al., Reference Farver, Lonigan and Eppe2009; Oller & Eilers, Reference Oller and Eilers2002) and support the view that preschool instruction in Spanish does not hinder English literacy and language development. This paper reports Year 2 results of Durán et al.'s (Reference Durán, Roseth and Hoffman2010) TBE intervention model.
The TBE model was chosen because it allowed us to provide a full 1.5 years of instruction in Spanish and then gradually introduce English during the second year of the study. Because evidence suggests that supporting native language development supports the best academic outcomes (Rolstad et al., Reference Rolstad, Mahoney and Glass2005), our team wanted to maximize the amount of native language instruction offered while recognizing the reality that these preschoolers were likely to attend EO kindergartens. We therefore adapted an early-exit TBE school-age program into this preschool TBE model (Rolstad et al., Reference Rolstad, Mahoney and Glass2005).
The present manuscript examines whether 2-year growth trajectories in preschoolers’ language and early-literacy development differ between predominantly English (PE) and TBE instructional conditions. While there is no published research on the optimal ratio between two languages in a transitional bilingual model for preschoolers, a ratio of 30:70 English-to-Spanish was chosen because 90:10 and 80:20 splits did not seem sufficient and 60:40 and 50:50 splits seemed closer to a dual language approach than TBE. Thus, the 30:70 ratio was thought to provide enough opportunity for TBE preschoolers to become familiar with basic English (e.g., classroom instructions) without compromising the quality or quantity of early literacy instruction. In the PE classroom, Spanish was introduced in response to parent requests that some Spanish be introduced into the classroom and the ratio of 70:30 chosen to ensure comparabililty to the TBE classroom.
The study's specific research questions were as follows:
-
1. Did the TBE and PE classrooms differ in terms of instructional and classroom quality and the fidelity of instructional language use?
-
2. Did the 2-year growth trajectories in language and literacy differ as a function of instructional language (i.e., TBE vs. PE classrooms) and year (i.e., Year 1 vs. Year 2)?
-
3. If there was evidence of variation by instructional language and/or year, were these differences conditional on instructional language?
METHOD
Participants
This study was conducted in a small Head Start program located in a rural, working-class Minnesota town offering employment opportunities in meat packing, livestock management, and food processing. The Latino population in Minnesota has increased by 166% over the last 10 years, with nearly 20,000 Spanish-speaking migrant families moving to rural areas each year (Kohnert, Kennedy, Glaze, Kan, & Carney, Reference Kohnert, Kennedy, Glaze, Kan and Carney2003). Two of the five total preschool classes at the Head Start site participated in this study, with the only native Spanish-speaking teacher agreeing to provide instruction in Spanish and the English language teacher selected on the basis of being the most highly qualified of the remaining four teachers. All children in these two classrooms participated in the study and all were Spanish speaking.
Preschoolers
During the summer immediately preceding Year 1 of the study, 31 Spanish-speaking preschoolers were recruited (ages 38–48 months; M = 43.43, SD = 3.27) and then randomly assigned to either experimental TBE (n = 15) or PE (n = 16) conditions. Researchers received Institutional Review Board approval and gained informed consent from families through trained family home service providers who discussed the study with parents while intake paperwork was being completed. Parents were informed that participation was completely voluntary and that once the child was enrolled in the study they would be randomly assigned to the PE or TBE condition. The PE condition represented status quo in this community and therefore no native language services were withheld from these children. Instead, the TBE classroom was an innovation in the community. Because space in the TBE classroom was limited, the Head Start administration agreed to random assignment as an unbiased method of deciding who would be assigned to the TBE and PE classrooms.
Preschoolers remained in the TBE or PE condition for the study's duration, and all 31 preschoolers returned for the study's second year, the focus of the present report. At time of enrollment, preschoolers were identified as Spanish-speaking based on (a) Head Start intake forms indicating that Spanish was spoken in the home, and (b) The Family Language Background Survey (adapted from Durán, Reference Durán2008) indicating that the child receptively understood Spanish and expressively used Spanish in the home setting with some primary care providers (e.g., mother, father, aunts, grandparents, cousins, and siblings). Thus, both simultaneous and sequential bilingual preschoolers were identified as Spanish speaking, while children who may have passively heard some Spanish at home were excluded from the study. Based on the information from the Family Language Background Questionnaire only two families from the TBE group reported some English language usage in the home, while five reported some English language in the PE classroom. Ninety-four percent of families claimed Mexico as their country of origin, with one family from Guatemala and another from El Salvador. All children qualified under Head Start poverty guidelines. Parents’ educational attainment was low, with 52 (84%) of the 62 parents reporting they had not completed high school, and only 10 parents reporting they had completed high school or received a GED.
Teachers
In the experimental TBE condition, the native bilingual Spanish-speaking teacher was a licensed early childhood teacher with an associate degree in child development and 7 years experience before Year 1. This teacher grew up in the United States, but her home language was Spanish. In the comparison PE condition, the teacher was a monolingual English-speaking, licensed early childhood teacher with a baccalaureate degree in early childhood education and 9 years experience before Year 1. Both classrooms also had a native Spanish-speaking instructional assistant, but in the PE setting the bilingual assistant used only English. Both assistants began using English upon arrival in the United States as adolescents. One teaching assistant had 2 years of experience and the other had 4 years of experience as a teaching assistant.
Both teachers and the assistants were provided with training in dual language acquisition, effective instructional strategies for DLLs, early literacy development, and dialogic reading in a half-day workshop and during regularly scheduled research meetings led by the first and third authors. Teachers were given training in dialogic reading and early literacy practices through two sources: the teacher training video for the Read Together, Talk Together early literacy curriculum, which focuses on dialogic reading strategies, and on-site early literacy coaching and technical assistance through the “Words Work!” program funded by the St. Paul Foundation. The Words Work! literacy coach had a BA degree in Spanish and was participating in AmeriCorps. She did not have a background in education but was trained by the Words Work! staff. She rotated between several sites and spent 1 day a week for 1 hr in each classroom.
The research meetings were conducted once a month for about 1.5 hr after the school day. These meetings included ongoing training on effective instructional strategies, such as using visual symbols and manipulatives in instruction, intentional vocabulary instruction, such as using word walls, embedding target vocabulary throughout the day, phonological awareness activities, and dialogic reading. These meetings also provided opportunities for regular contact between the teachers and the research team to reinforce the procedures specified in the research plan. Teaching assistants participated in approximately half of the research meetings, as dictated by their personal availability and limited funding for overtime compensation.
Independent variable
The independent variable was instructional language, with the experimental condition being TBE and the comparison condition being PE instruction. In the experimental TBE condition, during Year 1 it was required that all classroom instruction, communication, and materials be presented solely in Spanish. In Year 1, the comparison condition was an EO instructional environment with no Spanish language usage in the EO setting. In Year 2, all instruction remained in Spanish during the first half of the school year in the TBE classroom and all instruction remained in English in the PE classroom. During this second year more English as a L2 teaching strategies were incorporated, such as using visuals and manipulatives to support instruction, using total physical response, and being intentional in teaching vocabulary. In January, however, English was gradually introduced in the TBE classroom until a ratio of 30% English to 70% Spanish was achieved during mid-February. Spanish was introduced in the PE classroom until the ratio of 30% Spanish to 70% English was reached. Introducing English into the TBE setting and Spanish into the PE classroom involved teachers’ switching classrooms, with the PE teacher using English in the TBE classroom and the TBE teacher using Spanish in the PE classroom. This approach was based on both practical and evidence-based considerations. Based on research on interlocutor sensitivity in bilingual children (e.g., Pettito et al., Reference Pettito, Katerelos, Levy, Guana, Tétreault and Ferraro2001), there was concern about the Spanish-speaking teacher suddenly switching to using English. We also wanted to discourage code switching during other parts of the day. Staffing constraints also prevented hiring an additional teacher solely for English language time in the TBE setting.
The research team decided on a 30:70 ratio in consideration of the amount of time left in the school year after the switching began in January. It was necessary to gradually introduce English in the Spanish setting so as not to upset the flow of instruction and to reduce the possibility of causing distress to children who were Spanish dominant. An abrupt change in the language of instruction may have resulted in a dramatic decrease in their ability to communicate during their school day. There is also not a significant amount of empirical evidence that provides guidance as to how much of each language is optimal in bilingual preschool settings. We therefore developed a plan that best met the needs of the children and the program.
In January, during the first phase of introducing English in the TBE classroom, the PE and TBE lead teachers switched rooms during snack time and English was initially used to facilitate social conversation. In order to gradually transition to English it was decided that snack time would be a less demanding time to begin to introduce English. Gradually, a whole-group dialogic reading session was added to support vocabulary acquisition (Whitehurst et al., Reference Whitehurst, Arnold, Epstein, Angell, Smith and Fischel1994). Narrative books were selected that were available in both Spanish and English. In both conditions, teachers used the prompt, evaluate, expand, and repeat (PEER) and completion, recall, open-ended questions, wh-questions, and distancing (CROWD) prompt sequences recommended in dialogic reading. During the English dialogic reading sessions the teacher adapted the level of questioning to the child's ability level in English. No Spanish was used, but the teacher was instructed to use the PEER sequence, completion prompts, and the simpler wh-questions (such as who and what) from the CROWD sequence with students with lower levels of English proficiency and to use the higher level CROWD sequence questions with children who had higher levels of proficiency in English. The rationale for this approach was that children with lower English proficiency may have difficulty responding to recall, open-ended questions, and more difficult wh-questions, which required a more elaborated response in English. During Spanish instructional times, children were challenged with these higher level questions. During mid-February, a brief early literacy activity related to book reading was also added to achieve the final ratio of 30:70. Follow-up literacy activities including rhyming, alliteration, emergent writing, and story retelling. The 30:70 ratio was then maintained throughout the remainder of the school year (total = 3 months). Both teachers maintained a log of the times and dates they switched classrooms and the activities that took place during the switching.
Procedures
Every effort was made to keep instructional objectives and materials consistent between the TBE and PE classrooms. For example, the teachers followed the same sequence of themes throughout the year, arranged their classrooms in a similar layout, similar toys and materials, and similar daily activities. Teachers also maintained the same daily schedules, including breakfast, opening circle, calendar, center time, free choice, another large circle, and outside or gym time. Both classrooms used the Creative Curriculum (Dodge, Colker, & Heroman, Reference Dodge, Colker and Heroman2002) and the “Second Step” curriculum (The Committee for Children, 2002) for social skills instruction.
In terms of early literacy instruction, teachers read to the children every day both in large and small groups, and books were selected so that English and Spanish versions could be used in the respective classrooms. In addition to the structured reading times built into the schedule, the teacher and assistant in both the PE and TBE classrooms sometimes read to the children during free play. During Year 2, this Head Start program was also selected as a scaling up site for “Words Work!,” a program providing a bilingual literacy coach to the site and professional development opportunities focused on early literacy instruction. The bilingual literacy coach used only Spanish in the TBE classroom and only English in the PE classroom.
All children also received monthly 1.5-hr home visits following standard Head Start protocol. In the PE comparison, these visits were conducted primarily in English, except for instances when paperwork needed to be completed. Home visits were conducted in English simply because of staffing constraints and the inability of the agency to fund interpreters for home visits, even when the teacher did not share a language with the family. This was standard practice in this rural area. In contrast, in the TBE condition, home visits were conducted in Spanish because the teacher could speak Spanish. Both PE and TBE home visits emphasized early literacy and other school readiness activities, including book reading, writing activities, exposure to letter names and sounds, and shape and color activities. Both PE and TBE teachers also provided families with the “Read Together Take-Home Packs” developed by Lakeshore. These materials were provided in the language requested by families, which was primarily Spanish.
Experimental check
The study incorporated three assessments of teacher–classroom quality. First, to confirm that the PE and TBE conditions were implemented correctly, a graduate research assistant videotaped each classroom on six separate occasions across the school year. Focal sampling (Pellegrini, Symons, & Hoch, Reference Pellegrini, Symons and Hoch2004) was used, with each child randomly selected for a 10-min observation period, resulting in 6 hr of focal sampling video footage across the PE and TBE classrooms. After the school year concluded, the first author and a doctoral research assistant, who was not aware of the study's design, evaluated the video footage for teacher, paraprofessional, and child-to-child language use using a researcher-developed coding system. The lead author is a native Spanish speaker and coded the video footage from the TBE setting. The graduate assistant had an intermediate level of Spanish ability and could detect when a child or teacher was speaking Spanish in the PE setting. During each 10-min segment, the coder tallied each instance of child-to-child or teacher-to-child English use in the TBE classroom and each instance of Spanish use in the PE classroom. Coding captured both child-to-child and teacher-to-child use of the nontarget language.
Second, an Early Language and Literacy Classroom Observation (ELLCO; Smith, Brady, & Anastasopoulos, Reference Smith, Brady and Anastasopoulos2008) was completed in the fall and spring by the “Words Work!” literacy coach, who was not involved in this study. The ELLCO is a 2.5-hr classroom observation rating system measuring the quality of language and literacy supports in the classroom environment. The five core items on the ELLCO include organization of the classroom, curriculum integration, oral language facilitation, the presence and use of books, and embedded print and early writing.
Third, the observational Classroom Assessment Scoring System (CLASS; Pianta, La Paro, & Hamre, Reference Pianta, Paro and Hamre2008) was used to measure classroom quality. Used as a federal monitoring tool for all Head Start sites, CLASS provides an assessment of classroom quality in terms of instructional and emotional support. Two observers (a doctoral research assistant and the first author), both CLASS trained and certified, coded three 20-min videotaped observations of the EO and TBE classrooms recorded during the fall, winter, and spring terms. Video observations were recorded during large-group book readings, snack times, small-group early literacy groups, transitions, and free play. CLASS involves rating nine dimensions on a 7-point scale ranging from 1 or 2 (low), 3, 4, or 5 (middle), and 6 or 7 (high). Average interrater reliability between the observers was κ = 0.84.
Dependent variables
There were four dependent variables, each assessed in English and Spanish: receptive vocabulary, expressive vocabulary, letter–word identification, and phonological awareness. Measures of both expressive and receptive vocabulary were included because young bilingual children have been shown to vary in their skills in each of their languages across each domain (Kohnert & Bates, Reference Kohnert and Bates2002; Kohnert, Bates, & Hernandez, Reference Kohnert, Bates and Hernandez1999).
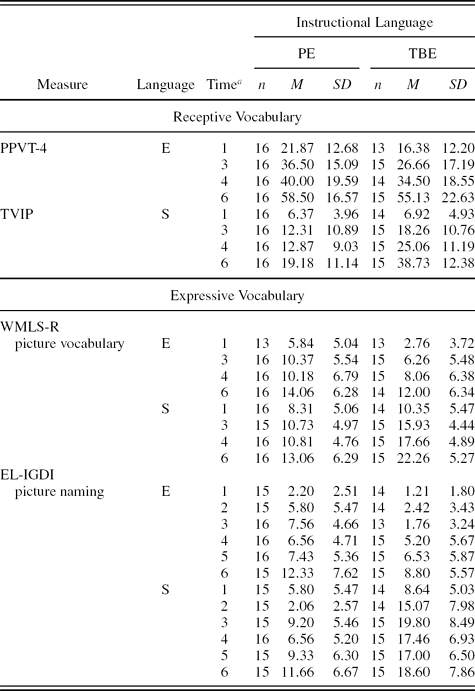
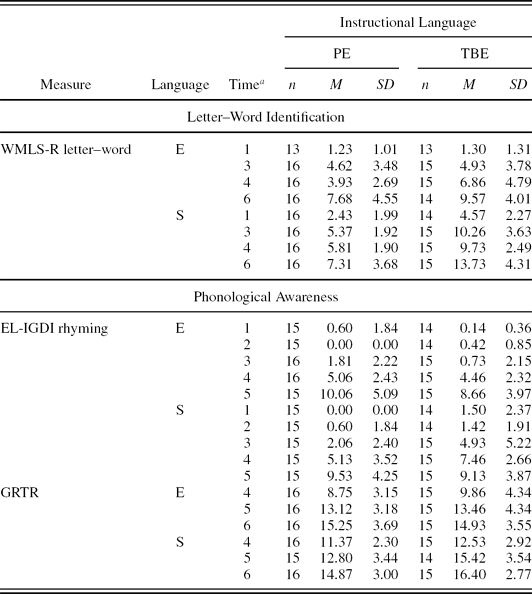
All dependent variables were assessed at the beginning (September–October) and end of the school year (April–May), with the exception of the Early Literacy-Individual Growth and Development Indicators (EL-IGDIs; McConnell, Priest, Davis, & McEvoy, Reference McConnell, Priest, Davis, McEvoy, Thomas and Grimes2002) and Get Ready to Read (GRTR; Whitehurst & Lonigan, Reference Whitehurst and Lonigan2001), which were administered three times during the year with the midpoint data collection occurring in January. All measures were also administered in both English and Spanish during specified periods of time. Occasional student absences accounted for variation in the specific number of students who completed each measure (see Table 1 and Table 2). English measures were administered by the first author and one graduate research assistant, and Spanish measures were administered by the third author, two certified community interpreters, and one Spanish-speaking Head Start staff member. The counterbalancing of assessments was attempted, but given the limited availability of data collectors, the travel time to the research site, and the frequency of absences in the participants, it became extremely difficult to ensure that the order of language assessments was systematically alternated. At no point, however, was the same instrument in English and Spanish administered to the same child on the same day. During the assessments, examiners only used the examination language with the child.
Receptive and expressive vocabulary: Descriptive statistics

Note: PE, Predominantly English; TBE, transitional bilingual education; PPVT-4, Peabody Picture Vocabulary Test, Fourth Edition; TVIP, Test de Vocabulario en Imagenes Peabody; WMLS-R, Woodcock–Muñoz Language Survey—Revised; EL-IGDI, Early Literacy-Individual Growth and Development Indicators; E, English; S, Spanish.
a Time metric corresponds with school year, so 1, 2, 3 = Year 1 fall, winter, spring and 4, 5, 6 = Year 2 fall, winter, spring, respectively.
Letter–word identification and phonological awareness: Descriptive statistics

Note: PE, Predominantly English; TBE, transitional bilingual education; WMLS-R, Woodcock–Muñoz Language Survey—Revised; E, English; S, Spanish; EL-IGDI, Early Literacy-Individual Growth and Development Indicators; GRTR, Get Ready to Read.
a Time metric corresponds with school year, so 1, 2, 3 = Year 1 fall, winter, spring and 4, 5, 6 = Year 2 fall, winter, spring, respectively.
Receptive vocabulary
Children's receptive vocabulary was assessed using the Peabody Picture Vocabulary Test (PPVT-4; Dunn & Dunn, Reference Dunn and Dunn2007) and the Spanish version Test de Vocabulario en Imagenes Peabody (TVIP; Dunn, Lugo, Padilla, & Dunn, Reference Dunn, Lugo, Padilla and Dunn1986). In both the PPVT-4 and TVIP, children are asked to point to the picture that shows the particular (spoken) word from a set of four alternatives. The PPVT-4 positively correlates with other measures of linguistic and cognitive development related to school success. The PPVT-4 has an internal consistency reported as Spearman–Brown split half reliability at 0.94 and test–retest reliability at 0.93. The TVIP uses 125 translated items from the PPVT-R (Dunn & Dunn, Reference Dunn and Dunn1981) and internal consistency reliability is reported to be 0.91 to 0.94. Although neither of these assessments includes Spanish–English bilinguals in the normative samples, these were the only measures of receptive vocabulary available in Spanish and English for use with 3-year-olds at the time this study was initiated. These measures were also used in a larger study comparing TWI to EO preschool instruction (Barnett et al., Reference Barnett, Yarosz, Thomas, Jung and Blanco2007).
Expressive vocabulary
Expressive vocabulary was assessed using the picture vocabulary subtest of the Woodcock–Muñoz Language Survey—Revised (WMLS-R; Alvarado, Ruef, & Schrank, Reference Alvarado, Ruef and Schrank2005) and the picture naming EL-IGDI (English: McConnell, et al., Reference McConnell, Priest, Davis, McEvoy, Thomas and Grimes2002; Missal & McConnell, Reference Missall and McConnell2004; Spanish: Pickart, Sheran, Betts, & Heistad, Reference Pickart, Sheran, Betts and Heistad2006). The picture vocabulary subtest of the WMLS-R is designed to measure oral language in English and Spanish as children are asked to name the pictures presented in the stimulus book. The WMLS-R includes Spanish–English bilinguals in the United States in the standardization sample. Reliability coefficients for the picture vocabulary subtest are reported to be 0.91 for 4-year-olds and 0.90 for 5-year-olds (Alvarado et al., Reference Alvarado, Ruef and Schrank2005).
The administration of picture naming EL-IGDI involves asking children to name as many pictures as possible in 1 min from a stack of stimulus cards. Research with the EL-IGDIs has demonstrated evidence of reliability and validity, and sensitivity to age and intervention (Cadigan & Missall, Reference Cadigan and Missall2007; McConnell et al., Reference McConnell, Priest, Davis, McEvoy, Thomas and Grimes2002; Missall, McConnell, & Cadigan, Reference Missall, McConnell and Cadigan2006; Missall et al., Reference Missall, Reschly, Betts, McConnell, Heistad and Pickart2007; Phaneuf & Silberglitt, Reference Phaneuf and Silberglitt2003). They have also been used effectively to predict later reading difficulties with Spanish speakers in the upper Midwest region of the United States (Sheran et al., 2006).
Letter–word identification
Letter–word identification was assessed using the letter–word identification subtest of the WMLS-R. Children are asked to match a series of letters, and the test becomes progressively more difficult as the child is asked to point to letters and words as they are named. Reliability coefficients for the letter–word identification subtest are reported at 0.92 and 0.97, respectively (Alvarado et al., Reference Alvarado, Ruef and Schrank2005).
Phonological awareness
Phonological awareness was assessed using the rhyming EL-IGDI and the Get Ready to Read! screeners (Whitehurst & Lonigan, Reference Whitehurst and Lonigan2001). The administration of rhyming EL-IGDI involves presenting a child with a series of four pictures. At the top is a picture depicting the stimulus word (e.g., “bees”) and under the stimulus picture is a row of three other randomly ordered pictures (e.g., “house,” “pants,” “cheese”) with one correct and two incorrect responses. For each card, the examiner points to and says the name of each picture then asks the child to “Point to the picture that sounds the same as the top picture.” A child's scores is the number of correctly identified rhymes in 2 min. Previous research on rhyming provides evidence of validity and reliability with English speakers (e.g., McConnell et al., Reference McConnell, Priest, Davis, McEvoy, Thomas and Grimes2002; Missall & McConnell, Reference Missall and McConnell2004; Missall et al., Reference Missall, McConnell and Cadigan2006). and the Spanish version is currently embedded in the Beginning Kindergarten Assessment for Minneapolis Public Schools (Sheran et al, 2006).
The English Get Ready to Read! (E-GRTR) and Spanish Get Ready to Read! (S-GRTR) screeners (Whitehurst & Lonigan, Reference Whitehurst and Lonigan2001) were developed to identify young children at risk for later reading problems. They include 20 items that measure a child's phonological awareness (initial sound alliteration, rhyming, syllable and phoneme blending, and initial syllable elision), print awareness, and knowledge of letter names and sounds. The screener is completed in approximately 10 min and involves children pointing to the appropriate picture or letter once a verbal prompt has been delivered by the examiner (e.g., “Find the letter that makes a tuh sound”). The GRTR was selected as a measure of early literacy for this study because it was the only published early literacy screener available at the time of this study in Spanish and English for use with 4-year-olds that had published data regarding the reliability and validity of both the English and Spanish versions (Farver, Nakamoto, & Lonigan, Reference Farver, Nakamoto and Lonigan2007).
Data analysis
Following modern recommendations for developmental longitudinal data analysis (e.g., Fitzmaurice, Laird, & Ware, Reference Fitzmaurice, Laird and Ware2004; Jeličić, Phelps, & Lerner, Reference Jeličić, Phelps and Lerner2009), we used linear mixed models (LMMs) with correlated error terms for all data analyses. Unlike traditional methods of longitudinal data analysis such as repeated measures analysis of variance (ANOVA) and multivariate analysis of variance (MANOVA), LMMs accommodate missing data by using maximum likelihood based estimation procedures and the predicted Yi values to impute missing values for Yi (Fitzmaurice et al., Reference Fitzmaurice, Laird and Ware2004, chap. 4). LMMs also allow researchers to examine whether early literacy growth trajectories differ as functions of multiple covariates. For example, in this study the static (nontime varying) covariate instructional language was incorporated into the analysis to examine whether linear trend (i.e., slopes) differed between Year 1 and Year 2 and to test whether variation in linear trend was conditional on instructional language. LMMs can be viewed as multilevel models with individual- and group-level equations, with Level 1 describing individual growth trajectories using fixed effects (e.g., intercept, slope) and Level 2 describing variability in individual growth trajectories using random effects.
To estimate parameters and test statistics, the restricted maximum likelihood method, the Kenward and Roger (Reference Kenward and Roger1997) method for degrees of freedom, and a significance level (α = 0.05) were used in the PROC MIXED procedure of SAS 9.2. Selecting an appropriate variance–covariance structure was based on the procedure of Fitzmaurice et al. (Reference Fitzmaurice, Laird and Ware2004, chap. 7), with the comparison (not presented) of deviance and fit statistics (e.g., –2 log likelihood, Akaike information criterion, Bayesian information criterion) suggested that the random effects model had the best fit. Normal probability plots were used to screen residuals for violations of assumptions and outliers.
RESULTS
Tables 1 and 2 report descriptive statistics for all early literacy outcomes, including the number of participants used in the analysis of each measure. Across the school year, 4 of 31 students (3 from TBE and 1 from PE) had missing data, resulting in only 12 missing (1.3%; TBE = 5, PE = 7) out of 868 total data points. Visual inspection of conditional residual plots supported the statistical validity of results.
Instructional and classroom quality
The first research question asked whether instructional and classroom quality differed between TBE and PE classrooms. Using a series of nonparametric sign tests, results showed no statistically significant differences between the TBE and PE classrooms on any measure (CLASS ps = .25–1.0; ELLCO ps = .06–1.0). These results support the view that classrooms were comparable across a range of quality indices and, accordingly, classroom quality measures were not included in subsequent model building.
Fidelity of instructional language use was examined next. During the fall term, results showed only three safety-related Spanish statements in the PE classroom from a paraprofessional to a child and, in the TBE classroom, there was no evidence of teachers or paraprofessionals using English. As expected, these patterns changed during the spring term with the onset of language switching. Spring term results showed 20 min of teacher and paraprofessional use of Spanish in the PE classroom and 22 min of teacher and paraprofessional use of English in the TBE classroom. Results also showed more evidence of child-to-child Spanish language use in the PE setting than child-to-child English language use in the TBE setting. Child-to child Spanish language usage in the PE classroom was recorded in 20 of the 36 video segments, whereas child-to-child English language usage in the TBE classroom was recorded in only 3 video segments.
During the spring term and with the onset of language switching, teachers also kept logs of the time they used the L2 and the corresponding activities. Logs indicated that, beginning on January 5, L2 use involved 20-min snack sessions and then, beginning on January 20, small group dialogic reading sessions followed by snack (total time = 30 min). Beginning on February 2, the total time of L2 use increased to 45 min (or ~30% of the preschool day) and included activities such as book reading, literacy activities related to the book reading, and snack sessions.
Early literacy outcomes
The second and third research questions asked whether 2-year growth trajectories differed between TBE and PE classrooms, and whether this difference was conditional on instructional language. Analyses used the conditional linear spline models of the form
 \begin{equation}
Y_{ij} = \beta _1 + \beta _{2i} t_{ij} + \beta _3 (t_{ij} - t^{\ast} ) + \beta _4 X_i + \beta _5 X_i t_{ij} + \beta _6 X_i (t_{ij} - t^{\ast} ),
\end{equation}
Receptive vocabulary
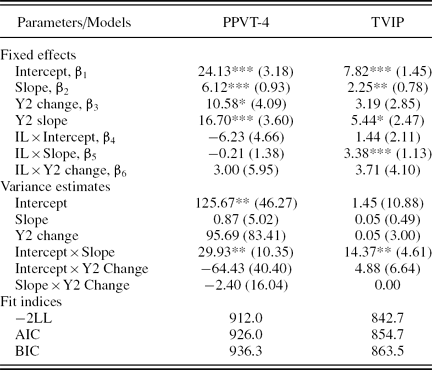
As reported in Table 3 and displayed in Figure 1, both the slope term, β2, and the Year 2 change in slope term, β3, were positively statistically significant for PPVT-4, while only the slope term was positively statistically significant for TVIP models. This indicates that both PPVT-4 and TVIP mean scores increased across both years, but only linear growth in PPVT-4 increased again during Year 2. For the TVIP model only, the slope interaction term, β5, was also positively statistically significant, indicating that TBE offered an advantage over PE for TVIP growth. This is displayed in Figure 1b by the increasing separation between TBE and PE mean scores and, by spring of Year 2, corresponded to a 64% difference favoring TBE (Year 2 spring predicted means: PE = 20.02, TBE = 38.73).
Receptive vocabulary: Year 1 and Year 2 growth trajectories

Note: Standard errors are in parentheses. Residual variances were estimated for the intercept, slope, and Y2 change. Residual covariances were estimated for intercept–slope, intercept–Y2 change, and slope–Y2 change. PPVT-4, Peabody Picture Vocabulary Test, Fourth Edition; TVIP, Test de Vocabulario en Imagenes Peabody; Y2, Year 2; IL, instructional language; –2LL, –2 log likelihood; AIC, Akaike information criterion; BIC, Bayesian information criterion.
†p < .10. *p < .05. **p < .01. ***p < .001.
Year 1 and 2 growth trajectory comparison of receptive and expressive vocabulary. Predicted mean growth trajectories comparing transitional bilingual education (TBE) and predominantly English (PE) classrooms’ receptive and expressive vocabulary scores. For the Test de Vocabulario en Imagenes Peabody, linear growth was greater for TBE compared to PE. (b) This is displayed by the increasing separation between TBE and PE scores over time. (a) There were no significant differences between PE and TBE classrooms for the Peabody Picture Vocabulary Test, Fourth Edition. There were significant differences between TBE and PE for Year 1 fall term means for both English and Spanish Woodcock–Muñoz Language Survey—Revised (WMLS-R) and Early Literacy-Individual Growth and Development Indicators (EL-IGDI) picture naming scores. (c–f) This is displayed by the slight separation favoring PE over TBE for English measures and TBE over PE for Spanish measures. Significant differences favoring TBE over PE were also found in Year 1 linear growth in Spanish WMLS-R and EL-IGDI picture naming mean scores, even controlling for initial differences in Year 1 fall term scores. (d, f) This is diplayed by the increasing separation between TBE and PE scores over time. Finally, during Year 2, linear growth in Spanish EL-IGDI picture naming decreased for TBE compared to PE. (f) This is displayed by the decreasing TBE slope during Year 2.

For the random effects, the intercept variance estimate was statistically significant for the PPVT-4 model only, indicating there was individual variation around Year 1 fall term mean scores. The intercept-slope covariance estimates were also positively statistically significant for both PPVT-4 and TVIP models. This indicates that above average variability in Year 1 fall term PPVT-4 and TVIP mean scores was associated with above average variability in linear growth.
Expressive vocabulary
ENGLISH
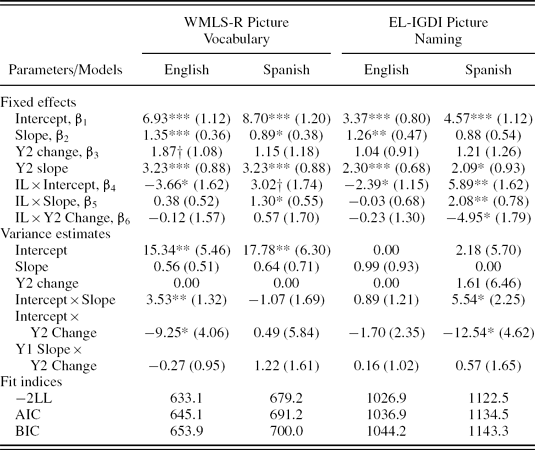
As reported in Table 4 and displayed in Figure 1, the slope terms, β2, were positively statistically significant for both English WMLS-R and EL-IGDI picture naming models. This indicates that English WMLS-R and EL-IGDI picture naming mean scores increased across both years. The intercept interaction term, β4, was also negatively statistically significant for both English WMLS-R and EL-IGDI picture naming models, indicating that English WMLS-R and EL-IGDI picture naming Year 1 fall term mean scores were smaller for TBE compared to the PE classroom. This is displayed in Figures 1c and 1e by the slight separation favoring PE over TBE growth trajectories and, by spring of Year 2, corresponded to a 17% difference favoring PE (Year 2 spring predicted means: PE = 14.23, TBE = 11.97). Likewise, for English EL-IGDI picture naming, this initial difference corresponded to a 30% difference favoring PE (Year 2 spring predicted means: PE = 11.77, TBE = 8.72).
Expressive vocabulary: Year 1 and Year 2 growth trajectories

Note: Standard errors are in parentheses. Residual variances were estimated for the intercept, slope, and Y2 change. Residual covariances were estimated for intercept–slope, intercept–Y2 change, and slope–Y2 change. WMLS-R, Woodcock–Muñoz Language Survey—Revised; EL-IGDI, Early Literacy-Individual Growth and Development Indicators; Y2, Year 2; IL, instructional language; Y1, Year 1; –2LL, –2 log likelihood; AIC, Akaike information criterion; BIC, Bayesian information criterion.
†p < .10. *p < .05. **p < .01. ***p < .001.
For the random effects, the variance estimate for Year 1 intercept was statistically significant for English WMLS-R picture vocabulary models only, indicating there was individual variation around Year 1 fall term mean scores. Both the intercept–slope and intercept–Year 2 change covariance estimates were also statistically significant for English WMLS-R picture vocabulary models. The positive intercept-slope covariance estimate indicated that above average variability in Year 1 fall term English WMLS-R picture vocabulary mean scores was associated with above average variability in linear growth. In contrast, the negative intercept–Year 2 change covariance estimate indicated that variability in the Year 1 fall term English WMLS-R picture vocabulary mean was associated with below average variability in linear growth.
SPANISH
As reported in Table 4 and displayed in Figure 1, the slope term, β2, was positively statistically significant for the Spanish WMLS-R picture vocabulary models, indicating that mean scores increased across both years. The intercept interaction term, β4, was positively statistically significant for Spanish WMLS-R picture vocabulary and marginally statistically significant (p < .10) for Spanish EL-IGDI picture naming, indicating that Spanish WMLS-R and EL-IGDI picture naming Year 1 fall term mean scores were greater for TBE compared to PE. This is displayed in Figures 1d and 1f by the slight separation favoring TBE over PE growth trajectories. The slope interaction term, β5, was also positively statistically significant for both Spanish WMLS-R and EL-IGDI picture naming, even after controlling for initial intercept differences. This indicates that linear growth was greater for TBE compared to PE and is displayed in Figure 1d and 1f by the dramatically increasing separation favoring TBE over PE growth trajectories and, by spring of Year 2, corresponded to a 49% difference favoring TBE (Year 2 spring predicted means: PE = 13.45, TBE = 22.26). For Spanish EL-IGDI picture naming, the different growth trajectories corresponded to a 43% difference favoring TBE (Year 2 spring predicted means: PE = 11.39, TBE = 17.80). Unexpectedly, for Spanish EL-IGDI picture naming, the Year 2 change interaction term, β6, was negatively statistically significant. As displayed in Figure 1f, this indicates that TBE linear growth for Spanish EL-IGDI picture naming decreased during Year 2.
For the random effects, the intercept variance estimate was statistically significant for the Spanish WMLS-R picture vocabulary model only, indicating there was individual variation around Year 1 fall term mean scores. For the Spanish EL-IGDI picture naming model only, both the intercept–slope and intercept–Year 2 change covariance estimates were statistically significant. The intercept–slope covariance estimate indicated that above average variability in Year 1 fall term Spanish EL-IGDI picture naming mean scores was associated with above average variability in linear growth. In contrast, the intercept–Year 2 change covariance estimate indicated that variability in Year 1 fall term Spanish EL-IGDI picture naming mean scores was associated with below average variability in linear growth.
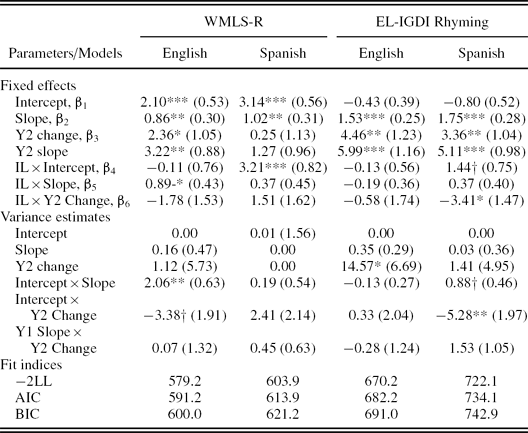
Letter–word identification
As reported in Table 5 and displayed in Figure 2, the slope terms, β2, were positively statistically significant for all models, indicating that both English and Spanish WMLS-R letter–word mean scores increased across both years. For English WMLS-R letter–word only, the Year 2 change term, β3, was positively statistically significant, indicating that linear growth in English WMLS-R letter–word mean scores increased during Year 2. Unexpectedly, the slope interaction term, β5, was also positively statistically significant for English WMLS-R letter–word only, indicating that linear growth in English WMLS-R letter–word mean scores was greater for TBE compared to PE. This is displayed in Figure 2a by the slight separation favoring TBE over PE growth trajectories and, by spring of Year 2, corresponded to a 19% difference favoring TBE (Year 2 spring predicted means: PE = 7.92, TBE = 9.58).
Year 1 and 2 growth trajectory comparison of early literacy skills. Predicted mean growth trajectories comparing transitional bilingual education (TBE) and predominantly English (PE) classrooms’ Woodcock–Muñoz Language Survey—Revised (WMLS-R) letter–word and phonological awareness scores. Linear growth in English WMLS-R letter–word mean scores was greater for TBE than PE. (a) This is displayed by the slight separation favoring TBE over PE. For Spanish WMLS-R letter–word, Year 1 fall term Spanish WMLS-R letter–word mean scores were greater for TBE compared to PE. (b) This is displayed in by the separation favoring TBE over PE. It is interesting that, for Spanish Early Literacy-Individual Growth and Development Indicators rhyming only, linear growth decreased during Year 2 for TBE compared to PE. (d) This is displayed by the sharp increase in PE mean scores after Year 2 fall. (e, f) Neither English nor Spanish GRTR means scores differed between PE and TBE classrooms.

Letter–word identification and phonological awareness (rhyming): Year 1 and Year 2 growth trajectories

Note: Standard errors are in parentheses. Residual variances were estimated for the intercept, slope, and Y2 change. Residual covariances were estimated for intercept–slope, intercept–Y2 change, and slope–Y2 change. WMLS-R, Woodcock–Muñoz Language Survey—Revised; EL-IGDI, Early Literacy-Individual Growth and Development Indicators; Y2, Year 2; IL, instructional language; Y1, Year 1; –2LL, –2 log likelihood; AIC, Akaike information criterion; BIC, Bayesian information criterion.
†p < .10. *p < .05. **p < .01. ***p < .001.
For Spanish WMLS-R letter–word, the intercept interaction term, β4, was positively statistically significant, indicating that Year 1 fall term Spanish WMLS-R letter–word mean scores were greater for TBE compared to PE. This is displayed in Figure 2b by the separation favoring TBE over PE growth trajectories and, by spring of Year 2, corresponded to a 59% difference favoring TBE (Year 2 spring predicted means: PE = 7.51, TBE = 13.73).
For the random effects, the intercept–slope covariance estimates were also positively statistically significant for the English WMLS-R letter–word model, indicating that above average variability in Year 1 fall term English WMLS-R letter–word mean scores was associated with above average variability in linear growth. Interestingly and only for the English WMLS-R letter–word model, the intercept and Year 2 change covariance estimates were negatively marginally ( p < .10) statistically significant. This indicates that above average variability in Year 1 fall term English WMLS-R letter–word mean scores was associated with below average variability in Year 2 change in linear growth.
Phonological awareness
EL-IGDI RHYMING
As reported in Table 5 and displayed in Figure 2, both the slope terms, β2, and the Year 2 change terms, β3, were positively statistically significant for all English and Spanish EL-IGDI rhyming models. This indicates that English and Spanish EL-IGDI rhyming mean scores increased across both years, and that linear growth also increased during Year 2. For Spanish EL-IGDI rhyming, the intercept interaction term, β4, was positively marginally ( p < .10) statistically significant. While this indicates that the Year 1 fall term mean score was greater for TBE compared to PE, the predicted means displayed in Figure 2 only correspond to an approximate 1-point advantage for TBE (Year 1 fall predicted means: PE = 0.00, TBE = 0.63). Also for Spanish EL-IGDI rhyming only, the Year 2 change interaction term, β6, was negatively statistically significant, indicating that Year 2 change in linear growth was smaller for TBE compared to PE, even after controlling for initial intercept differences. This is displayed in Figure 2d by the sharp increase in PE mean scores after Year 2 fall.
For the random effects, the variance estimate for Year 2 change was statistically significant for the English EL-IGDI rhyming model only, indicating there was individual variation around Year 2 change in linear growth. The intercept–slope covariance estimate was negatively statistically significant for the Spanish EL-IGDI rhyming model only, indicating that above average variability in Year 1 fall term Spanish EL-IGDI rhyming mean scores was associated with above average variability in linear growth.
E-GRTR/S-GRTR
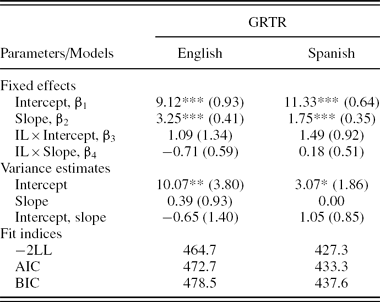
Finally, because the E-GRTR/S-GRTR measures of phonological awareness were only used during Year 2, the spline components were removed from Equation 1 and conditional linear growth models were fit using the following LMM:
 \begin{equation}
Y_{ij} = \beta _1 + \beta _2 t_{ij} + \beta _3 X_{ij} + \beta _4 X_{ij} t_{ij} ,\end{equation}
As reported in Table 6 and displayed in Figure 2, the slope terms, β2, were positively statistically significant for both English and Spanish GRTR models, indicating that mean scores increased across Year 2. However, neither the instructional language effect on the intercept term, β3, nor the instructional language effect on slope term, β4, were statistically significant for any GRTR measure. This indicates that growth trajectories for Year 2 English and Spanish GRTR means scores did not differ between PE and TBE classrooms. For the random effects, the intercept variance estimate was statistically significant for both English and Spanish GRTR models, indicating that there was individual variation around Year 2 fall term mean scores.
Phonological awareness (GRTR): Year 2 growth trajectories

Note: Standard errors are in parentheses. Residual variances were estimated for intercept and slope, and residual covariances were estimated for intercept–slope. GRTR, Get Ready to Read; IL, instructional language; –2LL, –2 log likelihood; AIC, Akaike information criterion; BIC, Bayesian information criterion.
*p < .05. **p < .01. ***p < .001.
DISCUSSION
This paper reports Year 2 results of a longitudinal experimental-control study comparing the effects of TBE with PE education on the language and literacy outcomes of 31 randomly assigned Spanish-speaking preschoolers in a Head Start program. During Year 1, the two classrooms differed only in the language of instruction, with teachers using only Spanish in the TBE classroom and only English in the control classroom. There was no cross-linguistic instruction. During Year 2, beginning in January, English was gradually introduced in the TBE classroom until a ratio of 30:70 English-to-Spanish was achieved.
The study's first goal was to address concerns about internal validity by examining the extent to which Year 2 TBE and PE classrooms offered equivalent instructional and classroom quality. Results showed no evidence of statistically significant classroom differences on the CLASS (Pianta, et al., Reference Pianta, Paro and Hamre2008) and ELLCO (Smith, et al., Reference Smith, Brady and Anastasopoulos2008) measures and also confirmed the fidelity of instructional language use, with video-coding and teachers’ logs indicating that teachers only used Spanish and English language in accord with their instructional condition and the language switching protocol. These findings strengthen confidence in the study's inference that change in preschoolers’ language and literacy development may be attributed to the effects of instructional language in the TBE and PE conditions.
Early literacy outcomes
The second and primary goal of the study was to examine whether the TBE classroom offered an advantage over the PE classroom on early literacy outcomes. In general, Year 2 results were consistent with the first and thus provide additional evidence that TBE in preschool is a promising approach to enhancing Spanish language and literacy development among US Latino DLLs who are growing up in poverty.
Receptive and expressive vocabulary
Results provided evidence of strong gains in the TBE condition for Spanish receptive and expressive vocabulary. There was no significant difference between Year 1 and 2 growth on Spanish receptive vocabulary. This indicates that linear growth begun in Year 1 continued at the same rate in Year 2, even with the gradual introduction of English during Year 2. The maintenance of growth in Spanish receptive and expressive vocabulary is important, both as a foundation for English language acquisition and to avoid the loss of home language that is often documented in this population (Anderson, Reference Anderson and Goldstein2012). This is a meaningful difference as children's loss of home language because of a rapid transition to English can reduce meaningful communication between families who primarily speak Spanish and their young children (Anderson, Reference Anderson and Goldstein2012).
There was no evidence of similar gains by PE over TBE on English measures of receptive or expressive vocabulary. There was, however, evidence that linear growth in English receptive vocabulary increased during Year 2 compared to Year 1 and that this change during Year 2 did not vary between the TBE and PE conditions. There was also evidence of statistically significant variability for English receptive vocabulary. The significant variance estimate indicated that there was individual variation around Year 1 fall term PPVT-4 scores, and the significant covariance estimate indicated that above average variability in Year 1 fall term PPVT-4 scores was associated with above average variability in linear growth. At a minimum, these variance components point to unexplained variability in preschoolers’ English receptive vocabulary and are consistent with literature suggesting that young bilinguals vary in their English language ability based on the timing and the amount of exposure they have had (Bialystok, Reference Bialystok2001; Kovelman, Baker, & Petitto, 2008). Research involving larger sample sizes is needed to examine this variability in greater detail.
There was evidence of an interaction effect between instructional language and change in Year 2 linear growth for EL-IGDI picture naming, with Year 2 growth declining relative to Year 1 for the TBE classroom only. It should be noted, however, that this decrease in linear growth did not undermine the absolute differences favoring TBE over PE, as the previously highlighted 6-point advantage occurred despite the decrease in growth. It may be that there is a ceiling for EL-IGDI picture naming, such that TBE scores in Spanish approached an upper limit during Year 2 while the scores of the children in the PE program still had room to improve.
There was no evidence of a similar growth advantage for PE over TBE on English measures of expressive vocabulary. However, there was a significant difference favoring PE over TBE on Year 1 fall term mean scores of English WMLS picture vocabulary and EL-IGDI picture naming. This initial difference did not result in large absolute differences in growth; by spring-term of Year 2, the PE advantage only corresponded to an approximate 2-point advantage for PE in mean WMLS picture vocabulary, and an approximate 3-point advantage in mean EL-IGDI picture naming. This finding highlights an important issue about this study: despite being small and underpowered, the Year 1 and Year 2 results provide consistent evidence that any differences between PE and TBE education on English literacy and language development are likely very small and that TBE advantages over PE on Spanish literacy and language appear to be quite robust.
Building on this last point, this study also provides strong rationale for conducting larger scale research comparing TBE and PE early intervention models. While gains in Spanish receptive and expressive vocabulary may be attributed to Spanish language instruction, it remains unknown why the TBE classroom did not offer a disadvantage in English compared to PE. Only two children's parents in the TBE group reported English use in the home, suggesting that English language use in the home is not likely to have contributed to the TBE classroom's mean growth. An alternative explanation may be the effect of exposure to English in the community (Reese, Linan-Thompson, & Goldenberg, Reference Goldenberg and Neuman2008). This study was conducted in a rural town in the Midwest with a small but growing Latino community, and English language surrounded these children anywhere other than at home. Research in other communities with different linguistic configurations might yield different results. For example, children growing up in large Spanish-speaking communities in New York or Los Angeles may not experience the same rate of English growth if they were in a predominantly Spanish language preschool environment. Future research in this area should also include language observations in the home to check the validity of parent report and to identify alternative sources of English language exposure (e.g., television, older siblings, community).
Early literacy skills
Results also provided evidence of strong gains in the TBE condition for both English and Spanish letter–word identification, although the magnitude of the effect was greater for the Spanish measure. The gains made in the TBE classroom in both Spanish and English letter–word identification may also be evidence of cross-linguistic transfer of letter–word identification skills. A caveat here, however, is that there was evidence of significant covariance for English letter–word identification, suggesting that children differ in the extent to which English gains were made.
For phonological awareness, Year 2 results did not show clear evidence of either advantage or disadvantage for TBE over PE education. Instead, in both classrooms on both the Spanish and English EL-IGDI rhyming and GRTR the groups scored nearly equivalently. Such equivalence on measures of phonological awareness may represent another example of the cross-linguistic transfer. For the PE classroom, the Year 2 increase in linear growth on both English and Spanish EL-IGDI rhyming measures may be attributable to the introduction of Spanish early literacy instruction for the second half of the year. Future research involving larger samples is needed to investigate these issues, however, as this study also provided evidence of significant variation in children's English and Spanish EL-IGDI rhyming growth parameters.
More studies are also needed to fully understand the mechanism by which preschool instructional language may affect DLL's early elementary school performance. For example, it may be that different preschool models are better suited to prepare children for different K–6 language environments and that a range of program models and instructional practices may need to be developed based on the linguistic profile and specific features of the bilingual communities they are intended to serve (Branum-Martin, Foorman, Francis, & Mehta, Reference Branum-Martin, Foorman, Francis and Mehta2010).
Limitations
An obvious and significant limitation of this study was the small sample size and associated constraints on generalizability and statistical power. However, the longitudinal design did allow for the analysis of multiple data points over time, and participants were randomly assigned, thereby strengthening confidence in the study's internal validity. As previously discussed, the consistent pattern of results, especially over 2 years of data collection, also lends support to the validity of the findings.
The study's small sample size also limited the level of analysis we were able to undertake. For example, we were not able to compare how simultaneous versus sequential bilinguals performed in each program. Cárdenas-Hagan and colleagues (Reference Cárdenas-Hagan, Carlson and Pollard-Durodola2007) provide evidence that it is important to not only consider the language of instruction when designing programs for DLLs but also the initial language proficiency of each participating child in his/her native language and English. Different program models (e.g., one-way 50:50, TBE, 90:10, or dual immersion) may be better suited for children with specific linguistic backgrounds potentially producing different gains in various populations (Cárdenas-Hagan et al., Reference Cárdenas-Hagan, Carlson and Pollard-Durodola2007; Hammer, Lawrence, & Miccio, Reference Hammer, Lawrence and Miccio2007). It is unfortunate that there were not enough participants in this study to warrant even exploratory analysis of these issues.
Another limitation is the possibility of teacher effects or other classroom variables not directly measured, and replication across more classrooms is needed. In future studies it may be beneficial to have a direct observational measure of child engagement in the two settings, as this may provide a more direct measure of whether child behavior and the quality of teacher–child interactions differs between PE and bilingual educational environments (see Chang et al., 2007). In future research it also would be important to include direct measures of fidelity of implementation of specific instructional strategies that were implemented, such as dialogic reading.
Future research may also utilize more robust measures of classroom language in order to document fidelity to the language condition. For example, in a recent meta-analysis of the efficacy of various approaches to the education of ELLs, Rolstad et al. (Reference Rolstad, Mahoney and Glass2005) noted that studies often arbitrarily label classrooms “bilingual” with no operational definition given of what bilingual entails (Greene, Reference Greene1998; Willig, Reference Willig1985). Currently, there are no research-based measures of the accuracy of program's self-labeling as, for example, a 50:50 dual immersion or 90:10 one-way immersion program. Consequently, in practice there has been no valid or reliable tool for researchers to use to accurately categorize and describe programs by documenting actual language usage in the classrooms. Accurately documenting the description of the treatment and the fidelity of implementation is critical in bilingual intervention research, especially if researchers are to draw strong causal inferences between participation in a specific model of bilingual education and language or academic outcomes (Potowski, Reference Potowski2004). It can be argued that this study made a solid attempt to document language usage, but valid and reliable tools still need to be developed (Durán, Reference Durán2005).
The absence of a direct measure of book reading and the fact that teachers and assistants sometimes read to some children during free play can both be viewed as limitations of this study, as they make it difficult to quantify the exact dosage of literacy experiences in each classroom. We also did not include a direct measure of fidelity of book reading practices. However, both classrooms participated in the “Words Work!” program and were coached by the same literacy specialist, and they adhered to the same routine and schedule. The time allotted to this incidental reading was at least very similar across the two classrooms.
In terms of dosage we also did not examine students’ attendance rates and whether they differed significantly between the classrooms. In future research this will be examined more closely in case significant differences could provide an alternative explanation for the differences found between the groups.
Finally, as mentioned previously, home language and literacy environments may also have a significant impact on young children's language and literacy outcomes (Dickinson & Tabors, Reference Dickinson and Tabors2001; Hart & Risely, 1995). Although a broad measure of the usage of Spanish and English in children's home was completed by each family in this study, without direct measures, the possibility remains that differences in home language and literacy environments may have contributed to differences in children's performance on language and literacy outcomes.
CONCLUSION
Despite these limitations, this study contributes to the literature on bilingual education, early intervention, and language and literacy development in a number of important ways. First, to our knowledge, this is the first and only longitudinal, experimental-control comparison of growth trajectories between Spanish-speaking Head Start preschoolers receiving a full 1.5 years of Spanish language instruction, with the gradual introduction of English in the second year of the program (TBE) to all-English instruction for one with the gradual introduction of Spanish in the second year (PE) instruction. Thus, despite the small sample size, this study provides key data on a promising intervention on a growing, yet understudied, population of children who are at risk for low educational attainment.
Another major contribution is the study's rigorous methodology, as the use of random assignment, a longitudinal, experimental-control design, and systematic documentation of language fidelity all strengthen confidence in the study's results. The ability to provide all-Spanish language instruction during the first year is also a unique feature of this study, as it is very difficult to recruit a site willing to invest in such a model. Another methodological strength is the study's use of modern methods of longitudinal data analysis. Answering a call for research in the field (e.g., Hammer et al., Reference Hammer, Lawrence and Miccio2007, Reference Hammer, Lawrence and Miccio2008), the comparison of developmental trajectories between TBE and PE groups provides much more valuable information than single point comparisons.
Given the rapid population growth of young Spanish speakers living in poverty and a historic pattern of low performance on measures of language and literacy (Tabors, Páez, & López, Reference Tabors, Páez and López2003), the purpose of this study was to identify an evidence-based approach to improving the school readiness of these children. Accordingly, the Year 2 results from this small but robust study provide evidence that a TBE preschool intervention model may be used to prepare students for current kindergarten PE or EO options. Indeed, the increased growth rates exhibited by the children in the TBE classroom in Spanish literacy and language development may provide these children with the advantage they need to overcome the persistent language and literacy gaps documented between White English-speaking and Spanish-speaking children at kindergarten entrance (Durán, Roseth, Hoffman, & Robertshaw, Reference Durán, Roseth, Hoffman and Robertshaw2013; Garcia & Jensen, Reference Garcia and Jensen2009). Year 2 results also suggest that growth in Spanish literacy and language development does not preclude growth in English literacy and language development but may actually promote it. This is a critical finding for policymakers, administrators, and practitioners because, in combination with a growing body of research, it suggests that rapidly transitioning DLLs to PE or EO preschool environments may not be the best approach to improving kindergarten readiness and long-term reading outcomes in English (August & Shanahan, Reference August and Shanahan2006; Barnett et al., Reference Barnett, Yarosz, Thomas, Jung and Blanco2007; Goldenberg, Reference Goldenberg and Neuman2008; Rolstad et al, Reference Rolstad, Mahoney and Glass2005; Slavin & Cheung, Reference Slavin and Cheung2005).