1 Introduction
Recently, user simulation has been widely used in developing spoken dialog systems. Simulated data are used in learning (Janarthanam and Lemon Reference Janarthanam and Lemon2008; Schatzmann and Young Reference Schatzmann and Young2009)and testing (Ai and Weng Reference Ai and Litman2008) statistical dialog managers, building language models in a new application domain (Chung, Seneff and Wang Reference Chung, Seneff and Wang2005), training language generation components (Rieser and Lemon Reference Rieser, Lemon, Krahmer and Theune2010), as well as training (Chung Reference Chung2004), and evaluating (Gordon and Passoneau Reference Gordon and Passoneau2010) language understanding components. As we build different types of user simulations, there comes an increasing need to develop user simulation evaluation measures in order to check whether the quality of user simulations meet our design expectations. Since user simulations are essentially models of human user behaviors, one intuitive way to assess user simulations is to compare simulated user behaviors with human user behaviors to see how well the simulated users mimic human user behaviors. Previous studies (Schatzmann, Georgila and Young Reference Schatzmann, Georgila and Young2005; Rieser and Lemon Reference Rieser and Lemon2006) have proposed different sets of evaluation measures to assess the quality of user simulations. It is shown that these evaluation measures which can be computed from simulation logs automatically are sufficient to discern simulated from real dialogs. However, there is no clear clue on how the results based on these automatic measures reflect human's perception of simulation qualities.
To date, there are few studies that use human judges to directly assess the quality of user simulation. However, we believe that this is a reliable approach to assess the simulated corpora as well as an important step toward developing a comprehensive set of user simulation evaluation measures. First, we can estimate the difficulty of the task of distinguishing real and simulated corpora by knowing how hard it is for human judges to reach an agreement. Second, we can validate the automatic measures by correlating the conclusions drawn from the automatic measures with the human judgments. While previously proposed evaluation measures are shown to be useful in quickly evaluating user simulations without human involvement, the validity of these measures has not been proven yet.
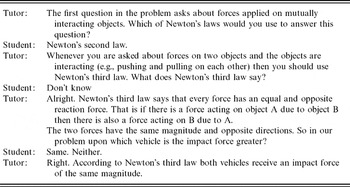
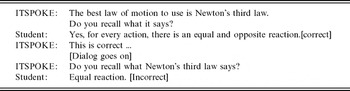
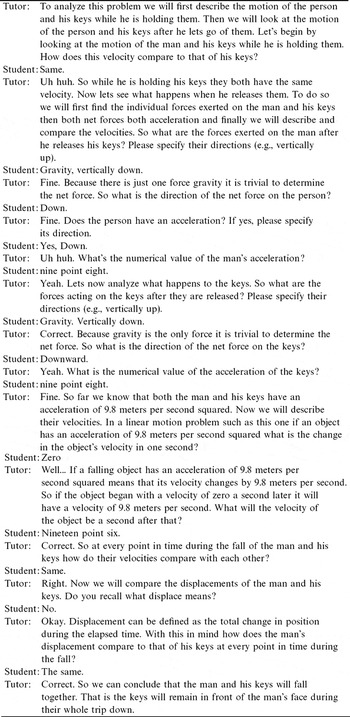
In this paper, we present a human assessment study in which human judges are recruited to assess the quality of three user simulation models. Judges are asked to read the transcripts of the dialogs between a computer tutoring system and the simulation models and to rate the dialogs on a 5-point scale from different perspectives. Judges are also given the transcripts between human users and the computer tutor. An example dialog transcript is given in Table 1.
An example human student and computer tutor dialog transcript used in the human assessment study

We first assess human judges' abilities in distinguishing real from simulated users. We calculate the kappa statistic to show overall agreement among all judges controlling for chance agreement, instead of showing agreements between two specific judges. We find that these ratings give consistent ranking on the quality of the real and the simulated user models (Ai and Litman Reference Ai and Litman2008). Since we did not train the judges in the assessment study, in this paper we further examine the reliability of judges' ratings. We show that judges' ratings are not impacted by the content of the dialogs. As a result, we use the human judges' ratings as the gold standard for automatic evaluation measures.
We apply a set of previously proposed automatic measures to predict human judgments. We show that these measures can be used to build a ranking model to predict human judgments. We suggest that this ranking model can be used to quickly assess the quality of a new simulation model without manual efforts by ranking the new model against the old models (Ai and Litman Reference Ai and Litman2008). However, these measures only capture user behaviors at a given time point, without looking into the mutual impacts among user behaviors at different time points. We hypothesize that characterizing changes of user behaviors along a temporal dimension can model user behaviors even better. Therefore, we develop a measure which aims to utilize time-series analysis to better evaluate user simulations. Although we only implement a simple version of this measure into the ranking model, we observe a significant improvement in predicting simulation qualities more reliably according to human judgments.
The rest of the paper is organized as follows. In Section 2, we review some automatic evaluation measures that were used in prior research in assessing user simulation qualities. In Section 3, we introduce our system, data and user simulation models. In Section 4, we describe the human assessment study and summarize results on human judgments. In Section 5, we build prediction models of human judgments using a set of previously proposed automatic measures. In Section 6, we propose a new evaluation measure which utilizes time-series analysis and show that this measure can be added to better predict human judgments.
2 Previous work
Since user simulations are built to replace human users, one intuition is that a good user simulation should be able to mimic realistic human user behaviors. Such simulation can therefore be used to test dialog systems instead of human users. In fact, several studies have shown that state-of-the-art user simulations can be used to provide reliable objective (Schatzmann et al. Reference Schatzmann, Georgila and Young2005) and subjective measures (Ai and Weng Reference Ai and Weng2008) on dialog system performance. Along this line of research, how to measure the human-likeliness of simulated user behaviors becomes an important problem to solve. Evaluation measures that can be automatically obtained from simulated dialogs are proposed to quickly and repeatedly assess user simulation qualities without human involvement. In this paper, we focus on investigating using both human judges and automatic measures to evaluate simulations that are built to mimic human users. Nevertheless, user simulations are used in many other tasks besides testing dialog system performance. Therefore, another way of evaluating user simulation is in the context of the task in which the simulation is used. For example, Ai, Tetreault and Litman (Reference Ai, Tetreault and Litman2007) look into what kind of user simulation performs better in a dialog strategy learning task. It shows that a simulation that mimics human user behavior is not guaranteed to be the best in this task.
Many studies focus on developing nondomain specific simulation evaluation measures that can be used to assess human-likeliness of simulations used in dialog systems built for different application domains. Rieser and Lemon (Reference Rieser and Lemon2006) propose to evaluate user simulations from three aspects: consistency, completeness, and variation. Consistency evaluates whether a user simulation generates consistent behaviors through out a dialog; completeness evaluates whether a simulation can mimic all kinds of behaviors that a human user can possible produce; variation evaluates whether a simulation covers different variations of human user behaviors. On another dimension, Jung et al. (Reference Jung, Lee, Kim, Jeong and Lee2009) propose to design different metrics to evaluate simulation behaviors at the utterance level and the discourse level. In this paper, we propose a ranking approach to compare different simulation models against each other as well as against human users. We show that this is an efficient way to find the right direction of improving simulation performance without having to develop a comprehensive set of simulation evaluation measures. Basically, by ranking simulation models, we can find the best simulation that is available to use without answering the hard question of how human-like a simulation is.
To date, there are no generally accepted evaluation methodologies to assess how realistic or how human-like a simulated corpus is. Dialog length, goal achievement rate, and goal completion length have been used in previous research (Scheffler and Young Reference Scheffler and Young2001). A comprehensive set of task-independent quantitative evaluation measures is proposed by Schatzmann et al. (Reference Schatzmann, Georgila and Young2005). They consider three groups of measures that can cover the statistical properties of dialogs regardless of the task domain. The first group investigates high level dialog features. These measures look into both how much information is transmitted in the dialog and how active the dialog participants are. The second group of measures analyzes the style of the dialog in terms of the frequency of different speech acts, the proportion of goal-directed and social dialog, and the user's degree of cooperativeness. The last group of measures examines the efficiency of the dialogs using goal achievement rates and goal completion times. As Schatzmann et al. point out, these measures are only introduced to cover a variety of dialog properties for comparing simulated dialogs against real ones but there is no specific range of values to qualify a simulated corpus to be sufficiently realistic.
Since it is hard to draw a single conclusion from the evaluation results based on a group of measures, Williams (Reference Williams2008) takes up the problem of a single quality measure for a user simulation. Williams defined a performance score for each dialog. Then, divergence between the distribution of the scores on the simulated corpus and the distribution on the human user corpus is computed as the measure of the simulation quality. A table of critical values is also given to interpret the statistical significance of comparisons between different corpora. Rieser and Lemon (Reference Rieser and Lemon2006) propose another single measure Simulated User Pragmatic Error Rate (SUPER) to take into account the varying behaviors that the simulation model generates. They argue that the goal of evaluating the quality of a simulated corpus is not to measure how well the simulation models can resemble the behavior of an average user. Instead, the evaluation must cover aspects of naturalness and variety of all human user behaviors. The N-gram based information ordering approach is used in Gandhe and Traum (Reference Gandhe and Traum2008) to evaluate simulation qualities by measuring the coherence of the simulated dialogs. Another way to evaluate discourse quality is to compare the simulated dialogs to human dialogs. Cuayahuitl, Renals and Lemon (Reference Cuayahuitl, Renals and Lemon2005) use the Kullback–Leibler divergence to measure dialog similarity between human and simulated dialogs. A similar approach is used in Janarthanam and Lemon (Reference Janarthanam and Lemon2009) and Jung et al. (Reference Jung, Lee, Kim, Jeong and Lee2009) as well. In addition, Jung et al. (Reference Jung, Lee, Kim, Jeong and Lee2009) also use a discourse BLEU score to measure the similarity at the user intention level.
Although most research efforts are on nondomain specific user simulation evaluation measures, the application domain is an important factor to consider since user behaviors tend to differ in different domain. For example, in the tutoring domain, it is important to simulate users' learning behaviors besides other conversational behaviors. In fact, in Section 6 we show that adding an evaluation measure that captures user learning can better reflect human judgments.
Since evaluations using automatic measures are more time and cost efficient than evaluations with human judges, automatic evaluation measures are widely used in many other natural language processing tasks besides evaluating user simulations, such as the BLEU score (Papineni et al. Reference Papineni, Roukos, Ward and Zhu2002) in machine translation, the ROUGE score (Lin Reference Lin2004) in summarization, and the intrinsic metrics in facial expression generation (Foster Reference Foster2008). More importantly, those automatic evaluation measures are validated by showing that the conclusions drawn from the automatic measures are consistent with conclusions by human judges. Both the BLEU and the ROUGE scores are shown to be highly correlated with human ratings, while the intrinsic metrics rank system outputs in the same order as human preferences. Although automatic evaluation measures are shown to be useful in assessing simulated user behaviors, these measures have not been validated using human judgments. In Section 5, we will validate a group of previously proposed evaluation measures in our task domain.
3 System, data and user simulations
In this section, we introduce our dialog system, the data we collected with human users which are used to train user simulation models, and three different user simulations we built.
3.1 The ITSPOKE dialog system
Intelligent Tutoring SPOKEn dialog System (ITSPOKE) (Litman and Silliman Reference Litman and Silliman2004) is a spoken dialog tutor built on top of the Why2-Atlas text-based conceptual physics tutoring system (Vanlehn Reference VanLehn, Jordan, Roé, Bhembe, Böttner, Gaydos, Makatchev, Pappuswamy, Ringenberg, Roque, Siler, Srivastava and Wilson2002). In each tutoring session, students first read a small document of background physics material, and then work through five problems with the system. The five physics problems are discussed following the same procedure: first a student types an essay answering a qualitative physics question; then a tutoring dialog is initiated by ITSPOKE after analyzing the essay to correct misconceptions and to elicit further explanations. After that, the student revises the essay, thereby ending the tutoring or causing another round of tutoring/essay revision. The Why2-Atlas back-end is responsible for the essay analysis, for selecting the appropriate instruction and for interpreting the student answers. It is manually designed as a finite state automata which performs the function of a dialog manager. However, pedagogical strategies are integrated into the system by utilizing human tutors' knowledge in the dialog manager design. ITSPOKE handles speech input and speech output to this back-end. During the dialogue, student speech is digitized from microphone input and sent to the Sphinx II recognizer (Huang et al. Reference Huang, Alleva, Hon, Hwang and Rosenfeld1993). The text response produced by Why2-Atlas is sent to the Cepstral text-to-speech system and played to the student over headphones or speakers.
3.2 Data and annotation
A corpus of 100 tutoring dialogs was collected between ITSPOKE and 20 college students (solving five physics problems each) as part of a large study that compared speech-based versus typed-based tutoring dialogs (Litman et al. Reference Litman, Rośe, Forbes-Riley, VanLehn, Bhembe and Silliman2006). The correctness of student answers is automatically judged by the system and kept in the system's logs. An annotator also manually tagged the correctness of student answers based on human transcripts. A comparison of the system tagged correctness and the human annotated correctness reaches an agreement of 90 per cent with a Kappa of 0.79 (Rotaru Reference Rotaru2008).
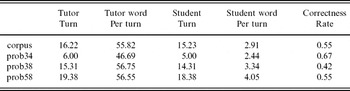
Table 2 summarizes basic statistics on the entire corpus, displaying separately the dialogs on the three out of five problems that are used in this study (explained in Section 4.1). The number of tutor/student turns describes the length of a dialog, as well as the amount of contributions by tutor/student. The tutor/student word per turn describes how much information is included in an utterance. It also measures the tutor/student contribution from a different angle. Correctness rate describes the average of students' performances for a problem. We can see that the dialogs from different problems have different length, different structures (prob34 has a fixed dialog structure while the other two dialogs expand depending on user answers), and different difficulties (shown in correctness rate).
Statistics on human user dialogs

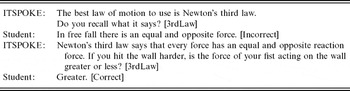
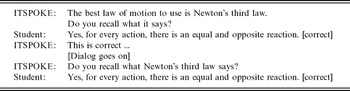
In a previous study (Ai and Litman Reference Ai and Litman2007), we manually clustered tutor questions into 20 clusters based on the knowledge (e.g., acceleration, Newton's 3rd Law) that is required to answer each question. In this way, we can track students' performance on questions requiring similar knowledge to see if students learn to avoid mistakes after the tutoring. Students' learning behaviors are captured in this way in one of the simulation models in Section 3.3. An excerpt of the coded dialog between a human student and ITSPOKE is given in Table 3.
Coded dialog with a human student

3.3 User simulations
We use our corpus of 100 dialogs to build three user simulations for the ITSPOKE system using different probabilistic models. All models are derived from Levin, Pieraccini and Eckert (Reference Levin, Pieraccini and Eckert2000), but mimic human user behaviors to different degrees. Our goal is not to propose new simulation models which outperform previous simulations, but to compare simple probabilistic models on their quality in simulating human-like behaviors. Since our ultimate goal is to use these simulations to help dialog system development, we would like to keep the simulation models as simple as possible. In Ai and Litmen (Reference Ai and Litman2009), we compare these simple probabilistic simulations on different dialog system development tasks. We investigate what type of simulation is appropriate on a specific task, as well as what the basic factors are in constructing probabilistic user simulations. In contrast, the goal of the current paper is to investigate how human-like the simulated behaviors are, which is an important factor to consider when using user simulations for dialog system evaluation (Engelbrecht, Quade and Möller Reference Engelbrecht, Quade and Möller2009).
Most previous user simulations (e.g., Georgila, Wolters and Moore Reference Georgila, Wolters and Moore2008; Schatzmann and Young Reference Schatzmann and Young2009) generate a student's move by outputting an abstract class of a student's act, i.e., a dialog act. However, we generate simulated student utterances on the word level by picking up recognized human student answers from the collected human user dialog corpora. This is because generating student dialog acts alone does not provide sufficient information for our tutoring system to decide the next system action.
3.3.1 Random model (RAN)
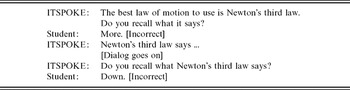
The Random model, as a simple unigram model, randomly picks a student's utterance from the real corpus as the answer to a tutor's question, neglecting which question it is. An excerpt of the simulated corpus by the Random model is given in Table 4. We see that the student answer can be totally irrelevant to the tutor's question in the sample dialog.
Simulated dialog by the Random Model

3.3.2 Correctness model (COR)
The Correctness model is designed to give a correct/incorrect answer with the same probability as the average of real students. For each tutor question, we automatically compute the average correctness rate of real student answers from the system logs. In addition, we put all the real student answers to this tutor question in a candidate answer set. Therefore, when the Correctness model receives a tutor question, it first decides whether to give a correct or incorrect answer based on the computed correctness rate; then, a correct/incorrect answer is randomly chosen from the candidate answer set for this tutor question. This model can be represented as: P(A|Q), where A stands for the simulated student's action of picking a correct/incorrect answer from the candidate answer set and Q stands for the tutor question. We implement a back-off mechanism to count possible answers that do not appear in the real corpus. An excerpt of the simulated corpus by the Correctness model is given in Table 5. Since the simulation model decides the student answer only on the previous tutor question, we can see that the student's answer could be inconsistent across the dialog as shown in the sample dialog.
Simulated dialog by the correctness model

3.3.3 Cluster model (CLU)
The Cluster model ensures that the simulated student behaves more consistently than the Correctness model. As shown in Table 6, the student gains new knowledge in the first part of the dialog and applies the knowledge in the second part of the dialog. More specifically, this model assumes that a student will have a higher chance to give a correct answer to a question which belongs to a cluster of questions in which he/she mostly answers correctly before. It computes the conditional probability of whether a student answer is correct/incorrect given the content of the tutor's question and the correctness of the student's answer to the last previous question that belongs to the same question cluster. This model can be represented as: P(A|KC, c), where A stands for the simulated student's action, KC stands for the knowledge cluster of the tutor's question, and c stands for the correctness of the student's answer to the last previous question that requires the same knowledge. When there is no previous student answer, the answer selection probability is computed as P(A|KC). The Cluster model simulates student learning behaviors in tutorial dialogs.
Simulated dialog by the Cluster Model

Based on our simulation design, we hypothesize that the ranking of the three simulations from the most realistic to the least is: CLU, COR, and RAN.
4 Human assessment study
In this section, we collect human judgments to directly assess the quality of our three user simulations. We first present our experimental design and then summarize our results.
4.1 Study design
We follow the design of (Linguistic Data Consortium 2005) in obtaining human judgments. We first train the three user simulations (RAN, COR, and CLU) from the human student corpus we collected. Each user simulation interacts with the ITSPOKE system 15 times to generate the data of 15 simulated users of each type. We also randomly picked 15 human students from the ITSPOKE corpus to create the real user corpus of the same size as each simulated corpus. We used three out of the five physics problems (Prob34, Prob38, and Prob58Footnote 1 from the ITSPOKE system to ensure the variety of dialog contents while keeping the corpus size small. Therefore, we have four user corpora (one from real users (REAL) and three from simulated users) to compare. In total, the evaluation corpus consisted of 180 dialogs, in which 15 dialogs were generated by each of the four student models on each of the three problems.
We decided to conduct a middle-scale assessment study that involved 30 human judges.Footnote 2 Judges are required to be native speakers of American English to make correct judgments on the language use and fluency of the dialog. They are also required to have taken at least one course on Newtonian physics to ensure that they can understand the physics tutoring dialogs and make judgments about the content of the dialogs. We conducted a small pilot study to estimate how long it took a judge to answer all survey questions (described below in Survey Design) in one dialog because we wanted to control the length of the study so that judges would not have too much cognitive load and would be consistent and accurate on their answers. Based on the pilot study, we decided to assign each judge 12 dialogs which took about an hour to complete. Each dialog was assigned to two judges.
The judges involved in this study did not receive additional training on how to rate the simulated dialogs. Judges are instructed to work as quickly as comfortably possible. They are encouraged to provide their intuitive reactions and not to ponder their decisions. A similar setup is adapted by Walker et al. (Reference Walker, Whittaker, Stent, Maloor, Moore, Johnston and Vasireddy2005) when they collected human judges' ratings on their natural language generator and by DUC on summarization evaluation (http://duc.nist.gov).
4.1.1 Survey design
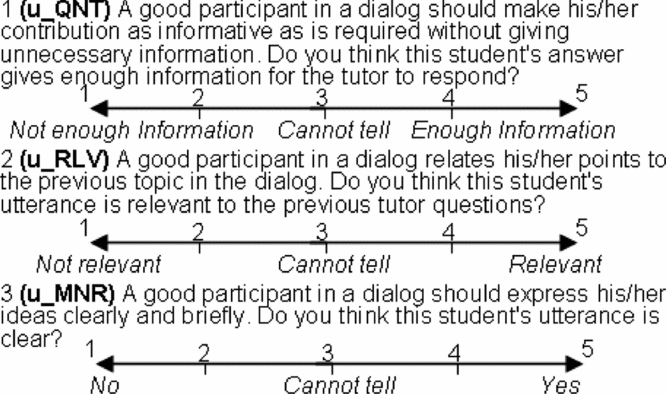
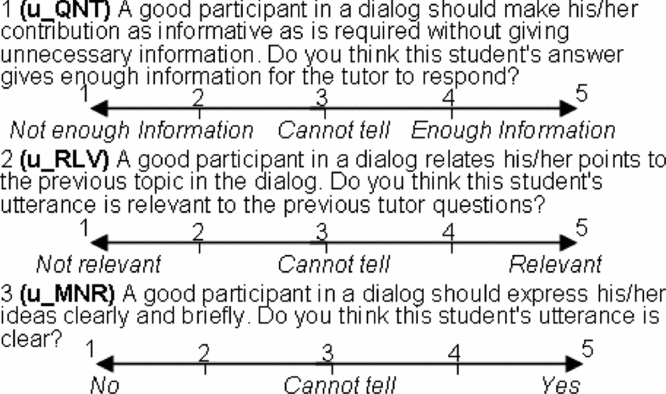
We designed a web survey to collect human judgments on a 5-point scale on both utterance and dialog levels. Remember our goal is to evaluate how well simulated users can mimic human user behaviors. Therefore, our survey is designed to assess the human-likeliness of user behaviors under the guidance of good human-human conversations (utterance level questions) and the perception of user behaviors (dialog level questions). Each dialog is separated into pairs of a tutor question and the corresponding student answer. Figure 1 shows the three questions which are asked for each tutor-student utterance pair. The three questions assess the quality of the student answers from three aspects of Grice's Maxims (Grice Reference Grice1975): Maxim of Quantity (u_QNT), Maxim of Relevance (u_RLV), and Maxim of Manner (u_MNR). In the survey, we briefly describe the standards for a good conversation partner based on the three aspects of Grice's Maxim before presenting the corresponding question. This aims to serve as a quick training for the judges on how to assess the quality of a conversational dialog.
Utterance level questions.
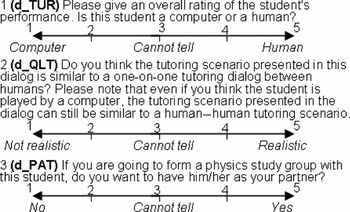
In Figure 2, we show the three dialog level questions which are asked at the end of each dialog. The first question (d_TUR) is a Turing testFootnote 3 type of question which aims to obtain an impression of the student's overall performance. This is also the only question that we know the ground truth. In Section 4.2, we will use this question to test how hard it is for human judges to discern simulated from human users. The second question (d_QLT) assesses the dialog quality from a tutoring perspective. The third question (d_PAT) sets a higher standard on the student's performance. Unlike the first two questions which ask whether the student ‘looks’ good, this question further asks whether the judges would like to partner with the particular student. We assume that the order of these three questions will not impact student answers since we believe that even if a judge thinks a student is a computer simulation, they may still think that the simulated student behaves like a human and will be willing to partner with the simulated student if the student is an intelligent learner. This belief is based on the successful evidence of computer-supported collaborative learning (Lou, Abrami and d'pollonia Reference Lou, Abrami and d'pollonia2001). However, this hypothesis needs to be further tested in future experiments. Also notice that our set of questions are deigned to test how well user simulations can mimic human behaviors in a tutorial dialogs. As discussed in Section 2, different questions should be designed based on different evaluation objectives and domains.
Dialog level questions.

We display one tutor-student utterance pair and the three utterance level questions on each web pageFootnote 4. After the judge answers the three questions, he/she will be led to the next page which displays the next pair of tutor-student utterances in the dialog with the same three utterance level questions. The judge reads through the dialog in this manner and answers all utterance level questions. At the end of the dialog, three dialog level questions are displayed on one webpage. We provide a textbox under each dialog level question for the judge to type in a brief explanation on his/her answer. After the judge completes the three dialog level questions, he/she will be led to a new dialog. This procedure repeats until the judge completes all of the 12 assigned dialogs.
4.2 Assessment study results
In the initial analysis, we observe that it is a difficult task for human judges to rate on the 5-point scale and the agreements among the judges are fairly low. Table 7 shows for each question, the percentages of pairs of judges who gave the same ratings on the 5-point scale. Therefore, in our analysis we collapse the ‘definitely’ types of answers with its adjacent ‘probably’ types of answers (more specifically, answer 1 with 2, and 4 with 5). We substitute scores 1 and 2 with a score of 1.5, and scores 4 and 5 with a score of 4.5. A score of 3 remains the same. The rest of our analysis is performed using the 3-point scale ratings.Footnote 5
Human judges' percent agreement on 5-point scale

4.2.1 Item agreement from all pairs of judgments
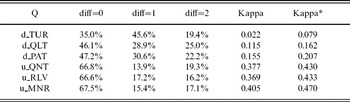
Table 8 shows the inter-annotator agreements on the collapsed 3-point scale. The first column presents the question types. In the first row, ‘diff’ stands for the differences between human judges' ratings. The column ‘diff=0’ shows percent agreement among judges. The column ‘Kappa’ shows the unweighted kappa agreements and the column ‘Kappa*’ shows the linear weighted kappa. A weighted kappa is computed to take into account distances among different rating categories. For example, if Judge A's rating falls in the category ‘score=1.5’, Judge B's rating in ‘score=3’, and Judge C's rating in ‘score=4.5’, although Judge A disagrees with both Judge B and Judge C, he disagrees with Judge C further than with Judge B. We can capture this difference by defining distances between the adjacent categories when calculating a weighted kappa. When calculating the linear weighed kappa, the adjacent answer distance is assigned to be one.Footnote 6 Therefore, in our example, the distance between Judge A and B is 1, while the distance between Judge A and C is 2.
Human judges' dialog and utterance level agreements on 3-point scale

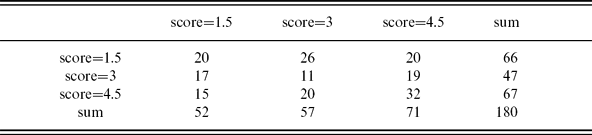
Note that we randomly picked two judges to rate each dialog so that different dialogs are rated by different pairs of judges and one pair of judges only worked on one dialog together. Thus, the kappa agreements here do not reflect the agreement of one pair of judges. Instead, the kappa agreements show the overall observed agreement among every pair of judges controlling for the chance agreement. We compute the kappa agreements by constructing the confusion matrix for each question. Table 9 shows an example of the confusion matrix for d_TUR. The first three rows of the first three columns show the counts of judges' ratings on the 3-point scale. For example, the first cell shows that there are 20 cases where both judges give 1.5 to the same dialog. We observe that human judges have low agreements on all types of questions, although the agreements on the utterance level questions are better than the dialog level questions. This observation indicates that assessing the overall quality of simulated/real dialogs on the dialog level is a difficult task. The lowest agreement appears on d_TUR.
Confusion matrix for judgments from all pairs of judges on d_TUR
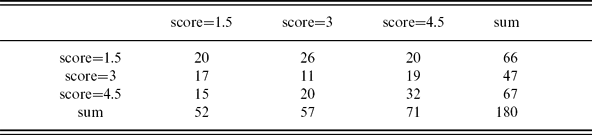
We look further into d_TUR because it is the only question that we know the ground truth. Remember in d_TUR we asked the judges whether the student presented in the dialog is a human or a computer. This information was already known at the time we picked the dialogs from the simulated or the human user corpus. We compute the accuracy of human judgment as (number of ratings 4&5 on real dialogs + number of ratings of 1&2 on simulated dialogs)/(2*total number of dialogs). The accuracy is 39.44 per cent, which serves as further evidence that it is difficult to discern human from simulated users directly.
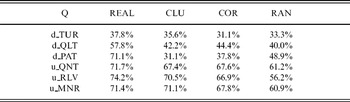
We also look into which dialogs are more difficult for the human judges to reach good agreements on by dividing the dialog corpus into subsets based on the types of simulation models and the contents of physics problems separately. Table 10 shows judges' percent agreements on dialogs generated by each of the four student models. We can see that the judges' agreements on dialogs by the real students are higher than the dialogs by any simulation models. We hypothesize that human users behave more consistently so that it is easier for judges to reach agreements on real student dialogs. This hypothesis remains to be confirmed by future studies.
Human judge percent agreements on 3-point scale for each student model

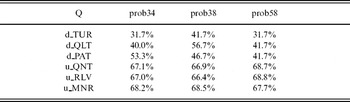
Table 11 shows human judges' agreements on each of the three physics problems. Differences among judges' agreements on different dialog contents are not significant, although there are some systematic differences among the dialogs on different problems. For example, dialogs on prob34 are significantly shorter than other dialogs and they have significantly higher correctness rates. However, since our tutorial dialogs have similar and constrained dialog structures due to our dialog system design, whether human judges' agreements will vary based on the content of dialogs remains to be an open question to be investigated in the future in longer and more sophisticated dialogs.
Human judge percent agreements on 3-point scale for each physics question

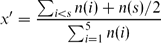
The judges we used in this study are not systematically trained to rate tutorial dialogs. Although we provided some general guidelines to the judges, different judges may still have different voting patterns, i.e., some judges are more conservative in the ratings while other judges are more generous. In order to standardize the ratings on a similar scale with comparable values across judges, we use the approach proposed by (Blatz et al. Reference Blatz, Fitzgerald, Foster, Gandrabur, Goutte, Kulesza, Sanchis and Ueffing2004) which has been applied on standardizing human judges' ratings on machine translation studies. In this approach, we first transform each rating into a quantile. For each judge J and score s, the standardized rating is:

where P(S < s|J) is the probability that judge J would assign a score lower than s. In order to estimate this probability from the discrete 5-point scale, we accumulate all ratings that are strictly below s, and half of the ratings that are equal to s. The ratio of these accumulated ratings to the total number of ratings is the standardized score. Let n(s) be the number of ratings of judge J that are equal to s, then for judge J, the standardized rating x is approximated by
We recalculate the inter-annotator agreements using the standardized ratings in Table 12. Both standardized rating agreements on the 5-point scale and on the 3-point scale are slightly better than the original rating agreements but are still low. Since standardized human ratings do not change our results, we continue to use the original ratings in the rest of our analysis.
Standardized rating percent agreements

To summarize, we observe that human judges' agreements on all types of questions are low. We investigate the low agreements by looking into judges' explanations on the dialog level questions. 21 per cent of the judges find it hard to rate a particular dialog because that dialog is too short or the student utterances mostly consist of one or two words. There are also some common false beliefs among the judges. For example, 16 per cent of the judges think that humans will say longer utterances while 9 per cent of the judges think that only humans will admit the ignorance of an answer. Since human judges' ratings have low agreement, next we look into an alternative way to interpret human judgments. Harman and Over (Reference Harman and Over2004) analyze the effects of human variation in DUC summarization evaluation. They find that despite large variations in human judgments, the ranking of the summarization systems remain constant. We observe similar results on our data.
4.2.2 Ranking of the models
In this section, we compute the rankings of the 4 student models based on dialog level questions only, since these questions represent the judges' impressions on the overall performance of a student model in individual dialogs. On the opposite side, judges' ratings on the utterance level questions only stand for a student model's behavior at one particular time. It will not be surprising to see an actual human's utterance gets a low rating while a random simulation's utterance gets a high rating. Ai (Reference Ai2009) show that dialog level ratings calculated from averaging utterance level ratings gives the same ranking results as using human judges' dialog level rating directly. Therefore, in this paper, we only report the results based on human's ratings on dialog level questions.
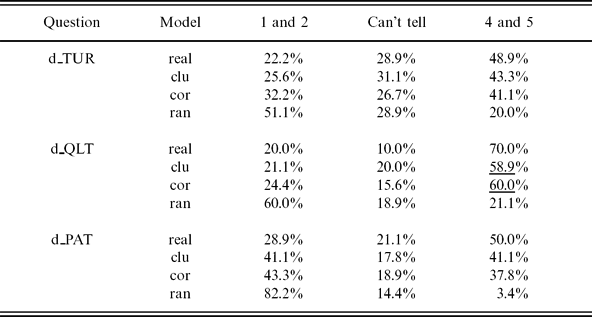
In Table 13, the first column shows the name of the questions; the second column shows the name of the models; the third to the fifth column present the percentages of judges who choose answer 1 and 2, can't tell, and answer 4 and 5. For example, when looking at the column ‘1 and 2’ for d_TUR, we see that 22.2 per cent of the judges think a dialog by a real student is generated probably or definitely by a computer; more judges (25.6 per cent) think a dialog by the cluster model is generated by a computer; even more judges (32.2 per cent) think a dialog by the correctness model is generated by a computer; and even more judges (51.1 per cent) think a dialog by the random model is generated by a computer. When looking at the column ‘4 and 5’ for d_TUR, we find that most of the judges think a dialog by the real student is generated by a human while the fewest number of judges think a dialog by the random model is generated by a human. Given that more human-like is better, both rankings support our hypothesis that the quality of the models from the best to the worst is: REAL, CLU, COR, and RAN. In other words, although it is hard to obtain well-agreed ratings among judges, we can combine the judges' ratings to produce the ranking of the models. We see consistent ranking orders on d_QLT and d_PAT as well. There is only one place of disorder of cluster and correctness model on d_QLT indicated by the underlines but the difference is not significant.
Human judges' rankings of simulation models on dialog level questions
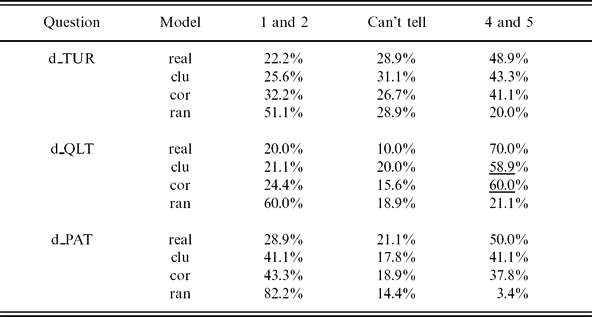
In this paper, our main conclusion of the ranking of the four user models are built on top of human ranking scores. Although the agreements on human ratings are low, we do not think they affect our main conclusion since the conclusion is drawn from consistent human ranking scores.
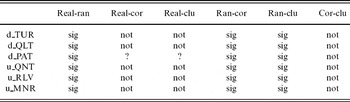
When comparing two models, we can tell which model is better from the above rankings. Nevertheless, we also want to know how significant the difference is. First we do an ANOVA test on the model ratings for each dialog and utterance level questions. All tests are significant which means there are significant differences among different models on all questions. This support our observation that human judges can tell the differences among different user models in their ranking scores. Next, we further use t-tests to examine the significance of differences between every two models. We average the two human judges' ratings to get an averaged score for each dialog. For each pair of models, we compare the two groups of the averaged scores for the dialogs generated by the two models using 2-tail t-tests at the significance level of p < 0.05. In Table 14, the first row presents the names of the models in each pair of comparison. ‘Sig’ means that the t-test is significant after Bonferroni correction; question mark (‘?’) means that the t-test is significant before the correction, but not significant afterwards, we treat this situation as a trend; ‘not’ means that the t-test is not significant at all. The table shows that only the random model is significantly different from all other models. The correctness model and the cluster model are not significantly different from the real student given the human judges' ratings, neither are the two models significantly different from each other. These results serve as evidence that the differences among human users and the two more realistic models are small. However, both the human judges and the ranking model can still tell which user is better.
T-test results on human judges' ratings between every two models

To summarize, although it is hard for human judges to reach good agreements on dialog ratings, the ratings give consistent ranking on the quality of the real and the simulated user models. Next, we build a prediction model using automatic evaluation measures to predict the rankings of the real and simulated user models. If the predicted rankings are consistent with human rankings, we can conclude that the automatic evaluation measures are valid.
5 Validating automatic evaluation measures
Since it is expensive to use human judges to rate simulated dialogs, we are interested in building prediction models of human judgments using automatic measures. If the prediction model can reliably mimic human judgments, it can be used to rate new simulation models without collecting human ratings. Here, we use a subset of the automatic measures proposed in Schatzmann et al. (Reference Schatzmann, Georgila and Young2005) that are applicable to our data to predict human judgments, including the number of student turns (Sturn), the number of tutor turns (Tturn), the number of words per student turn (Swordrate), the number of words per tutor turn (Twordrate), the ratio of system/user words per dialog (WordRatio), and the percentage of correct answers (cRate). The human judgment on each dialog is calculated as the average of the two judges' ratings on the 3-point scale. We focus on predicting human judgments on the dialog level because these ratings represent the overall performance of the student models.
We first use a stepwise multiple linear regression to predict human judges' ratings using the set of automatic measures we listed above. The stepwise procedure automatically selects measures to be included in the model. For example, d_TUR is predicted as 3.65-0.08*WordRatio-3.21*Swordrate, with an R-square of 0.12. The prediction models for d_QLT and d_PAT have similar low R-square values of 0.08 and 0.17, respectively. This result is not surprising because we only include the surface level automatic measures in the prediction models. Also, the measures we use here are designed for comparisons between models instead of predictions. Thus, next we build a ranking model to utilize the measures in their comparative manner. There are also studies that evaluate different systems or system components by ranking the quality of their outputs. For example, Walker, Rambow and Rogati (Reference Walker, Rambow and Rogati2001) train a ranking model that ranks the outputs of different language generation strategies based on human judges' rankings.
We train three ranking models to mimic human judges' rankings of the real and the simulated student models on the three dialog level questions using RankBoost, a boosting algorithm for ranking (Freund et al. Reference Freund, Iyer, Schapire and Singer2003; Mairesse et al. Reference Mairesse, Walker, Mehl and Moore2007). We briefly explain the algorithm using the same terminologies and equations as in Mairesse et al. (Reference Mairesse, Walker, Mehl and Moore2007), by building the ranking model for d_TUR as an example. In the training phase, the algorithm takes as input a group of dialogs that are represented by values of the automatic measures and the human judges' ratings on d_TUR. The RankBoost algorithm treats the group of dialogs as ordered pairs (x, y). x and y are two dialog samples and x has a higher human rated score than y. Each dialog x is represented by a set of m indicator functions h s(x) (1 ≤ s ≤ m). For example:

Here, the threshold of 0.47 is calculated by RankBoost. α is a parameter associated with each indicator function. For each dialog, a ranking score is calculated as
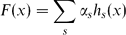
In the training phase, the human ratings are used to set α by minimizing the loss function

The eval function returns 0 if (x,y) pair is ranked correctly, and 1 otherwise. In other words, LOSS score is the percentage of misordered pairs where the order of the predicted scores disagree with the order indicated by human judges. In the testing phase, the ranking score for every dialog is calculated by (3). A baseline model which ranks dialog pairs randomly produces a LOSS of 0.5 (lower is better).
While LOSS indicates how many pairs of dialogs are ranked correctly, our main focus here is to rank the performance of the four student models instead of individual dialogs. Therefore, we propose another Averaged Model Ranking (AMR) score. AMR is computed as the sum of the ratings of all the dialogs generated by one model averaged by the number of the dialogs. The four student models are then ranked based on their AMR scores. The chance to get the right ranking order of the four student models by random guess is 1/(4!).
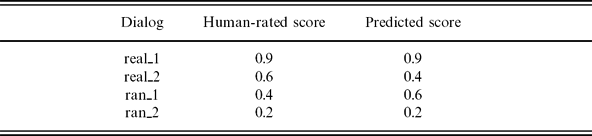
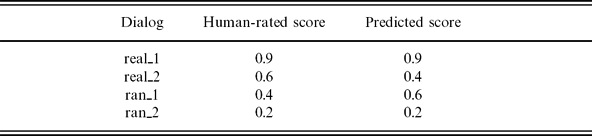
Table 15 shows a made-up example to illustrate the two measures. real_1 and real_2 are two dialogs generated by the real student model; ran_1 and ran_2 are two dialogs by the random model. The second and third column shows the human-rated score as the gold standard and the machine-predicted score in the testing phase, respectively. The LOSS in this example is 1/6, because only the pair of real_2 and ran_1 is misordered out of all the 6 possible pair combinations. We then compute the AMR of the two models. According to human-rated scores, the real model is scored 0.75(= (0.9+0.6)/2) while the random model is scored 0.3. When looking at the predicted scores, the real model is scored 0.65, which is also higher than the random model with a score of 0.4. We thus conclude that the ranking model ranks the two student models correctly according to the overall rating measure. We use both LOSS and AMR to evaluate the ranking models.
A made-up example of the ranking model
First, we use regular fourfold cross validation where we randomly hold out 25 per cent of the data for testing and train on the remaining 75 per cent of the data for four rounds. Both the training and the testing data consist of dialogs equally distributed among the four student models. However, since the practical usage of the ranking model is to rank a new model against several old models without collecting additional human ratings, we further test the algorithm by repeating the four rounds of testing while taking turns to hold out the dialogs from one model in the training data, assuming that model is the new model that we do not have human ratings to train on. The testing corpus still consists of dialogs from all four models. We call this approach the minus-one-model cross validation.
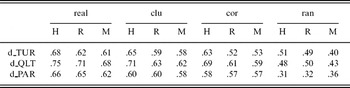
Table 16 shows the LOSS scores for both cross validations. Using 2-tailed t-tests, we observe that the ranking models significantly outperform the random baseline in all cases after Bonferroni correction (p < 0.05). When comparing the two cross validation results for the same question, we see more LOSS in the more difficult minus-one-model case. However, the LOSS scores do not offer a direct conclusion on whether the ranking model ranks the four student models correctly or not. To address this question, we use AMR scores to reevaluate all cross validation results. Table 17 shows the human-rated scores (in column H), predicted AMR scores on the regular cross validation (in column R), and predicted AMR scores on minus-one cross validation (in column M). We see that the ranking model gives the same rankings of the student models as the human judges on all questions in both regular cross validations and minus-one cross validations. Therefore, we suggest that the ranking model can be used to evaluate a new simulation model by ranking it against several old models.
LOSS scores for Regular and Minus-one-model cross-validation

AMR scores for regular and minus-one cross validation

To summarize, we validate the previously proposed simulation evaluation measures by showing that these measures can predict the ranking of our user simulations the same as human judges. We also observe that the ranking model built by these automatic evaluation measures can be used to assess the quality of a new simulation model on which we do not have human judgments.
6 A simple time series feature for improving simulation ranking prediction
The previous proposed evaluation measures that we have just validated are mostly shallow features. While these features are easy to compute, we are not sure about the differentiating power of these evaluation measures. In other words, if a dialog corpus is shown to be different from a real user corpus by these evaluation measures, can we conclude that this dialog corpus is not realistic? In Ai and Litman (Reference Ai and Litman2006), we apply this same set of automatic measures on the data collected between two groups of human users with the ITSPOKE system. We observe that the human user behaviors from different groups are shown to be very different by these evaluation measures. In other words, if we see any difference between a dialog corpus and a human user corpus using these evaluation measures, we cannot conclude that the dialog corpus is not realistic. We suspect that the deficiency of these simple evaluation measures is due to the fact that they only capture user actions at a certain time point while neglecting the connections among user actions during the course of the dialog, which are important characteristics to represent. Therefore, in this section we introduce a feature which describes the impacts among user actions along a time series to better capture human user behaviors in dialogs.
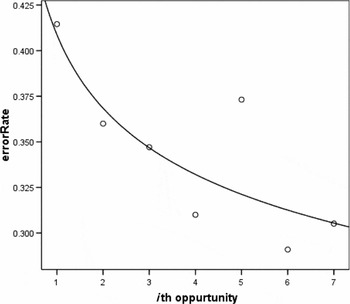
In our previous work (Ai and Litman Reference Ai and Litman2007), we use a knowledge consistency feature to capture the consistency of student learning behaviors over time. In a tutoring dialog, the tutor helps the student to construct and apply knowledge concepts.Footnote 7 Eventually, a practice effect should be observed in which the students remove the flaws in their understanding of knowledge concepts with more practice. Research on learning (Cen, Koedinger and Junker Reference Cen, Koedinger and Junker2006) suggests that the learning process proceeds smoothly without sudden gain or loss of knowledge components. In other words, once the student acquires certain knowledge components, his/her performance on similar problems that require that knowledge component will become stable. Based on this theory, we measure student knowledge consistency by plotting the student's learning curve. Here, we follow the standard way adopted by learning researchers (Cen et al. Reference Cen, Koedinger and Junker2006) to plot the learning curves on simulated as well as human user corpora. In a learning curve figure, the x-axis stands for the ith opportunity the student has to practice a certain knowledge component; the y-axis stands for the error rate, which is the percentage of students who failed to use the knowledge correctly. For example, in the dialog shown in Table 3, this student failed to use 3rdLaw at the first opportunity, but was successful at the second opportunity. Assume there is another student who uses 3rdLaw correctly at both of the opportunities. Given these two students, on the learning curve for 3rdLaw, the error rate would then be 50 per cent for the first opportunity and 0 per cent for the second opportunity. Following the learning curve plotting procedure defined by Cen et al. (Reference Cen, Koedinger and Junker2006), we first compute separate learning curves for each of the 20 knowledge components. Then, we get an overall learning curve (as in Figure 3) by computing the average error rates of all the knowledge components for each practice opportunity.
Learning curve from the human user corpus.

We can measure how well a learning curve plotted on the simulated data fits with the learning curve plotted on the human user data to evaluate how well the user simulation mimics human user behaviors. This is a time-series analysis in which a sequence of data points, measured at successive time points are analyzed. We define the goodness-of-fit value as the knowledge consistency feature. In Ai (Reference Ai2009), we show that this feature can capture the similarities between human user data that cannot be captured by the previously proposed automatic measures.
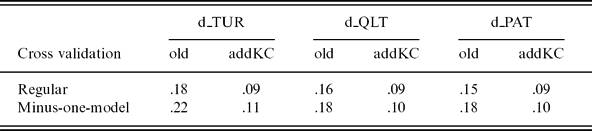
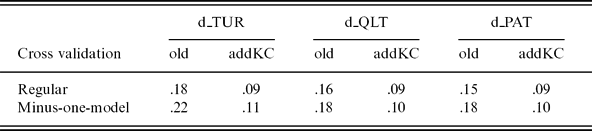
Although the original ranking model in Section 5 is already able to give correct rankings of the four student models, further improvements can ensure the ranking model to be more reliable when being applied to rank more student models. Thus, in this section we add the knowledge consistency as a predictive feature into the original ranking model to improve its performance. Recall that the knowledge consistency constraint is computed on all students over all dialogs in the corpus. However, in the ranking model, the features used to predict human judges' rankings are calculated on a per-dialog base. In other words, we cannot apply the knowledge consistency constraint in the ranking model directly. Alternatively, we define a simplified feature to represent the knowledge consistency constraint: the value of this feature is one if the user answers the tutor's question incorrectly while the user was able to answer the tutor's question correctly the last time; the value of the feature is zero in all other cases. We use the same training-testing data and the same experimental settings as in Section 5 to test the improved ranking model. Table 18 shows the LOSS scores from the regular and the minus-one-model cross-validation results. Under each dialog level question, we show the LOSS scores for the old model ‘old’ and the new model ‘addKC’ using two cross validations. Recall the LOSS score indicates the percentage of dialog pairs that are misranked by the ranking model with regard to the human gold standard. We observe that the loss scores from the new models are significantly (p < 0.05) lower than the scores from the old model. Therefore, by adding this simple feature which represents knowledge consistency, the new ranking model can predict the ranking of the four simulation models more robustly by reducing LOSS scores. The new AMR scores are still able to give the same ranking of the simulation models as human judges.Footnote 8
LOSS scores for Regular and Minus-one-model cross-validation after adding the time series feature
To summarize, the knowledge consistency constraint can be used as a useful feature to capture the similarity among human user corpora as well as to better distinguish human user corpora from simulated user corpora. This constraint can also be used to predict the rankings of several user simulations more reliably. Although this constraint is proposed for our tutoring dialog domain, it can be generalized to other types of dialogs where user knowledge is gradually modified during dialog system interactions, such as trouble shooting dialogs (Janarthanam and Lemon Reference Janarthanam and Lemon2008) and collaborative task dialogs (Di Eugenio et al. Reference Di Eugenio, Jordan, Thomason and Moore2000). Hof, Hagen and Huber (Reference Hof, Hagen and Huber2009) develop a dialog system which provides adaptive help based on how users learn or forget the speech commands. In general, domain experts (or machine learning techniques) are needed to organize user knowledge into knowledge concepts that dialog systems can track. Sequential features can also be useful in capturing the changes in user behaviors while interacting with a system in repetitive tasks (Komatani, Kawahara and Okuno Reference Komatani, Kawahara and Okuno2007). However, such data may be harder to collect since it involves experiments lasting for a longer time than most lab experiments.
7 Conclusion and future work
In this paper, we introduce a set of automatic evaluation measures to compare how human-like simulated users are. We apply both previously proposed automatic evaluation measures which describe a user action at a certain time point, and a new measure which aims to describe the connections among user actions during the course of a dialog. We collect human judgments to validate the previously proposed measures before applying them in our studies. We show that human judges can rank the quality of simulated users and human users consistently. Therefore, we use the human judgments as the gold standard to validate the automatic evaluation measures. We show that the previously proposed measures can correctly predict human judges' rankings when used in a ranking model. Therefore, we suggest that these measures can be used to quickly assess user simulation qualities in future studies when human judges are not available, since these measures can be automatically extracted from simulation logs. However, although these measures can be used to distinguish simulated and human user corpora, we observe that they cannot help to explain the differences found among the corpora. We see that even two human user corpora collected with the same dialog system are shown to be significantly different using this group of measures because the two user corpora are collected from different user populations. Therefore, even if we find that a dialog corpus is different from a human user corpus, we cannot conclude that the dialog corpus is not realistic. In order to better capture the similarities among human user corpora, we propose a measure which utilizes a simple time-series analysis – the knowledge consistency measure. This measure tracks the consistency of user actions based on user knowledge. We show that this measure can improve the ranking model in order to predict the rankings of user simulations more reliably.
In this study, we only implement a simple version of the knowledge consistency measure. In the future, we would like to apply more comprehensive time-analysis on our data in order to develop a better knowledge consistency measure. In addition, we would want to apply the knowledge consistency measures to other domains besides tutoring. Our long term goal is to explore more features that can be used to construct human-like user simulations as well as to evaluate user simulation qualities.
Acknowledgements
This material is based upon work supported by the National Science Foundation under Grant No. 0325054. The authors wish to thank Joel Tetreault, Mihai Rotaru, Kate Forbes-Riley and the reviewers for their insightful comments, Francois Mairesse for helping with RankBoost, and Scott Silliman for his help in the survey experiment.
Appendix A: Itspoke problem statements
Problem 34. The sun pulls on the earth with the force of gravity and causes the earth to move in orbit around the sun. Does the earth pull equally on the sun? Defend your answer.
Problem 38. Suppose a lightweight car and a massive truck hit a patch of frictionless ice and have a head-on collision. Upon which vehicle is the impact force greater? Which vehicle undergoes the greater change in its motion? Defend your answers.
Problem 58. Suppose a man is in a free-falling elevator and is holding his keys motionless right in front of his face. He then lets go. What will be the position of the keys relative to the man's face as time passes? Explain.
Appendix B: Example itspoke dialogs
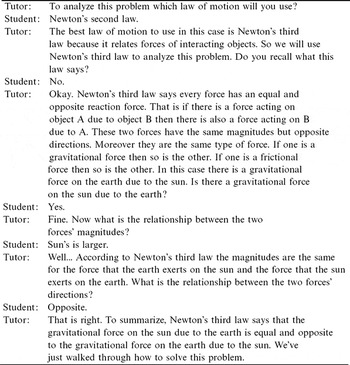
An example dialog of Problem 34

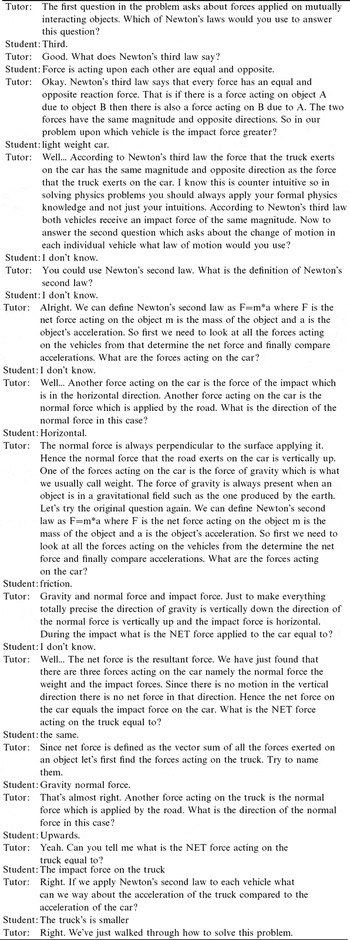
An example dialog of Problem 38

An example dialog of Problem 58