
Introduction
The continuous improvement and power of Natural Language Processing (NLP) tools has spawned many studies to navigate the literature in materials science and has been demonstrated for selected use cases.[Reference Kim, Huang, Tomala, Matthews, Strubell, Saunders, McCallum and Olivetti1–Reference Wilmer, Leaf, Lee, Farha, Hauser, Hupp and Snurr10] Variational Autoencoders, for example, have been suggested as a way to derive specific processing parameters from the existing scientific literature.[Reference Kim, Huang, Stefanie and Olivetti11] Specific processing–property relationships have been demonstrated through tailored entity extraction tools such as ChemDataExtractor[Reference Swain and Cole12] to automatically populate thermal and magnetic databases of some materials.[Reference Callum and Cole13] In this paper, we introduce another genre of application to utilize NLP to interrogate and harness knowledge embedded in documents in the materials science literature.
Figures exist in many different forms, and much of the interpretation of processing–structure–property relationships is based on the instantaneous ability to identify what the figure quantitatively provides. While someone with domain expertise can provide this interpretation, the ability to scale this up if we have hundreds of thousands of figures and images is a totally different challenge. The aim in applying NLP tools should not simply be to track where words occur or count their frequency but rather to capture more subjective relationships which drive our ability to read the literature and to connect images to the text. As a case study for the development and knowledge gain possible from NLP tools, we use quantum materials as our platform. We use NLP tools to identify correlations between the text in figure captions within the quantum material literature, providing guidance on the types of techniques and properties that have been explored. This provides mapping and compression of the information in the quantum materials area and also provides guidance as to potential data sources or types of images for the domain experts to use in uncovering structure–property relationships.
The term “quantum materials” covers an incredibly wide area of disciplines, including topological materials, quantum computing, magnetoelectrics, and mottronics, while also covering a vast property space including superconductivity, magnetism, photonics, and mechanics.[Reference Bansal and Lamon14,Reference Sato and Ando15] The focus of our case study is on assessing the extent of work done in the field of exploring structure–property relationships, especially in terms of microstructural characterization, and not necessarily in seeking a specific scientific mechanism governing their behavior. The use of quantum materials is especially appropriate as a case study since the literature extends across a broad spectrum of publications and much of that work is not clearly identifiable through titles and/or abstracts alone. Harnessing one's domain expertise in linking heuristic interpretation of images and graphs to captions opens an untapped resource for knowledge discovery using NLP methods.
In this study, we use NLP tools to visualize connections in the data and explore “hidden” relationships that can be inferred in exploring the associations between information embedded in the interpretation of figures regarding structure–property relationships. Large scientific corpuses, such as the body of literature of quantum materials, contain many types of data. Defining correlations in these data, particularly defining correlations between images, helps to define relationships which are otherwise difficult to describe. These correlations capture information succinctly and enable effective visualization, thereby exposing relationships that are lost in the data complexity. Rather than analyzing the figures themselves, we show that by instead analyzing a large number of captions associated with a range of figure types, we establish connections between figures and their associated captions. This association contains a vast amount of untapped heuristic knowledge that we are now capturing using our NLP methods.
To a domain expert, these figures provide useful qualitative information that guides the reader and contains important information, even if the quantitative interpretation of these figures is not the main objective of these papers. As the details of the figures are often not reflected in the titles and/or abstracts of the papers, text mining alone will miss the discovery of the critical information embedded in these figures. To address this challenge, we show how using NLP limited solely to the figure captions can indeed capture trends in the information contained in the figures. We do not analyze nor input the figures in this approach but rather visually assess the trends after the analysis to test this logic. We provide a case study in the field of quantum materials by exploring a collection of more than 300,000 images and their corresponding captions from over 50,000 articles on topological materials. This information often serves as supporting information and resides as figures and graphs. We show that despite the large level of research publications in the field of quantum materials and the recognition of the importance of microstructural influences on properties of such materials, there is in fact a paucity of experimental studies that link specific wavenumbers with microstructural features.
The tabulation of structure–property relationships in the field of quantum materials represents one such example of a rapidly expanding field of literature, and identifying where data and gaps in the experimental knowledge exist is challenging. In this paper, we show how we can rapidly explore and identify information that would otherwise have been difficult to uncover in the large number of documents. Our premise is that a domain specialist often conducts a survey of the literature, to obtain a general sense of the status of the types of studies conducted in a given field. A rapid aggregate analysis of thousands of papers provides the reader a quick sense of the information landscape of research activity in the field. We are linking the experimental and/or computational technique that is the source of a given figure (e.g., electron microscopy, x-ray or Raman scattering, band structure, etc.) to other information about the material given in the caption.
Methods
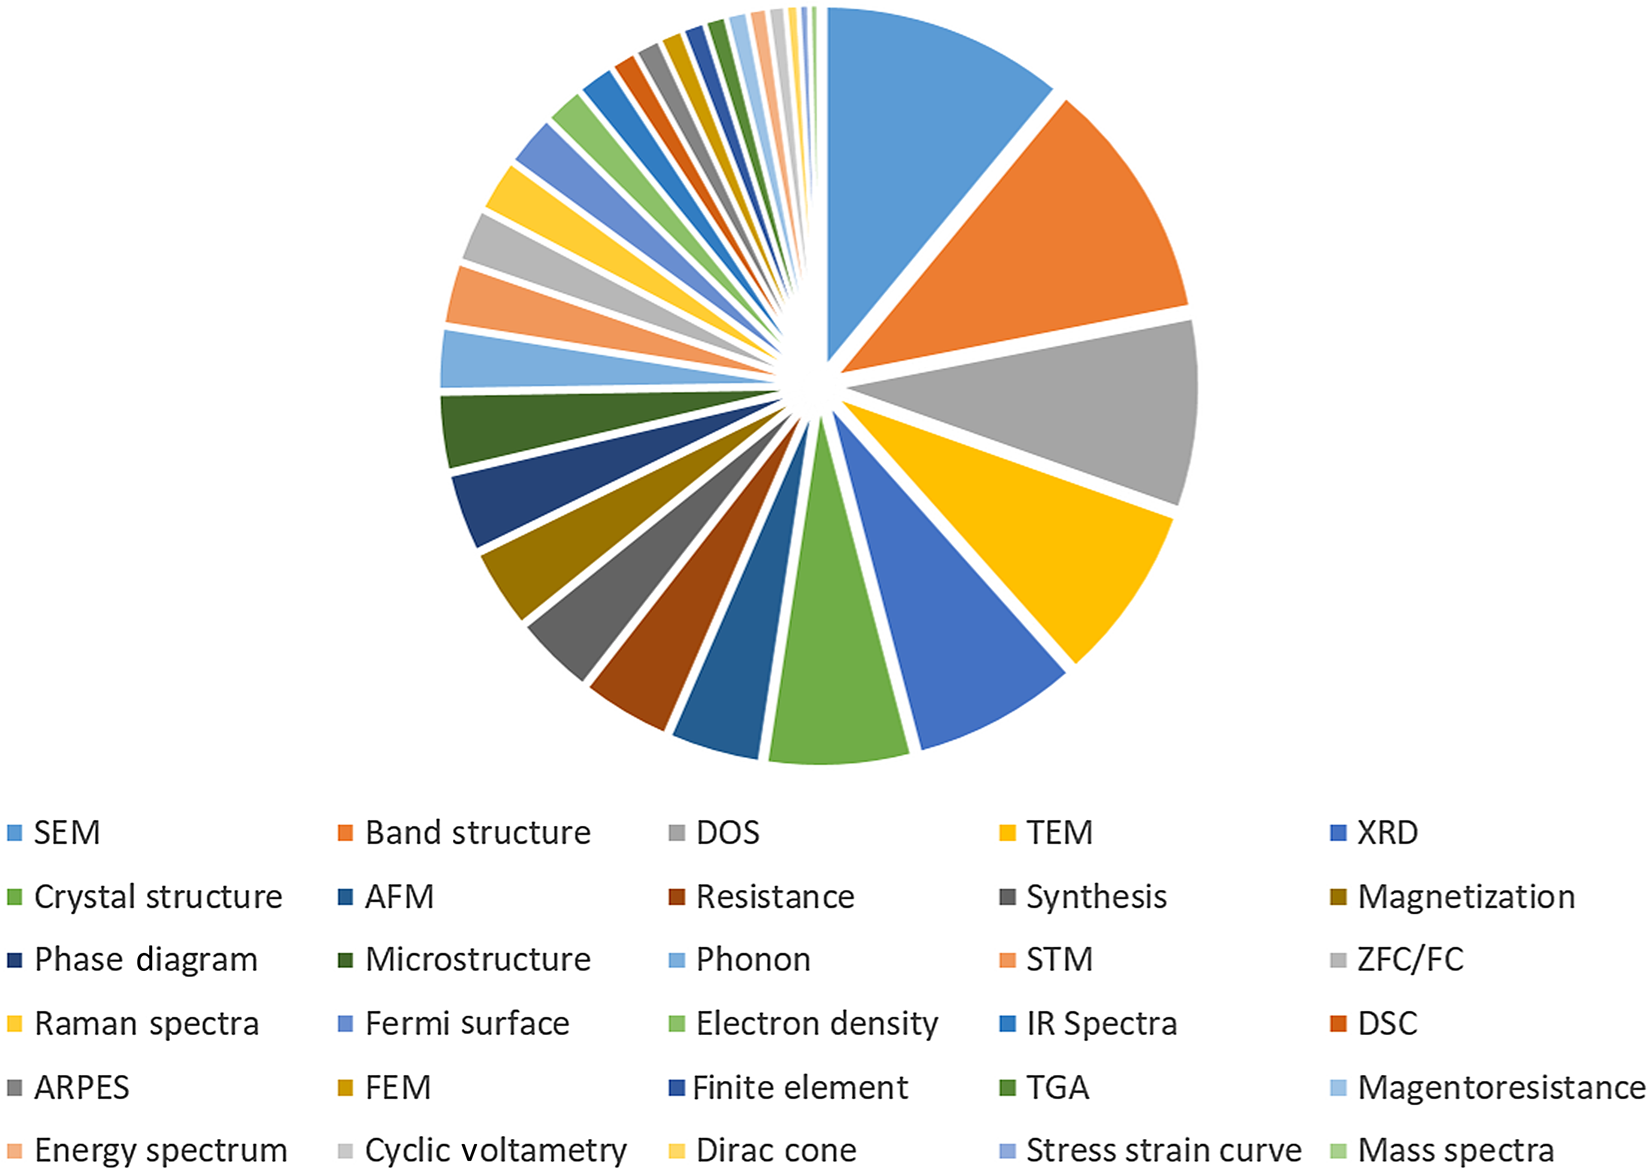
The Elsevier text mining application programming interface (API)[16] was used to query and retrieve full texts, images, and captions of articles related to topological materials. Over 40 individual keywords including broad topical headings, such as 2D Topological Materials, Topological Band Theory, Topological Crystalline Insulator, and Topological superconductor, were used to access and retrieve the literature database. From these sources, 50,639 articles on topological materials and 304,967 images were collected along with the corresponding captions. Fifty-three keywords relevant to topological materials were identified and the images were labeled based on the presence or absence of these keywords in their captions, resulting in 100,000 images labeled according to the occurrence of keywords in their respective captions. Thirty of the most common labels of images in this collection are visually represented in Fig. 1.
The most common labels assigned to images based on keyword occurrences in the captions and their distribution in the literature, as related to quantum materials. This provides our search space for analyzing and extracting information from figures, thereby linking text and figures. This paper provides an accelerated approach towards the classification of figure types without requiring the complexity of figure recognition approaches.

The empirical information content of scientific publications is in various forms, such as images (for example, spectra and micrographs), text, and tables.[Reference Torralba, Fergus and Freeman17,Reference Deng, Dong, Socher, Li, Li and Fei-Fei18] For topological materials, these include microstructure data, such as electron micrographs, conductance and resistance measurements, band diagrams, synthesis flowcharts, x-ray diffraction images, angle-resolved photon emission spectroscopy, mass spectroscopy, density of states (DOS) calculations, Hall conductance studies, and magnetization measurements. Dispersed over the body of literature on topological materials, these images capture several properties and chemistries arranged over several scales of length, space, and time. Caption groupings formed by the vector space modeling of caption texts serve both as a visualization tool enabling rapid and holistic comprehension of the topological literature and as an exploratory tool highlighting previously unknown relationships between sets of images. As a visualization tool, a caption plot helps identify which property measurements are most represented in the literature. We also determine which measurements occur most frequently with one another, as well as how they are distributed across different topical databases, thereby identifying where the gaps in the data exist.
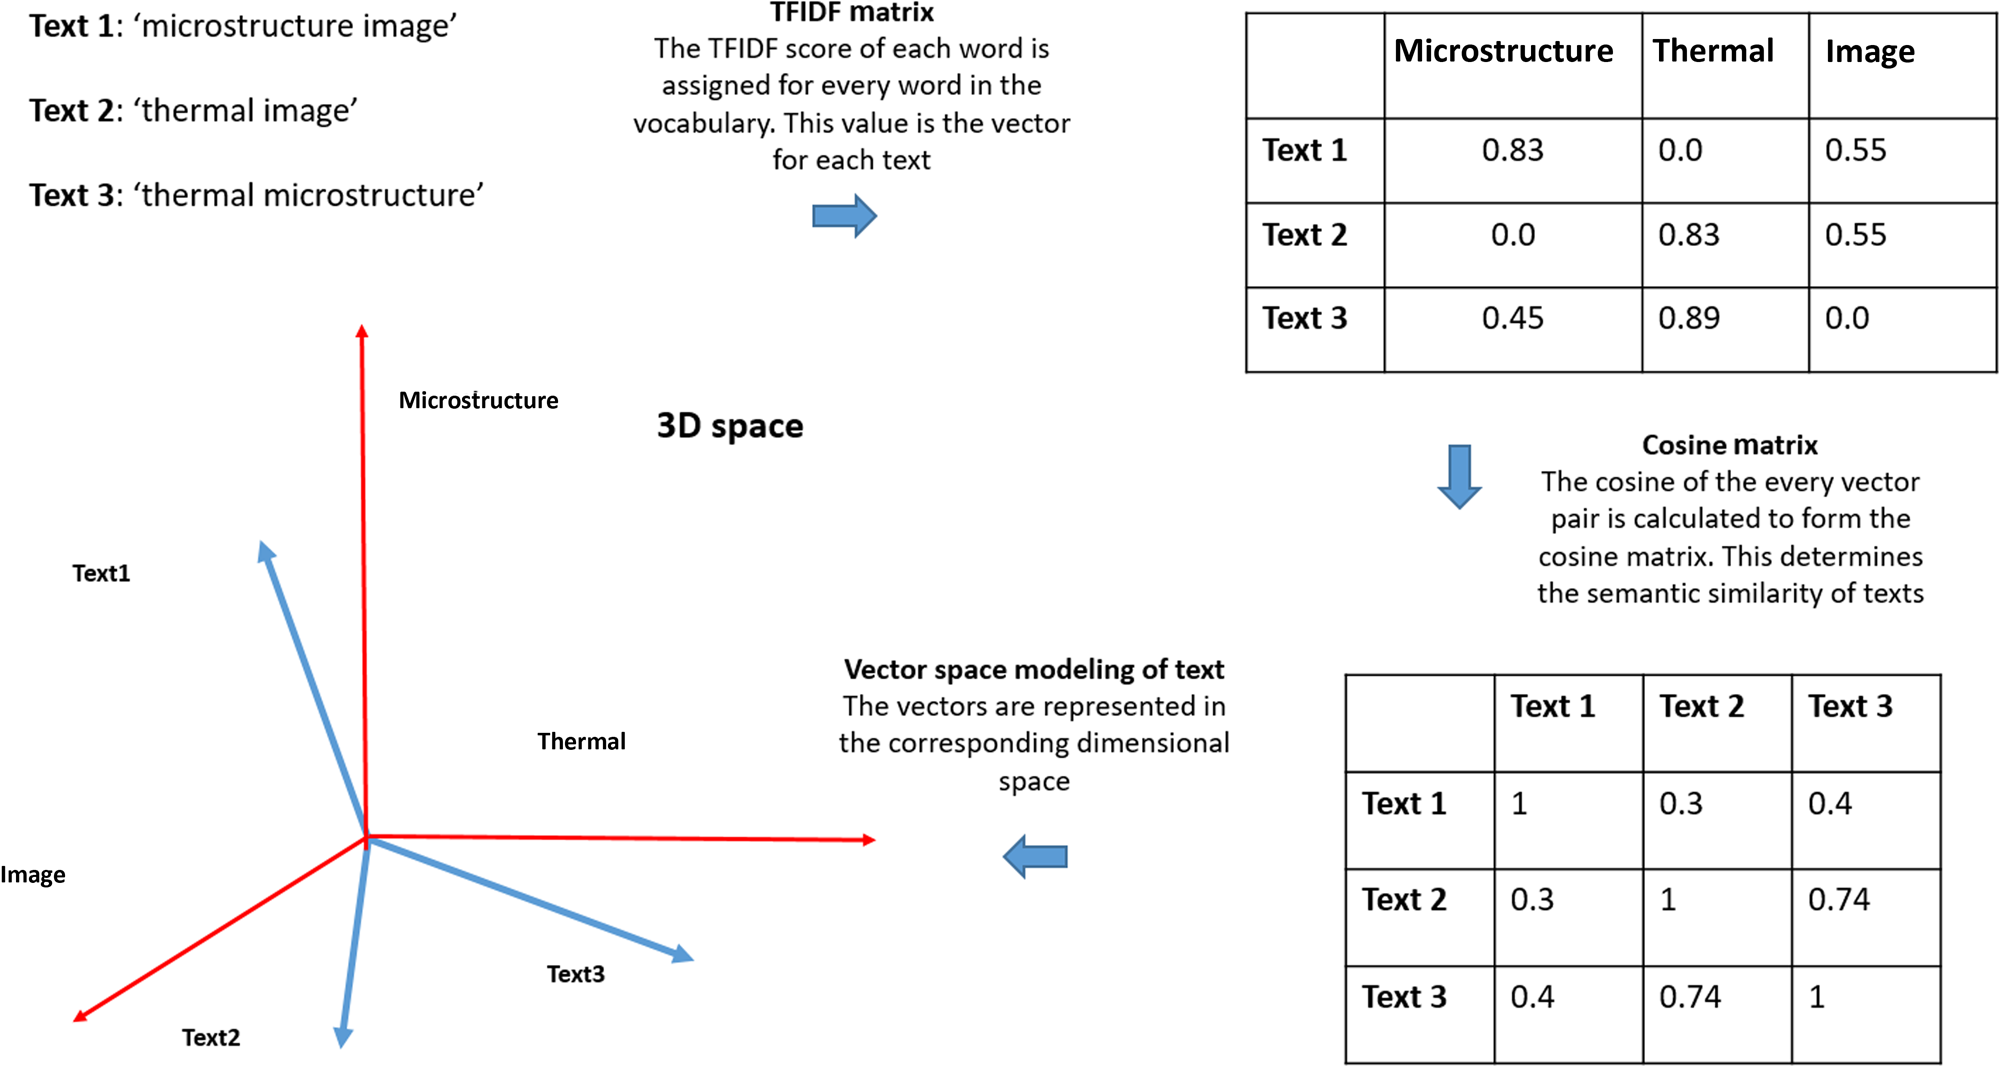
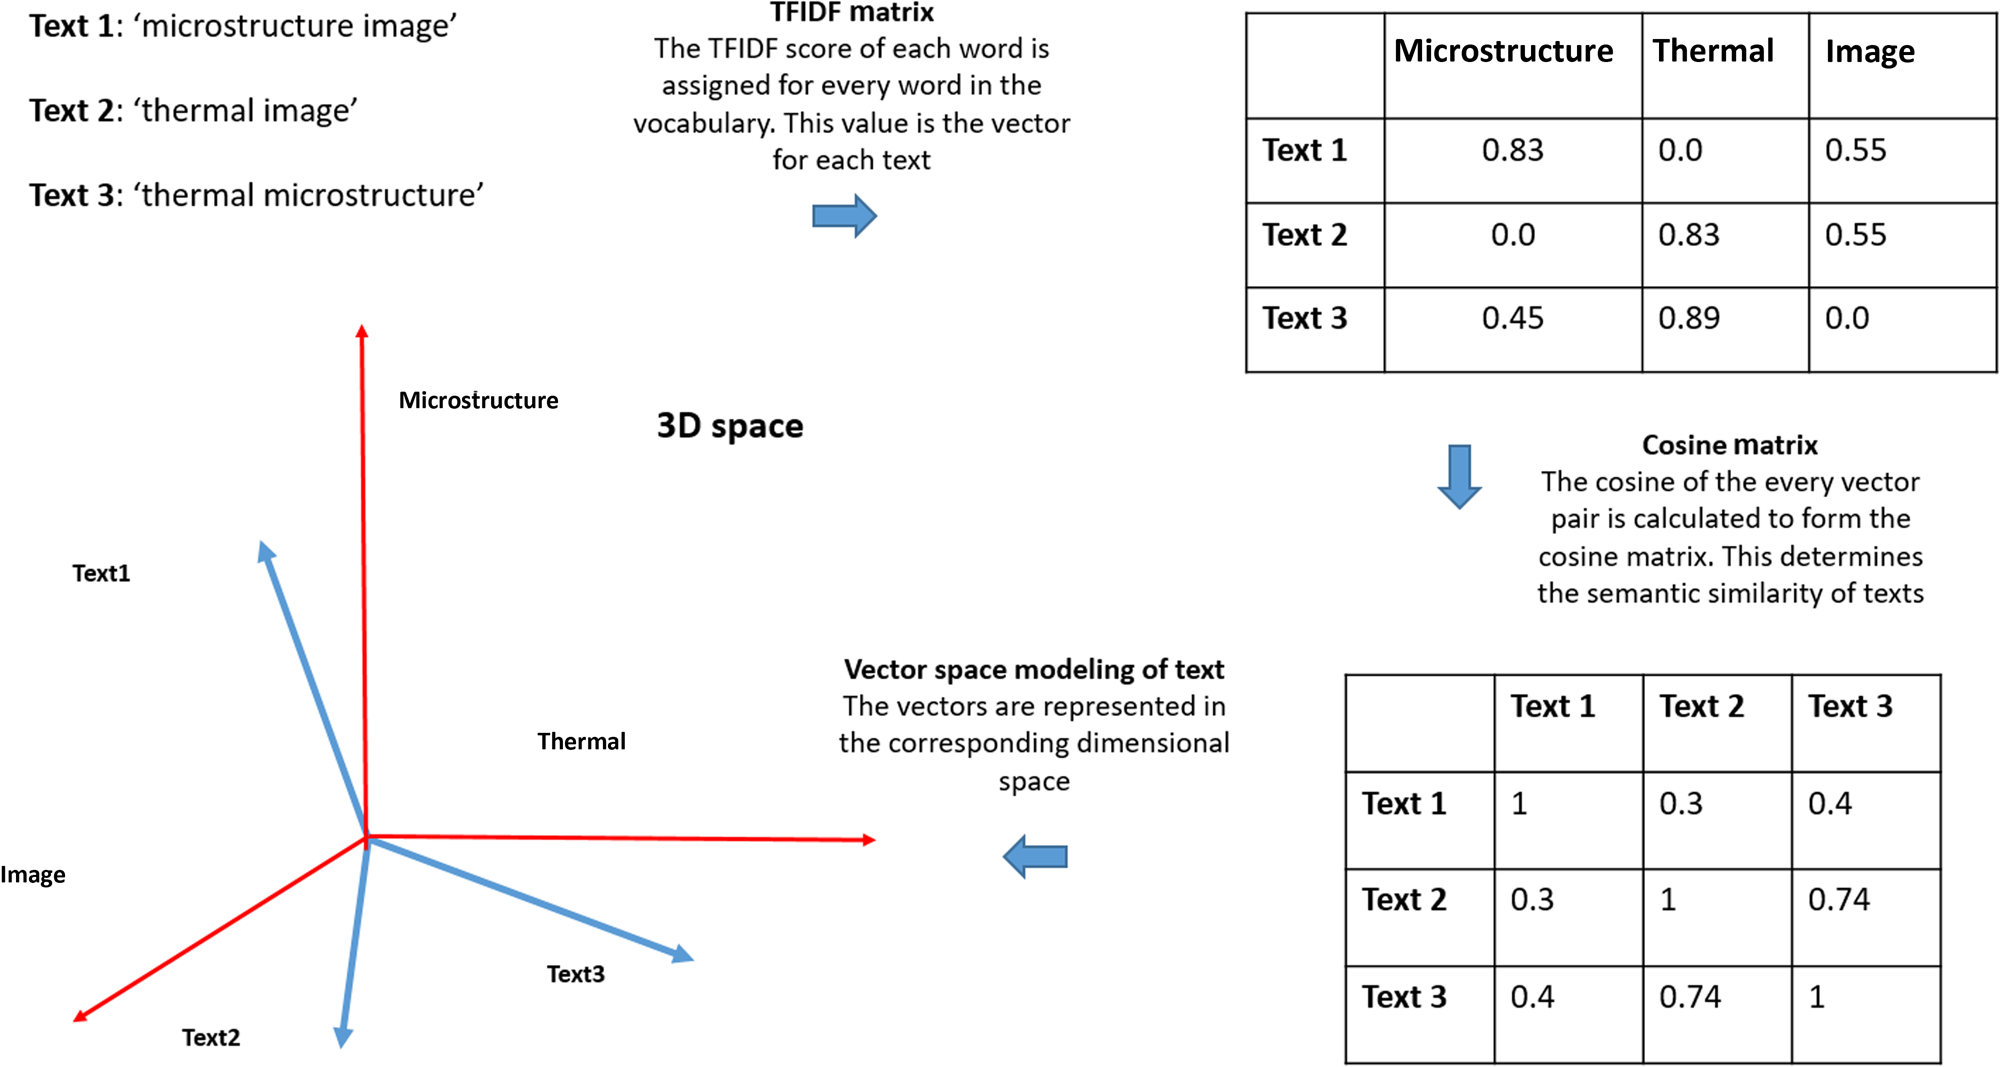
The schematic workflow we employ to form caption plots is shown in Fig. 2. The caption texts are converted to vectors using Term Frequency Inverse Document Frequency (TFIDF) vectorization.[Reference Jones19] Similar vectors are identified by their cosine similarity using a T-distributed Stochastic Neighbor Embedding (TSNE) algorithm. Thus, individual captions are converted to points on a plot and colored according to their labels which annotate groups with the type of images they represent. We define “type of image” here as meaning the label(s) of the images based on the 53 keywords. We assume that the occurrence of a keyword in the caption indicates that the figure shows data related to that keyword. For example, a type of image corresponding with SEM is expected to show data obtained via SEM, and phase diagram is expected to show a phase diagram or some thermodynamic relationships, and so on. Comparison between the labeling of captions via NLP versus manual labeling finds that this assumption is reasonable.
Vector space modeling of textual documents. The vocabulary size of the corpus determines the dimensionality of the vector space. The text entries, which here are for illustrative purposes only, result in a three-dimensional vector space after TFIDF vectorization and the calculation of the cosine matrix. Larger vocabulary sizes lead to higher-dimensional representations of the document.
TFIDF is a statistical count that reflects the relevance of a word in a document and is a common vectorization technique for text mining and information retrieval. For a term “t” appearing in “d” documents within a collection D:
 $$tfidf\lpar {t,d,D} \rpar = tf\lpar {t,d} \rpar \; \times \; idf\lpar {t,D} \rpar$$
where tf(t,d) is the term frequency defined by:
 $$tf\lpar {t,d} \rpar = \left\{ {\matrix{ {1,} \hfill & {{\rm if}\,t\,{\rm is}\,{\rm present}\,{\rm in\;} \,d} \hfill \cr {0,} \hfill & {{\rm otherwise}} \hfill \cr}} \right.$$
The inverse document frequency idf(t,D) is defined as:
 $$idf\lpar {t,D} \rpar = \log \displaystyle{N \over {\vert {\lcub {d\in D:t\in d} \rcub } \vert }}$$
TFIDF ensures that unique terms are weighted higher than common terms. For example, the word “figure”, “image”, and “plot” are likely to occur very commonly in captions and carry no additional semantic content that adds to our knowledge of the image. However, terms such as magnetization and conductance are unlikely to be as common and are weighted higher. The terms with the highest TFIDE scores are retained by the model as the basis for a vector space. Similar vectors are identified by their cosine similarity using the TSNE algorithm, resulting in individual captions being converted to points on a plot. These points are colored according to their labels annotating groupings of points with the type of images they represent.
The cosine distance between two captions is calculated as:
 $$\cos \lpar {\overrightarrow {{\rm caption}-1}, \; \overrightarrow {{\rm caption}-2}} \rpar = \displaystyle{{\overrightarrow {{\rm caption}-1} \;\cdot \overrightarrow {{\rm caption}-2}} \over {\vert {\overrightarrow {{\rm caption}-1}} \vert \vert {\overrightarrow {{\rm caption}-2}} \vert }}$$
Similar captions with shared vocabulary have cosine values approaching one — signifying that they are geometrically located at proximate locations in higher-dimensional space. The caption vectors are analyzed using TSNE to project similar vectors into a two-dimensional space according to their cosine metric [Reference van der Maaten and Hinton20]. TSNE is a nonlinear dimensionality reduction technique that models a higher-dimensional object such that similar objects are modeled by nearby points and dissimilar objects by distant points with high probability. Given a set of high-dimensional objects x i, TSNE computes the probabilities p ij such that:
 $$p_{\,j \vert i} = \displaystyle{{\exp (-{\cos} ^2\lpar {x_i,x_j} \rpar /2\sigma ^2)} \over {\sum\nolimits_{k\ne i} {\exp (-{\cos} ^2\lpar {x_i,x_k} \rpar /2\sigma ^2)}}}$$
where σ is the bandwidth of a Gaussian kernel internal to the algorithm. This is adapted to the density of the data, with smaller values used in dense parts of the high-dimensional space. The result is a two-dimensional projection of the higher-dimensional manifold such that similar captions are plotted in close proximity. Finally, each caption is colored according to the label identified by the string identification keyword search.
To convert a caption into a vector, the tokens (words) in a caption are compared with the selected basis terms and, if present, the tfidf score of the token becomes the length of the vector in that dimension. Similar captions with shared vocabulary have cosine values approaching unity, signifying that they are geometrically located at proximate locations in higher-dimensional space. Additionally, each caption is colored according to the label identified by the string identification keyword search.
Results
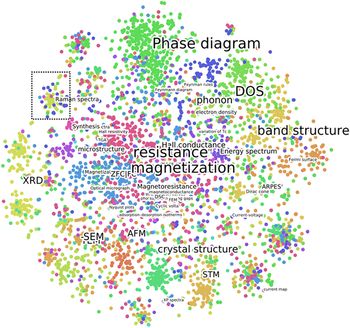
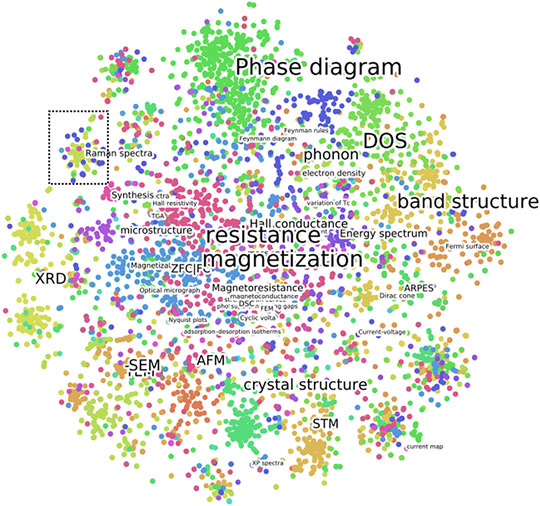
For the topical heading “topological superconductors”, 11,000 images were labeled and their captions were modeled in Tfidf vector space and then by TSNE. TSNE positions points based on similarity, and the caption analysis plot of topological superconductors is shown in Fig. 3, with each point corresponding to a unique labeling of a figure caption. It should immediately be noted that the points in the scatter plot also group according to their color, demonstrating that the vectorization protocol has indeed placed similar types of image captions next to each other. Thus, the vectorization approach has effectively captured the semantic content of the caption texts. The size of the labels corresponds to the number of points within the high density region, and regions are annotated such that the size of the labels are proportional to the number of points within a high-density region. Phase Diagrams, DOS, resistance, magnetization, and band structure form the largest set of images in topological superconductors [Reference Ando and Fu21]. Of these, resistance and magnetization occupy the center of the image, signifying that they share semantic contexts with all other types of images. Resistance studies and magnetization measurements are the two most common methods to establish superconductivity in a material and therefore the terms in these captions are likely to be distributed across all other images, explaining their central position in the caption plot.
Caption analysis plot of 11,000 captions on quantum materials. This figure provides two pieces of critical information: the proximity of points measures the correlation between concepts and the size of the labels corresponds to the relative abundance of these terms in the literature. This therefore provides information on both the relationship of topics and the perceived importance of topics.

Captions related to characterization approaches, such as SEM, TEM, AFM, Raman spectra, and ARPES, are distributed along the edge of the plot. These microscopy techniques share the words “electron” and derivatives of “microscopy” which are highly weighted by Tfidf and hence organize next to each other. Measurements and representations of electronic structure group along another edge across from microstructures, showing that the plots have successfully distinguished between two distinct types of images: microstructural maps of materials and electronic structure data. Current maps and x-ray Photon spectra are seen to be outlier groupings not immediately proximate to other groupings, suggesting that these are less commonly provided measurements and are semantically separated from other types of data.
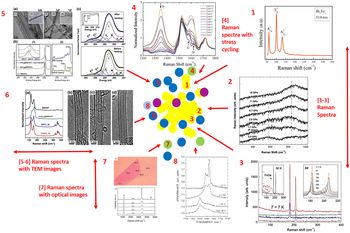
The selection of weighted semantic terms is demonstrated by isolating individual groups as is shown in Fig. 4, with this region corresponding to the Raman spectra region of Fig. 3. Note, each color corresponds with the assigned image type from the NLP-based labeling of the figure (for example, the yellow circles are “Raman spectra” type). The figures represented by the yellow pixels are found to be typical Raman spectra. However, other types of images identified by their labeling color are seen to be adjacent to Raman spectra. For example, image 6 is labeled as a TEM image and upon inspection, it is found that this is a Raman spectrum with a TEM image of the corresponding section under study. Similarly, Raman images with optical micrographs and spectra with stress loading are also identified.
Connection between textual and graphical entries. This provides an alternate approach for representing the existing knowledge on topological superconductors. The inset figures are adapted with permission from references.[Reference Sultana, Neha, Goyal, Patnaik and Awana22–Reference Fontana and Bourson29]

From this, we define a correlation between Raman shift and TEM images. While we are not explicitly accounting for domain expertise, the domain expertise will be reflected in the literature by the number of times concepts appear together, and therefore extracting those correlations helps to guide the ensuing interpretation, although domain expertise is still required for the interpretation of these correlations.
Discussion
As discussed previously, the caption plots provide two critical pieces of information: the number of times the concepts appear (thus representing their perceived importance by domain experts) and the correlation between the concepts. We quantitatively assess correlations between relationships of figures. This correlation is defined by the Euclidean distance between the centers of the groupings captured in the caption plots with a smaller distance indicating a higher correlation. For example, in the prior analysis, Raman spectra is closest to microstructure, as expected since Raman measures atomic bonds as well as phonons in a material. These measures are highly influenced by the microstructure and defect chemistry, thus justifying our interpretation of correlations.
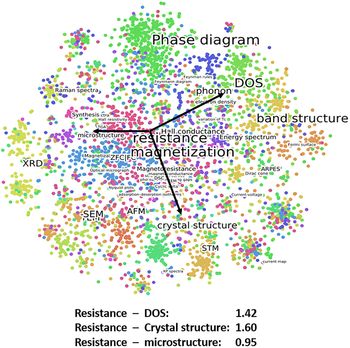
Considering the relationship between quantum properties and length scales, we compare the similarity between resistance and electronic (DOS), crystal and microstructures. We define similarity here as being based on the proximity of points. The distances listed in Fig. 5 are based on the distance between the center points of the groupings, which were defined as described earlier. From these comparisons, we first identify that the microstructure is the least represented measured length scale, as shown by the smaller label size, as compared to DOS/band structure and crystal structure. The second interpretation is that resistance is most closely correlated with the microstructure length scale, as shown in Fig. 5, where the microstructure is the nearest region of interest to resistance. We therefore identify based on the caption analysis that for a quantum property (resistance) that microstructural scale measurements provide the highest related data, although this length scale is also the least represented in the literature. While domain experts working in the field may not be interested in the area of microstructure due to the existing background and knowledge of the experts, the purpose of this paper was to demonstrate a tool which allows someone without expertise in the field to quickly assess the literature landscape, thereby lowering the barrier to cross-cutting between fields and helping to guide the design of information for ensuing data-driven analyses.
Comparison of property (resistance) with measurement length scales. We find that of the electronic, crystallographic, and microstructural length scales, the microstructure is the most connected with the quantum material properties (as seen by the close proximity of the label to “resistance”). Conversely though, we find that microstructure is the least explored of these measures in the quantum material literature (as seen by the smaller label size).

Conclusion
In this paper, we introduced the application of NLP for utilizing vast amounts of information for the analysis of quantum materials, but with this information in the form of text which is usually not utilized in traditional data-driven design. We demonstrated this approach with a case study to assess the state of knowledge in the published literature on microstructure–property relationships in the field of quantum materials. This work included the analysis of 11,000 captions related to topological superconductors from textual resources on topological crystalline insulators and with a vocabulary size of four million words. From this analysis, which introduces a unique visualization tool, we quantified correlations in the data which otherwise go unidentified. An application of this work is to discover quickly where measurements, length scales, and structure–property relationships connect, and not just for one property at a time but for multiple attributes as a single snapshot. Targeting the relationship between the caption and the figure provides the analytical ability to rapidly interpret the state of the field.
Acknowledgments
We gratefully acknowledge support from the National Science Foundation (NSF) DIBBs program, award number 1640867. The authors would also like to acknowledge support from the Toyota Research Institute Accelerated Materials Design and Discovery program. K.R. acknowledges the Erich Bloch Endowed Chair at the University at Buffalo.