I. INTRODUCTION
The discovery of graphene has motivated a vast amount of theoretical and experimental research. The unique electronic and mechanical properties of graphene when compared to other carbon materials make graphene an attractive replacement candidate in existing technologies. For this reason, a global goal consists of producing large quantities of high crystal quality graphenes at low cost to quickly reach commercial applications. The first production method used to isolate graphene sheets, the scotch tape method, was mainly developed to measure the fascinating electronic properties of graphene. Subsequently, other techniques such as lithographic,Reference Tapaszto, Dobrik, Lambin and Biro1 synthetic,Reference Yang, Dou, Rouhanipour, Zhi, Rader and Mullen2 chemical vapor deposition (CVD),Reference Campos-Delgado, Romo-Herrera, Jia, Cullen, Muramatsu, Kim, Hayashi, Ren, Smith, Okuno, Ohba, Kanoh, Kaneko, Endo, Terrones, Dresselhaus and Terrones3 chemicalReference Stankovich, Dikin, Piner, Kohlhaas, Kleinhammes, Jia, Wu, Nguyen and Ruoff4, Reference Horiuchi, Gotou, Fujiwara, Asaka, Yokosawa and Matsui5 or sonochemicalReference Chen, Weng, Wu, Wu, Lu, Wang and Chen6 were developed to improve the yield of hexagonal sheets. Most of these methods are capable of providing highly crystalline graphene, but, unfortunately, are not effective for large-scale manufacturing.Reference Marcano, Kosynkin, Berlin, Sinitskii, Sun, Slesarev, Alemany, Lu and Tour7 Alternative chemical approaches have recently emerged as the best route to obtain graphenes in bulk scale.Reference Marcano, Kosynkin, Berlin, Sinitskii, Sun, Slesarev, Alemany, Lu and Tour7–Reference Dikin, Stankovich, Zimney, Piner, Dommett, Evmenenko, Nguyen and Ruoff9
Traditionally, these chemical approaches use natural graphite as a starting material.Reference Stankovich, Dikin, Piner, Kohlhaas, Kleinhammes, Jia, Wu, Nguyen and Ruoff4, Reference Mack, Viculis, Mayer, Hahn and Kaner10, Reference Schniepp, Li, McAllister, Sai, Herrera-Alonso, Adamson, Prud’homme, Car, Saville and Aksay11 In a first stage, graphene layers within graphite are intercalated and oxidized by reaction with an oxidizing agent in an acid media, thus producing graphite oxide (GO). Subsequently, GO is mechanically or thermally exfoliatedReference Stankovich, Dikin, Piner, Kohlhaas, Kleinhammes, Jia, Wu, Nguyen and Ruoff4–Reference Chen, Weng, Wu, Wu, Lu, Wang and Chen6, Reference Schniepp, Li, McAllister, Sai, Herrera-Alonso, Adamson, Prud’homme, Car, Saville and Aksay11 to generate graphene oxide or graphene oxide nanoplatelets (GONPs). The high oxidation state observed in GO, results in a low electrical conductivity. To recover in-plane electrical conductivity of GO, it is necessary to reduce the oxide, either chemically using hydrazineReference Stankovich, Dikin, Piner, Kohlhaas, Kleinhammes, Jia, Wu, Nguyen and Ruoff4 or thermally in a flowing gas reducing/inert atmosphere.Reference Elias, Nair, Mohiuddin, Morozov, Blake, Halsall, Ferrari, Boukhvalov, Katsnelson, Geim and Novoselov12 Because of the different morphologies of these natural graphites, it has proven difficult to isolate individual GO layers and the yields of monolayer GO with respect to multilayer GO could be extremely low.
Very recently, novel methods that result in the formation of graphene and graphene nanoribbons have been reported by unzipping carbon nanotubes (CNTs).Reference Kosynkin, Higginbotham, Sinitskii, Lomeda, Dimiev, Price and Tour13–Reference Cano-Márquez, Rodríguez-Macías, Campos-Delgado, Espinosa-Gonzalez, Tristán-López, Ramírez-González, Cullen, Smith, Terrones and Vega-Cantu18 This process is efficient and results in a material exhibiting a fewer number of stacked graphene layers when compared to the chemical methods mentioned above, involving graphite as a precursor.Reference Terrones19 Kosynkin et al.Reference Kosynkin, Higginbotham, Sinitskii, Lomeda, Dimiev, Price and Tour13 reported an oxidation process, on the basis of the traditional Hummers and Offeman method,Reference Hummers and Offeman20 in which MWCNTs were unzipped so as to form few-layered graphene nanoribbons. Cataldo et al.Reference Cataldo, Compagnini, Patané, Ursini, Angelini, Ribic, Margaritondo, Cricenti, Palleschi and Valentini15 repeated the same process with single wall carbon nanotubes (SWCNTs). Cano-Marquez et al.Reference Cano-Márquez, Rodríguez-Macías, Campos-Delgado, Espinosa-Gonzalez, Tristán-López, Ramírez-González, Cullen, Smith, Terrones and Vega-Cantu18 reported the oxidation and intercalation of MWCNTs, first by an acid reaction, that removed the CNTs caps, followed by a liquid phase treatment with ammonia and lithium (Birch reaction) and, finally, a thermally driven exfoliation. In the catalytic method described by Elias et al.,Reference Elías, Botello-Méndez, Meneses-Rodríguez, Jehová González, Ramírez-González, Ci, Muñoz-Sandoval, Ajayan, Terrones and Terrones16 metallic catalytic particles longitudinally unzipped MWCNTs. Jiao et al.Reference Jiao, Zhang, Wang, Diankov and Dai14 partially embedded MWCNTs in a polymer film and etched them with an argon plasma to obtain the graphene material. Finally, Kim et al.Reference Kim, Sussman and Zettl17 produced nanographenes by passing a high electric current through a nanotube.
Taking into account the references mentioned above, and the simplicity and potential of the chemical techniques applied to carbon nanofilaments, we now report an alternative route to form GONPs, based on the chemical oxidation (Hummers and Offeman method) followed by mechanical exfoliation, using helical-ribbon carbon nanofibers (HR-CNFs) as a precursor. The resulting GONPs are compared with graphenes obtained from natural graphite and MWCNTs.
The HR-CNF structure, fully described elsewhere,Reference Varela-Rizo, Rodriguez-Pastor, Merino and Martin-Gullon21, Reference Vera-Agullo, Varela-Rizo, Conesa, Almansa, Merino and Martin-Gullon22 consists of a multilayer ribbon (5-6 stacked graphene layers) rolled up along the fiber axis so as to form a continuous spiral. The low number of layers makes the unraveling of the fiber into graphene nanoplatelets more efficient; natural graphite possesses many more stacked layers and their isolation in individual sheets becomes more complicated. Compared to MWCNTs, HR-CNFs are lower cost, more reactive, and facilitate interlaminar accessibility to different intercalants. These combined features indicate that HR-CNFs could be one of the best starting materials to generate large quantities of graphene platelets and ribbons.
II. EXPERIMENTAL
Commercial GANF HR-CNFs (Grupo Antolin Ingenieria, Burgos, Spain) used in the present work are produced by CVD using the floating catalyst method. The distribution of diameters of these fibers is between 20 and 80 nm, but larger diameters are also found (see data sheet23). A more complete description of these nanofibers can be found elsewhere.Reference Vera-Agullo, Varela-Rizo, Conesa, Almansa, Merino and Martin-Gullon22, Reference Martin-Gullon, Vera, Conesa, Gonzalez and Merino24 MWCNTs were obtained from the University of Kentucky, Center for Applied Energy Research (Lexington, KY) and are synthesized by a CVD substrate method with diameters of around 20–25 nm.Reference Andrews, Jacques, Rao, Derbyshire, Qian, Fan, Dickey and Chen25, Reference Jacques and Andrews26 The natural graphite was Timrex 50×80 (particle size 150–250 μm) supplied by TIMCAL (Bodio, Switzerland).
The GONPs synthesis is based on the Hummers and Offeman oxidation method, adapted to CNTs by Kosynkin et al.Reference Kosynkin, Higginbotham, Sinitskii, Lomeda, Dimiev, Price and Tour13 Summarizing, 1g of GANF is mixed with 200 mL of concentrated H2SO4 for 2 h by mechanical stirring on a hot plate at room temperature. Subsequently, the appropriate amount of KMnO4 is added to the suspension and stirred for 1 h, before the temperature is increased to 55 °C for 30 min, 70 °C for an additional 30 min, and then the reaction naturally cools down to room temperature. The room temperature mixture is poured into 400 mL of ice with 40 mL of H2O2. The H2O2 reacts with the unreacted permanganate and avoids MnO2 precipitation.Reference Kosynkin, Higginbotham, Sinitskii, Lomeda, Dimiev, Price and Tour13 The solid is then separated by filtration, washed with water, coagulated with a 20% solution of HCl, and filtered again. The collected solid is washed with ethanol, coagulated with ether, filtered, and dried in an oven at 70 °C overnight. The obtained GONPs are highly soluble in water and polar solvents. Finally, mechanical exfoliation is carried out in isopropanol, water or other polar solvents by tip sonication at 30 W for 2 h, in 60 s ON–30 s OFF intervals. This mechanical exfoliation increases the yield of single-layered graphene oxide.
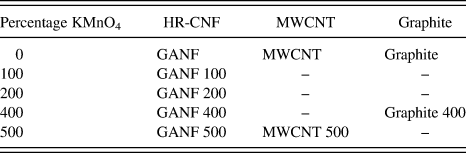
The conversion of HR-CNFs into GONPs was studied for different concentrations of permanganate with respect to GANF CNFs: 100, 200, 400, and 500%. GONPs were also obtained from MWCNTs at 500% KMnO4 and graphite at 400% KMnO4. The reaction conditions for MWCNTs as a precursor were identical to the method described above. For graphite, the flakes were mixed with H2SO4 for more than 12 h and the reaction conditions were more severe: the temperature was increased to 98 °C and it was left for 24 h. After sonication, GONPs from GANF and MWCNTs were totally stable, while a significant amount of GO derived from graphite, settled to the bottom of the flask, thus suggesting that the exfoliation process was incomplete. Table I summarizes the treatments and the nomenclature used for each sample.
Treatments and nomenclature.

Transmission electron microscopy (TEM) studies were performed using a JEOL JEM-2010 microscope operating at 200 keV (JEOL Ltd., Tokyo, Japan). In particular, GONPs were dispersed in isopropanol, and a few drops were deposited onto 300 mesh holey, lacey carbon grids. Atomic force microscopy (AFM) images were obtained using a Nanoscope IIIa (Veeco, Plainview, NY) in intermittent contact mode. Samples were prepared by the simple deposition of a diluted dispersion of GONPs/isopropanol onto a silica surface. For graphite 400, drops were taken from the supernatant.
Fourier-transform infrared spectroscopy was carried out with a BRUKER IFS 66 Infrared (Bruker Optik GmbH, Ettlingen, Germany), using an attenuated total refflectance (IR-ATR) attachment. X-ray photoelectron spectroscopy (XPS) was performed in a VG-Microtech Multilab 3000 (VG Microtech, East Sussex, UK). Powder x-ray diffraction patterns were obtained using a Bruker D8-Advance diffractometer (CuKα radiation; X-Ray wave length, λ = 1.5406 Å; operating energy, 40 keV; cathode current, 40 mA; scan rate 1°/min). Raman spectra were recorded in a LabRam scope (Jobin Yvon S.A.S., Alcobendas-Madrid, Spain) using the 633 nm He-Ne laser line. Finally, the thermal stability was studied using a thermogravimetric analysis (TGA)/SDTA851e/SF/1100 Mettler Toledo, from room temperature to 1000 °C at 10 °C/min under N2.
III. RESULTS AND DISCUSSION
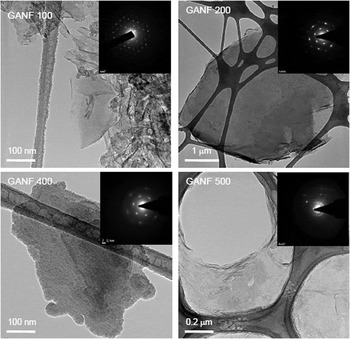
TEM micrographs of GONPs obtained from GANF treated with different KMnO4 concentrations are shown in Fig. 1. At 100% of oxidizing reagent (Fig. 1 GANF 100), both GONPs as well as highly damaged CNFs are visible. When doubling the KMnO4 concentration to 200% (Fig. 1 GANF 200), the proportion of the remaining CNFs decreases, although few filaments could still be observed. At 400% KMnO4 (Fig. 1 GANF 400), the nanofiber conversion and exfoliation into GONPs are high. There is little difference in the resulting product using 500% KMnO4 (Fig. 1 GANF 500) except for edge damage as the acid and the KMnO4 concentrations increase. GONP surface area ranged from 100 × 100 nm to several square microns, depending on the parent nanofiber diameter.23
Transmission electron microscopic (TEM) images and selected-area electron diffraction (SAED) patterns of graphene oxide nanoplatelets (GONPs) obtained from GANFs treated with different KMnO4 concentrations: 100% (GANF 100), 200% (GANF 200), 400% (GANF 400), and 500% (GANF 500).

In all cases, the selected-area electron diffraction (SAED) patterns revealed defined spots, thus confirming the sixfold symmetry expected for individual graphene sheetsReference Chen, Weng, Wu and Wu27 or a perfect AB stacking hexagonal structure.Reference Jeong, Lee, Lahaye, Park, An, Kim, Yang, Park, Ruoff and Lee28 It was observed that the intensity of the SAED pattern decreased in the most oxidized samples. We believe that the high intensity patterns arise from highly crystalline nanoplatelets, whereas the lower intensity patterns could be the result of diffracting single- or few-layered graphene oxide.
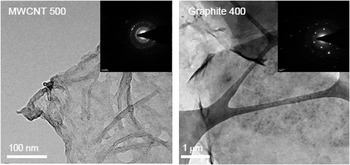
Figure 2 shows the resulting GONPs obtained from MWCNTs (Fig. 2 MWCNT 500) and graphite (Fig. 2 Graphite 400). The MWCNT 500 sample is similar to GANF 500, but there are still many unzipped nanotubes. The SAED pattern consists of concentric circles, indicating a more disordered structure. On the other hand, GONPs from graphite are larger in size and, even though the sample was taken from the supernatant, they have many more stacked layers. They do appear more ordered, as demonstrated by the hexagonal SAED pattern.
TEM micrographs and SAED patterns of GONPs obtained from multiwall carbon nanotubes (MWCNTs) treated with 500% KMnO4 (MWCNT 500) and from graphite treated with 400% KMnO4 (graphite 400).

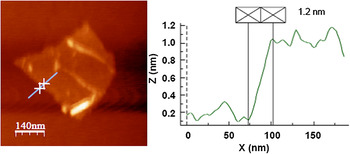
AFM studies revealed that the thickness of the GONPs from GANFs of ∼1.2 nm (Fig. 3), which has been attributed to hydrated single-layer graphene oxide over AFM substrates.Reference Stankovich, Dikin, Piner, Kohlhaas, Kleinhammes, Jia, Wu, Nguyen and Ruoff4, Reference Schniepp, Li, McAllister, Sai, Herrera-Alonso, Adamson, Prud’homme, Car, Saville and Aksay11 Higher profiles were also observed, corresponding to GONPs consisting of 5–6 stacked layers.
Atomic force microscopic image of an individual graphene oxide nanoplatelet obtained by treating GANFs with KMnO4 at 400%.

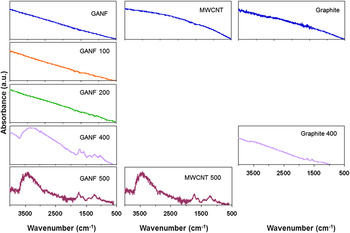
IR-ATR spectra of each sample are shown in Fig. 4. At 100 and 200% KMnO4 there is little evidence of the oxidation process but it becomes clear at 400 and 500% KMnO4. The presence of OH− groups is suggested by the band at 3384 cm−1 and the smooth bands located at 1348 and 1193 cm−1 correspond to the C–OH stretch signals.Reference Cataldo, Compagnini, Patané, Ursini, Angelini, Ribic, Margaritondo, Cricenti, Palleschi and Valentini15, Reference Si and Samulski29 The C–O–C moiety can be observed at 1004 cm−1,Reference Cataldo, Compagnini, Patané, Ursini, Angelini, Ribic, Margaritondo, Cricenti, Palleschi and Valentini15 while the ketone groups are indicated by the absorption bands situated at 1689 and 1569 cm−1.Reference Cataldo, Compagnini, Patané, Ursini, Angelini, Ribic, Margaritondo, Cricenti, Palleschi and Valentini15, Reference Si and Samulski29 The band located at 1689 cm−1 suggests ketone groups in carboxylic acid, anhydride, and/or in aldehyde,Reference Cataldo, Compagnini, Patané, Ursini, Angelini, Ribic, Margaritondo, Cricenti, Palleschi and Valentini15 while the band at 1569 cm−1 is associated with α,β-unsaturated ketones.Reference Cataldo, Compagnini, Patané, Ursini, Angelini, Ribic, Margaritondo, Cricenti, Palleschi and Valentini15, Reference Cataldo30 Epoxide groups are also frequently observed in graphene oxides and are represented by a slight band appearing at 830 cm−1. MWCNT 500 exhibits a similar spectrum as shown by GONP 500, thus suggesting that the product is nearly the same, regardless of the starting material. The acid exfoliation treatment is much less effective in graphite, because the oxidation degree is much lower when compared to MWCNTs or GANF at similar KMnO4 concentrations.
IR-ATR spectra of the original and the oxidized samples in the presence of KMnO4. GANF (left), MWCNTs (center), and graphite (right).

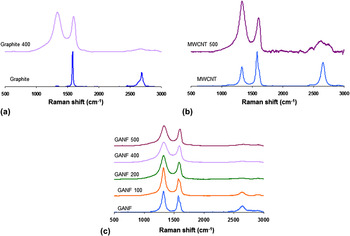
Raman spectra from the different oxidized/exfoliated samples can be seen in Fig. 5. The simplest Raman spectra corresponds to graphite [Fig. 5(a)], revealing the presence of the G-band (1580 cm−1), related to the E2g graphite mode and indicating C–C stretching vibrations.Reference Stobinski, Lesiak, Kövér, Tóth, Biniak, Trykowski and Judek31 In the natural graphite used in this study, a very minute D-band appeared at 1340 cm−1, which reflects the high density of states for zone edge phonons.Reference Nemanich and Solin32, Reference Chieu, Dresselhaus and Endo33 Furthermore, the 2D-band was also observed at 2700 cm−1, with two contributions 2D1 and 2D2.Reference Nemanich and Solin32
Raman spectra of: (a) GANF and GONPs from GANFs; (b) MWCNTs and GONPs from MWCNTs, and (c) Graphite and GONPs from graphite.

The intensities of the D-band increases in the MWCNTs spectra [pristine and acid-treated MWCNTs; Fig. 5(b)], involving an increase of the I D/I G ratio from 0.02, in graphite, to 0.69 for pristine MWCNTs and 1.2 for acid-treated MWCNT 500. This increase could be due to the presence of edges in the GONPs and other functional groups such as the epoxy, carbonyl, or carboxyl. For the pristine MWCNTs, the D’-band located at 1620 cm−1, appears as a very smooth shoulder next to the G-band, indicating the high density of states for midzone phonons.Reference Nemanich and Solin32, Reference Chieu, Dresselhaus and Endo33 Note that the 2D-band is symmetric for pristine MWCNTs,Reference Cataldo, Compagnini, Patané, Ursini, Angelini, Ribic, Margaritondo, Cricenti, Palleschi and Valentini15, Reference Stobinski, Lesiak, Kövér, Tóth, Biniak, Trykowski and Judek31 whereas the acid-treated MWNCTs reveal a very broad 2D-band.
GANF CNFs reveal the bands associated with a graphitic material [Fig. 5(c)]. However, in this case, the D-band intensity exceeds the G-band intensity, with I D/I G ratios of ∼1.20. These larger intensities of GANFs could be explained by the presence of edges caused by the twisted helix forming the fiber. The D’-band is also more noticeable. Some of the CNFs bare edges could coalesce forming loops, and these loops, in addition to the commensurability of the adjacent graphene layers, could result in the appearance of a more defined D’-band.
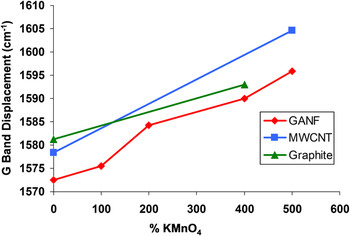
Independent of the starting material, the G-band is stretched and shifted at higher frequenciesReference Stankovich, Dikin, Piner, Kohlhaas, Kleinhammes, Jia, Wu, Nguyen and Ruoff4, Reference Cataldo, Compagnini, Patané, Ursini, Angelini, Ribic, Margaritondo, Cricenti, Palleschi and Valentini15 (Fig. 6). At the highest oxidation degree, the G peak of the MWCNTs is shifted more than the G-band for GANFs. Simultaneously, the 2D peak slightly shifts at lower frequencies.Reference Cataldo, Compagnini, Patané, Ursini, Angelini, Ribic, Margaritondo, Cricenti, Palleschi and Valentini15 The D’-band disappears in both oxidized MWCNTs and GANFs. The 2D-band of the samples produced from GANF tends to disappear as the oxidation degree increases. The D-band of the GONPs is more prominent, thus suggesting the increase of bare edges due to the reduction in size of the in-plane sp2 domains, caused by the strong oxidation.Reference Stankovich, Dikin, Piner, Kohlhaas, Kleinhammes, Jia, Wu, Nguyen and Ruoff4 For this reason, the I D /I G ratio increases proportional to the oxidation degree. In the particular case of GANF, the intensity of the D peak decreases when increasing the KMnO4 concentration and the ID/IG ratio does not change significantly (from 1.45 in GANF 100 to 1.19 in GANF 400 and does not change in GANF 500). This is because GANF already has bare edges; twisted ribbon along the fiber axis. For MWCNTs and graphite, the GONP formation creates edges and defects that are responsible for inducing a large intensity of the D-band.
G Band displacement versus KMnO4 concentration. Numbers indicate displacement of the band with respect to the shift of the nonoxidized product.

It is important to note that the TourReference Kosynkin, Higginbotham, Sinitskii, Lomeda, Dimiev, Price and Tour13 and the ValentiniReference Cataldo, Compagnini, Patané, Ursini, Angelini, Ribic, Margaritondo, Cricenti, Palleschi and Valentini15 groups used MWCNTs and SWCNTs as starting materials, respectively, whereas Ruoff’sReference Stankovich, Dikin, Piner, Kohlhaas, Kleinhammes, Jia, Wu, Nguyen and Ruoff4 group used natural graphite as a precursor. In the first two cases, the resultant materials consisted of graphene nanoribbons and platelets, and in the second case, Ruoff’s materials were large sheets of GO. However, the Raman results in these three different types of material are similar and other characterization techniques are needed to be used to observe the differences.
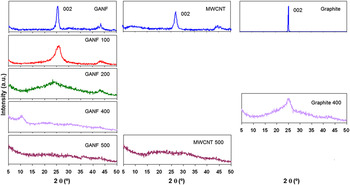
Powder x-ray diffraction (XRD) data show the changes induced in the structure after oxidation. The three starting materials are graphite-like with an interlayer spacing of ∼0.34 nm [(002) planes; Fig. 7].Reference Kosynkin, Higginbotham, Sinitskii, Lomeda, Dimiev, Price and Tour13 Oxidation results in an increase of the interlayer spacing of graphite.Reference Kosynkin, Higginbotham, Sinitskii, Lomeda, Dimiev, Price and Tour13 At 100 and 200% of KMnO4, the 2θ peak of GANF located at 25.6° is still present but has widened and reduced its intensity (Fig. 7 left). At 400% of KMnO4, the diffraction of the (002) plane disappears and a new peak arises at 2θ=10.6° (Fig. 7 left), corresponding to an interlayer spacing of 0.82 nm, associated to graphene oxide interlaminar space,Reference Stankovich, Dikin, Piner, Kohlhaas, Kleinhammes, Jia, Wu, Nguyen and Ruoff4 as reported for the GO synthesis.Reference Kosynkin, Higginbotham, Sinitskii, Lomeda, Dimiev, Price and Tour13, Reference Zhao, Zhang, Chen and Lu34 Interestingly, GANF 500 does not show any clear diffraction, thus suggesting the complete exfoliation of the helical fibers into isolated GO layers. Oxidized MWCNTs (Fig. 7 center) reveal a broad and very weak diffraction signal ∼25.6°.Reference Kosynkin, Higginbotham, Sinitskii, Lomeda, Dimiev, Price and Tour13 In addition, the XRD patterns of graphite 400 and GANF 200 appear similar, suggesting an incomplete oxidation and not fully exfoliated graphitic structure (Fig. 7 right).
X-ray diffraction patterns for GANF (left), MWCNTs (center), and graphite (right).

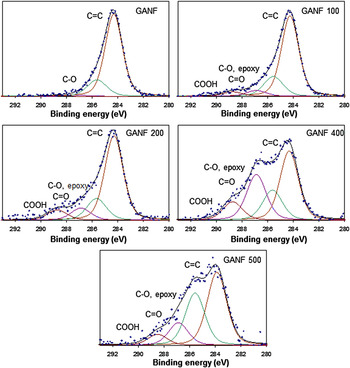
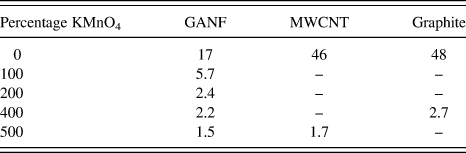
A deeper analysis of the functional groups present in the GONPs was performed by XPS. The C1s XPS spectra of pristine GANF and its oxidized products are shown in Fig. 8. Oxygen moieties are progressively evident when increasing the KMnO4 ratio. The C1s XPS spectrum of pristine GANFs exhibits a main peak at a binding energy of 284.5 eV caused by the sp2 hybridized C=C bond,Reference Stankovich, Dikin, Piner, Kohlhaas, Kleinhammes, Jia, Wu, Nguyen and Ruoff4, Reference Cataldo, Compagnini, Patané, Ursini, Angelini, Ribic, Margaritondo, Cricenti, Palleschi and Valentini15, Reference Stobinski, Lesiak, Kövér, Tóth, Biniak, Trykowski and Judek31 characteristic of graphite-like structures. Apart from the predominant C=C bond, the signals from the oxidized samples could be deconvoluted into three other contributions, corresponding to carbon atoms linked to oxygen in different ways: C–O and epoxy groups (286.5 eV), carbonyl (287.5 eV), and carboxylic groups (289.0 eV).Reference Stankovich, Dikin, Piner, Kohlhaas, Kleinhammes, Jia, Wu, Nguyen and Ruoff4, Reference Cataldo, Compagnini, Patané, Ursini, Angelini, Ribic, Margaritondo, Cricenti, Palleschi and Valentini15, Reference Waltman, Pacansky and Bates35 The intensity of those peaks is proportional to the oxidation degree. Likewise, the C/O ratio decreases from 17, in the starting GANF, to 5.7, 2.7, 2.2, and 1.5, respectively, as a function of the KMnO4 concentrations (see Table II). The C/O ratio of the most oxidized GANF is similar to the values found in previous published work using other sources of graphite.Reference Kosynkin, Higginbotham, Sinitskii, Lomeda, Dimiev, Price and Tour13, Reference Kalaitzidou, Fukushima and Drzal36
C1s x-ray photoelectron spectroscopy (XPS) spectra of GANF and oxidized GANF with different concentrations of KMnO4.

C/O ratio for GANF, MWCNT, graphite, and the oxidized samples using KMnO4.

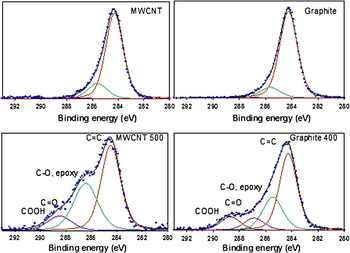
Figure 9 shows the C1s XPS spectra of MWCNTs, graphite, and their corresponding oxidized products. Similar to GANF, pristine MWCNTs and graphite spectra mainly display the C=C peak. The acid-treated MWNCTs provide a similar spectrum to that of GANF 500. The C1s XPS data of graphite 400 is more similar to the less-oxidized GANF 200, with a C/O ratio slightly higher than that sample.
C1s XPS spectra of MWCNTs, graphite, and their oxidized products using KMnO4.

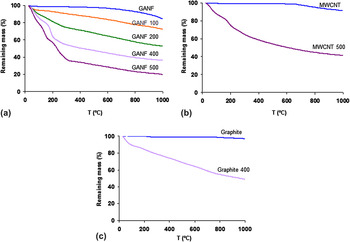
Figure 10 compares the TGA plots under a nitrogen atmosphere for GANF, MWCNTs, graphite, and the oxidized materials using different concentrations of KMnO4. Pristine GANF experiences an initial weight loss of about 2% at 150 °C due to physisorbed water.Reference Ros, van Dillen, Geus and Koningsberger37, Reference Smith, Milton, Hedges, LaCount, Kern, Shah, Huffman and Bockrath38 At ∼500 °C, a pronounced drop occurs, suggesting the gasification of carbon due into small residual content of H2O vapor in the gas flow. The final weight loss is ∼14%. Oxidized samples are more thermally unstable. The more oxidized the more decomposition of oxygen groups, which means higher weight losses. Up to temperatures of 150 °C, the weight loss is mainly due to physisorbed water, as in the original sample.Reference Ros, van Dillen, Geus and Koningsberger37, Reference Smith, Milton, Hedges, LaCount, Kern, Shah, Huffman and Bockrath38 Decomposition of the oxygen groups into CO and CO2Reference Ros, van Dillen, Geus and Koningsberger37 causes further weight loss. Again, residual water in the gas flow burns the remaining carbon over 500 °C. In the most oxidized samples, decomposition in different stages is more evident,Reference Stankovich, Dikin, Piner, Kohlhaas, Kleinhammes, Jia, Wu, Nguyen and Ruoff4 as indicated by the different drops in the TGA curves. Similar behavior is detected in the MWCNT samples, although final weight loss is lower.
Thermogravimetric analysis plots for GANF, MWCNTs, graphite, and their oxidized products in the presence of KMnO4.

Graphite particles are larger in size and avoid carbon gasification at high temperatures. Final weight loss is much lower when compared to the other forms of carbon discussed above; less physisorbed water. TGA of the oxidized graphite sample shows similar trends and weight loss when compared to GANF treated with 200% of KMnO4.
The oxidation of GANF with 100% KMnO4 results in a mixture of large content of crystalline graphites, low content of GONPs, and the rest consisting of damaged CNFs. At 200% KMnO4, the proportion of GONPs increases along with a higher degree of oxidation. Finally, when using 400% KMnO4, oxidation effects are severe, as shown by the presence of GONPs edges, and nearly all CNFs have been converted into GONPs. AFM studies confirmed the formation of single-layer graphene oxide and few-layer graphene oxide nanoplatelets. The former is also confirmed by the absence of XRD (GANF 500). Similar results were found with MWCNTs, although various tubes were still observed to be partially unzipped. When graphite is used as starting material, larger GONPs are created, but both, the yield and the degree of exfoliation are lower when compared to MWCNTs and GANFs. Evaluation of IR, XRD, XPS, and Raman suggests that the oxidation degree achieved in the graphite treated with 400% KMnO4 is similar to that obtained in GANF treated with 200% KMnO4. The reaction is, then, more effective in GANF, when compared to graphite.
IV. CONCLUSION
A new route for synthesizing GONPs has been described. The material is novel since the starting material consists of twisted ribbon-shaped nanofibers. Their characterization using different techniques was consistent and confirmed the presence of single-layer graphene oxide. In addition, the Hummers and Offeman method allows the oxidation control and exfoliation degree, providing a different range of graphene products. The results indicate that HR-CNFs could be considered as an excellent starting material for obtaining low cost highly crystalline graphene platelets that could be used in the development of novel composites, conducting transparent electrodes and electronic devices.
ACKNOWLEDGMENTS
HVR thanks the Spanish Ministry of Education, FPU program. MT thanks JST-Japan for funding the Research Center for Exotic NanoCarbons, under the Japanese regional Innovation Strategy Program by the Excellence.