


Introduction
As global climate changes, there is an accordant trend toward global recession and wasting of glaciers (Reference OerlemansOerlemans, 1994; Reference Dyurgerov and MeierDyurgerov and Meier, 1997; Reference OerlemansOerlemans and others, 1998). These changes are thought to be more rapid in the Himalaya than in many other places and are expected to continue this century (Reference Ageta and KadotaAgeta and Kadota, 1992; Reference Nakawo, Fujita, Ageta, Shankar, Pokhrel and TandongNakawo and others, 1997; Reference HasnainHasnain, 1999; Reference Naito, Nakawo, Kadota and RaymondNaito and others, 2000). Retreat of the Himalayan glaciers near our study area has been linked to climate warming (Reference Ageta and KadotaAgeta and Kadota, 1992) and to a decrease in precipitation since the 1940s (Qin and others, 2000). The particular vulnerability of Himalayan glaciers to climate warming is due to the facts that (1) they are summer accumulation types dependent on summer monsoonal precipitation and cool summer temperatures (Reference Ageta and HiguchiAgeta and Higuchi, 1984), and (2) the summer mass balance of these glaciers consequently is nearly equal to the annual mass balance (Reference Kadota, Seko and AgetaKadota and others, 1993).
Glacier recession impacts long-term and seasonal patterns and annual availability of fresh water and hydropower-generating capacity (Johannesson, 1997; Reference Braun, Weber and SchulzBraun and others, 2000). These changes are, for the short term, not all deleterious, though in the long term they may cause major economic disruptions. Retreat of glaciers in a heavily glaciated watershed characteristically causes increased water flow during the ablation season for a period lasting several decades, and then diminishing water flow during the ablation season for several more decades; as the glaciers waste to insignificance, the watershed becomes more prone to drought. The four provinces of western China receive about 10% of their fresh water from glacier runoff (Reference YangYang and Hu, 1992), and in the Tarim basin this value reaches 50% (Yang, 1991). Glacier contributions increase during the dry season due to glacial storage capacity and seasonal ablation behavior. In heavily glaciated areas, and particularly where the climate is arid to semi-arid, the existence and mass balance of glaciers dominates the local hydrology and is paramount to any issues pertaining to water availability.
Where glaciers stagnate and heavy debris cover accumulates in the terminus region, there is another important consequence related to generation of meltwater. Supraglacial ice-dammed and moraine-dammed ponds and lakes abound on many of these glaciers (Reference KonovalovKonovalov, 2000), lending a chaotic potential for glacier lake outburst floods (GLOFs) and destruction of property and loss of human life in areas downstream (Ding and Liu, 1992; Reference LiuLiu, 1992; Reference ZhangZhang, 1992; Reference MoolMool, 1995; Reference AgetaAgeta andothers, 2000; Reference Raymond and NolanRaymond and Nolan, 2000; Reference ReynoldsReynolds,2000; Reference Richardson and ReynoldsRichardson and Reynolds, 2000b). An estimated 32000 people have been killed by GLOFs in Peru during the last century (Reference Richardson and ReynoldsRichardson and Reynolds, 2000b). Himalayan GLOFs also have a historic record of wreaking havoc and killing people; the toll in the Himalaya in the last half-century is in the hundreds (Reference Richardson and ReynoldsRichardson and Reynolds, 2000b), with hydroelectric dams, roads, bridges, agricultural land and villages also washed away (Ding and Liu, 1992; Reference AgetaAgeta and others, 2000). When transportation corridors and hydroelectric-generating capacity is at stake, the economic development of countries such as Nepal and Bhutan hinges partly on the understanding of GLOFs and the ability to plan for or control them (Reference Meon and SchwarzMeon and Schwarz, 1993; Reference Chhetri and IngletonChhetri, 1999; Reference Richardson and ReynoldsRichardson and Reynolds, 2000b).
As Himalayan glaciers continue to waste and as new lakes form and old ones grow there will no doubt be a continuing series of natural disasters related to GLOFs. Strategies for remediation of this type of threat are being evaluated and implemented at some potentially destructive lakes in Nepal and Peru (Reference ReynoldsReynolds, 1999; Reference Richardson and ReynoldsRichardson and Reynolds, 2000a). Even if catastrophic outbursts are absent, supraglacial lakes and lake-shore ice cliffs are important for the thermal and mass balance of glaciers (Reference Chikita, Jha and YamadaChikita and others, 1999; Reference Sakai, Takeuchi, Fujita and NakawoSakai and others, 2000) and are important components of the hydrology-relateddynamicalbehavior of glaciers (Reference Humphrey, Raymond and HarrisonHumphrey and others, 1986; Reference Fountain and WalderFountain and Walder, 1998).
An example of the type of remediation that can be conducted if a hazardous situation is caught in time is a $2.9 million emergency project to partially drain the eastern Nepal lake Tsho Rolpa. That lake threatened a large GLOF, which likely would have destroyed several villages, a hydroelectric project and potentially the lives of over 1500 workers laboring on that hydro project (Reference ReynoldsReynolds, 1999).Tsho Rolpa, which had been filling rapidly and whose ice-cored moraine dam had been undergoing alarming rates of thermokarstic erosion and formation of supramorainalponds, is thought to have come within days or weeks of bursting when the lake level was finally artificially lowered by several meters (B. Rana, unpublished information).
Dangerous or potentially hazardous supraglacial lakes have generally been identified after the fact by disasters they have caused, or before they wreak havoc on the basis of several defined dynamical developments and situational criteria (Reference Grabs and HanischGrabs and Hanisch, 1993; Reference Yamada and SharmaYamada and Sharma, 1993; Reference ReynoldsReynolds, 1999; Reference Richardson and ReynoldsRichardson and Reynolds, 2000b). Satellite observations can contribute to systematic surveys of supraglacial lakes and evaluation of how they meet these criteria (Reference AgetaAgeta and others, 2000). Below we investigate the applicability of Advanced Spaceborne Thermal Emission and Reflection Radiometer (ASTER) imagery for evaluation of certain qualities of supraglacial lakes in the Mount Everest region.
Tracking Supraglacial Lakes In The Eastern Himalaya
Aspects of supraglacial lakes related to hazards, glacier behavior and climate change make them an important glaciological feature to monitor. Satellite imaging has been used since the 1970s to track decadal changes in Himalayan glaciers, including glacier terminus position and area and the extent and number of moraine-dammed and supraglacial lakes (Reference AgetaAgeta and others, 2000; Reference Benn, Wiseman and WarrenBenn and others, 2000). Detailed field measurements and aerial surveys go back to the 1940s or 1950s in areas near our present application in the Khumbu Himal region near Mount Everest (Nepali: Sagarmatha; Chinese: Qomolangma; location: 27°59’N, 86°56’ E). These studies provide a baseline of observations and have sufficient temporal coverage to provide key insights into the origin, growth and drainage of supraglacial lakes. However, with the exceptions of a few lakes (e.g.Tsho Rolpa), the frequency of observations has been insufficient to yield an understanding of some key processes and to permit emergency or mitigative action to be taken in response to some particular threatening situations or even to recognize many potentially threatening lakes.
Annual measurements of supraglacial lakes near the time of maximum melting rate (generally mid-summer) would constitute a significant minimum monitoring capability sufficient for the needs outlined above. Supraglacial lakes have sizes ranging from a few meters to a few kilometers across, so ideal monitoring should have a resolution sufficient to resolve lakes of these sizes. Whereas field observations and aerial surveys provide the needed spatial resolution and are crucial for validation of satellite remote sensing, they generally lack the needed temporal frequency. Early-generation Earth remote-sensing satellites have contributed greatly to the study of supraglacial lakes. Modern remote-sensing satellites have improved sensor capabilities and data downlink capacity to permit regular monitoring of glacier status and to better evaluate the threat potential of supraglacial lakes.
In the following sections we demonstrate an application of ASTER images to detect and monitor supraglacial lakes larger than about 20 min diameter. The ASTER instrument on NASA’s Terra platform is well suited to the task because of
(a) its high spatial resolution in visible/near-infrared (VNIR) (15m/pixel in three bands, 0.51–0.86 μm),
(b) combination with six bands of shortwave infrared (SWIR) (1.6–2.4 μm, at 30 m/pixel), and five bands of thermal infrared (TIR) (8–12 μm, at 90 m/pixel),
(c) one band of along-track VNIR stereo for digital elevation model (DEM) generation and topographic analysis, and
(d) high data downlink rate allowing frequent repeat coverage (see Reference Kahle, Palluconi, Hook, Realmuto and BothwellKahle and others, 1991; Reference Yamaguchi, Tsu and FujisadaYamaguchi and others, 1993).
Furthermore, the current data policy for the Earth Observing System, including ASTER, is for free dissemination of data, and the cost is not apt to be prohibitive even after an at-cost-of-distribution policy may go into effect. Older Landsats lacked such high spatial resolution in VNIR and high repeat coverage rate, and all Landsats lack so many thermal bands and stereo capability. Système Probatoire pour l’Observation de la Terre (SPOT) and Landsat Thematic Mapper imagery can be very useful for glacial lake studies (Reference AgetaAgeta and others, 2000), but it is very expensive and lacks some capabilities such as along-track stereo and multiband thermal.
We use ASTER images to (1) map the locations and sizes of supraglacial ponds on several Himalayan glaciers in the Mount Everest area of Tibet and Nepal, and (2) make some observations regarding the spectral properties and water temperatures of these lakes. We have not yet, however, used the stereo capability of ASTER in lake studies. Comprehensive annual imaging of Himalayan glaciers by ASTER recently began under the Global Land Ice Measurements from Space (GLIMS) project (see http://www.GLIMS.org),and the simplicity of the techniques applied here potentially will allow complete and cost-effectivemapping of supraglacial lakes and annual measurement of changes throughout the Himalaya and elsewhere.
Classification And Temperature Measure-Ments Using Aster Images
Methods
We use both ASTER Level-1B (L1B) calibrated data and Level-1A (L1A) uncalibrated data for our analyses. L1A data are reconstructed, unprocessed instrument data at full resolution. The L1B data are radiometrically calibrated to radiance (scaled 0–255) and geometrically resampled to a map projection. All acquired image data are required to be produced to L1A and archived. L1B data are produced only if the ASTER cloud-assessment algorithm determines low cloud cover or if a user requests a L1B product from Japan. While we would prefer to use only calibrated ASTER L1B data, 450% of scenes with significant snow and ice cover are mistakenly tagged as cloudy, so few L1B images exist over glaciers at this writing. Therefore, to test our ability to resolve and discriminate between features on a wide variety of debris-covered glaciers, we also used uncalibrated ASTER L1A data (that we destripe and register the bands).
Before detailed analysis begins, we rescale ASTER L1B VNIR and SWIR data to the at-sensor spectral radiance Li (Wm–2 sr–1mm–1) for each pixel, using the gains listed for each band in the ASTER global metadata, Li = gain(DN-1). For comparison to published laboratory spectra, we converted at-sensor radiance to reflectance according to Reflectance =  where Ld is the dark object radiance for each band, is the in-band solar spectral ir-Esun radiance in Wm–2 nm–1, ud is the distance between the Earth and Sun in astronomical units, and i is the solar incidence angle assuming a horizontal surface (accurate for lakes, and approximate for some glacier surfaces).
Our classification strategy uses a combination of simple ratios of ASTER bands 1 (0.56 mm), 3 (0.81 μm) and 4 (1.66 μm) to define liquid water, snow, ice and non-H2O surfaces of interest, and to subdivide water into bright water (relatively turbid) and dark water (relativelyclear) (Figs1–3). To find the greatest band contrast and spectral characteristics of each class of materials, we plot the average spectra for each type of material (Fig. 4).
(a) Portion of a geometrically corrected and radiance-calibrated ASTER Level 1BVNIR false-color image (321RGB) of glaciers in the Tibetan Himalaya (approximately one-sixth of total scene). (b) Terrain classification of (a). Classification is preliminary, pending field verification/validation. (c) Enlarged portion of (a) showing stagnating terminus region of Rongbuk glacier. (d) Terrain classification of (c).

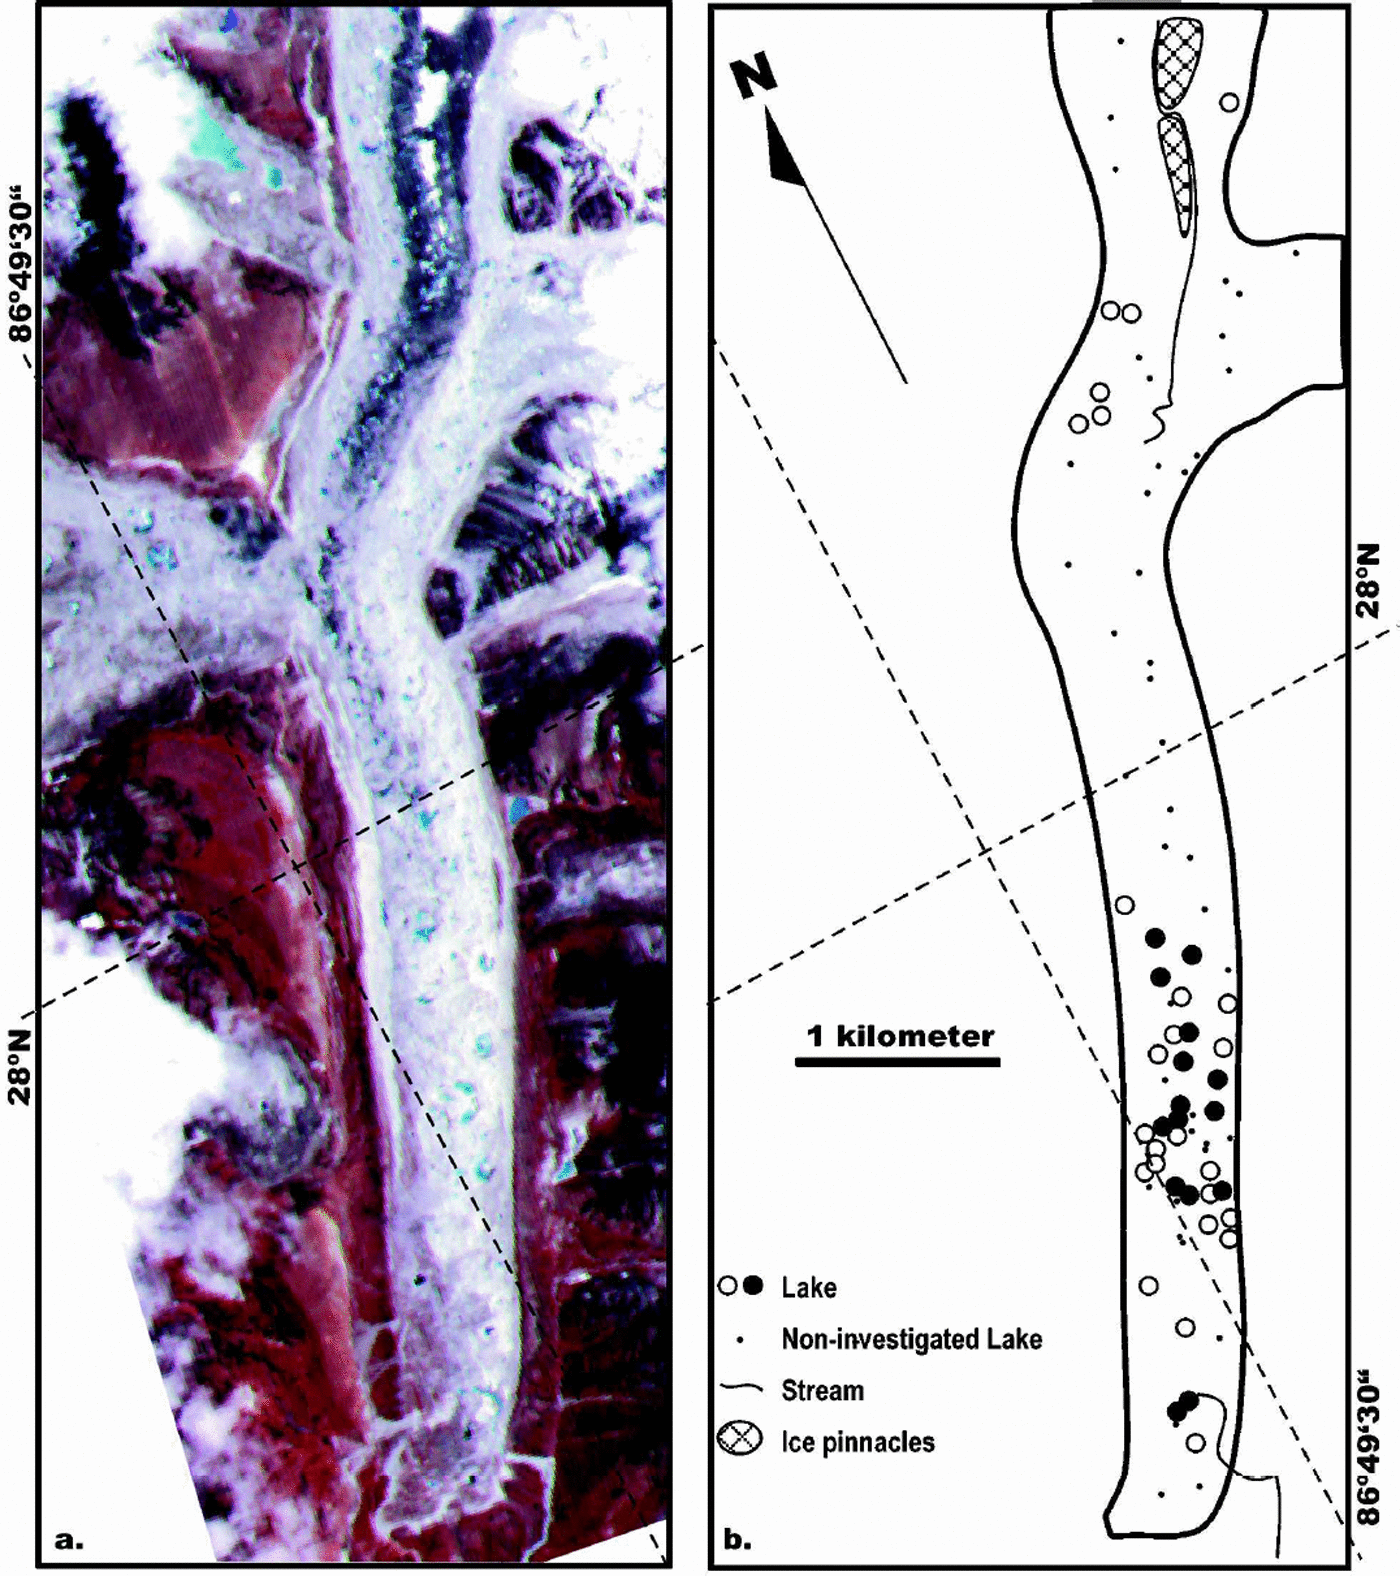
Khumbu Glacier. (a) False-color ASTER L1A image with bands 321 in RGB. (b) Map showing supraglacial lake distribution with suspended-particle concentrations of <30 mg L–1(о) and>30 mg L–1 (•) sampled in 1995 (after Reference Takeuchi and KohshimaTakeuchi and Kohshima, 2000).
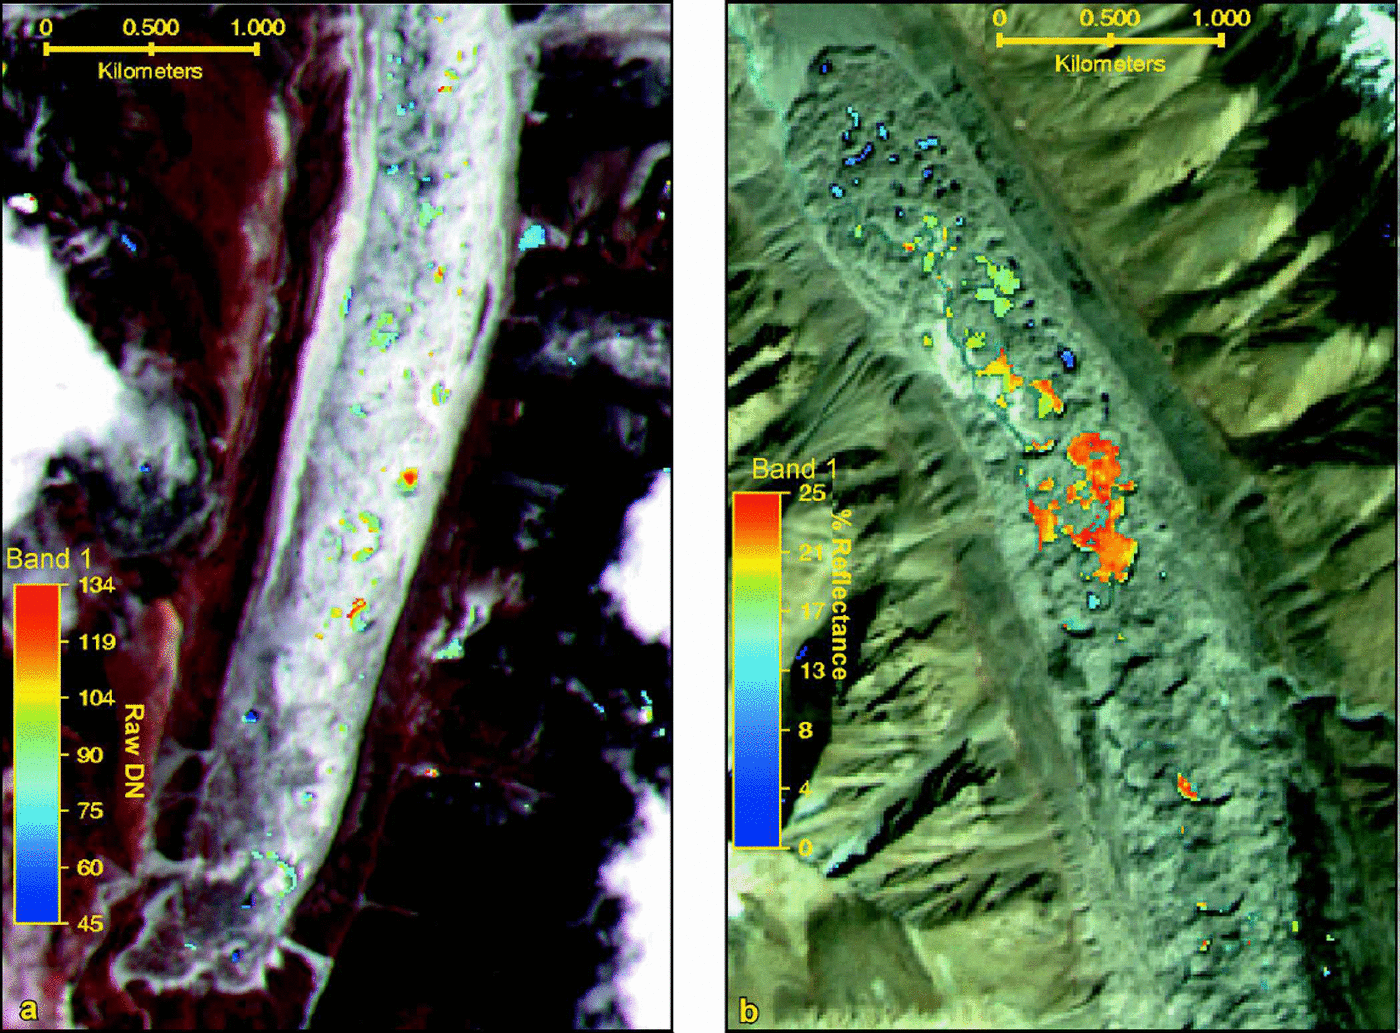
Khumbu Glacier, Nepal (a) and Rongbuk glacier, Tibet (b). The base images for both panels are false-color composites of ASTER bands 321 in RGB. Band 1 values for supraglacial ponds are represented by the pseudo-color scales shown on the left of each image.
Fourteen-band (VNIR,SWIR,TIR) ASTER L1B spectra of water and terrain features mapped in Figure 1. Spectra shown in red and green show broadband albedos calculated on the assumption that the surface is horizontal; each spectrum is an average of many pixels of each spectral/terrain type shown in Figure 1. 1. Silty water of ponds, lakes, and streams;2. unsilted water of ponds, lakes, and streams;3. exposed glacier ice and firn;4. alpine snowfields and snowy surface of glacier accumulation zones; 5. debris cover of glaciers. Shown in blue are laboratory spectra of: 6. pure distilled water;7. coarse-grained (1mm) snow; and 8. fine-grained (100 μm) snow (from Reference Salisbury, D’Aria and WaldSalisbury and others, 1994).

The first terrain classification is a two-fold separation into (a) undivided H2O surfaces (snow, ice and water), which all have a negative slope from band 1 to band 3, and (b) non-H2O surfaces (rock, soil and vegetation, all of which have positive slopes from band 1 to band 3). Specifically, a band 1/band 3 ratio value of 41.0 for the calibrated reflectance image identifies most of the H2O surfaces.
The second step of classification separates the classified H2O surfaces into solid or liquid pixels. Specifically, we use the band 3/band 4 ratio value 41.8 for the calibrated reflectance image to identify solid H2O, and less than this value for liquid H2O.
Our third classification step separates snow from ice using a threshold of the band 3/band 4 ratio. Ice pixels are constrained by band 3/band 4 ratio values of 1.8–7.0. Snow pixels are identified with a band 3/band 4 ratio value of 47.0.
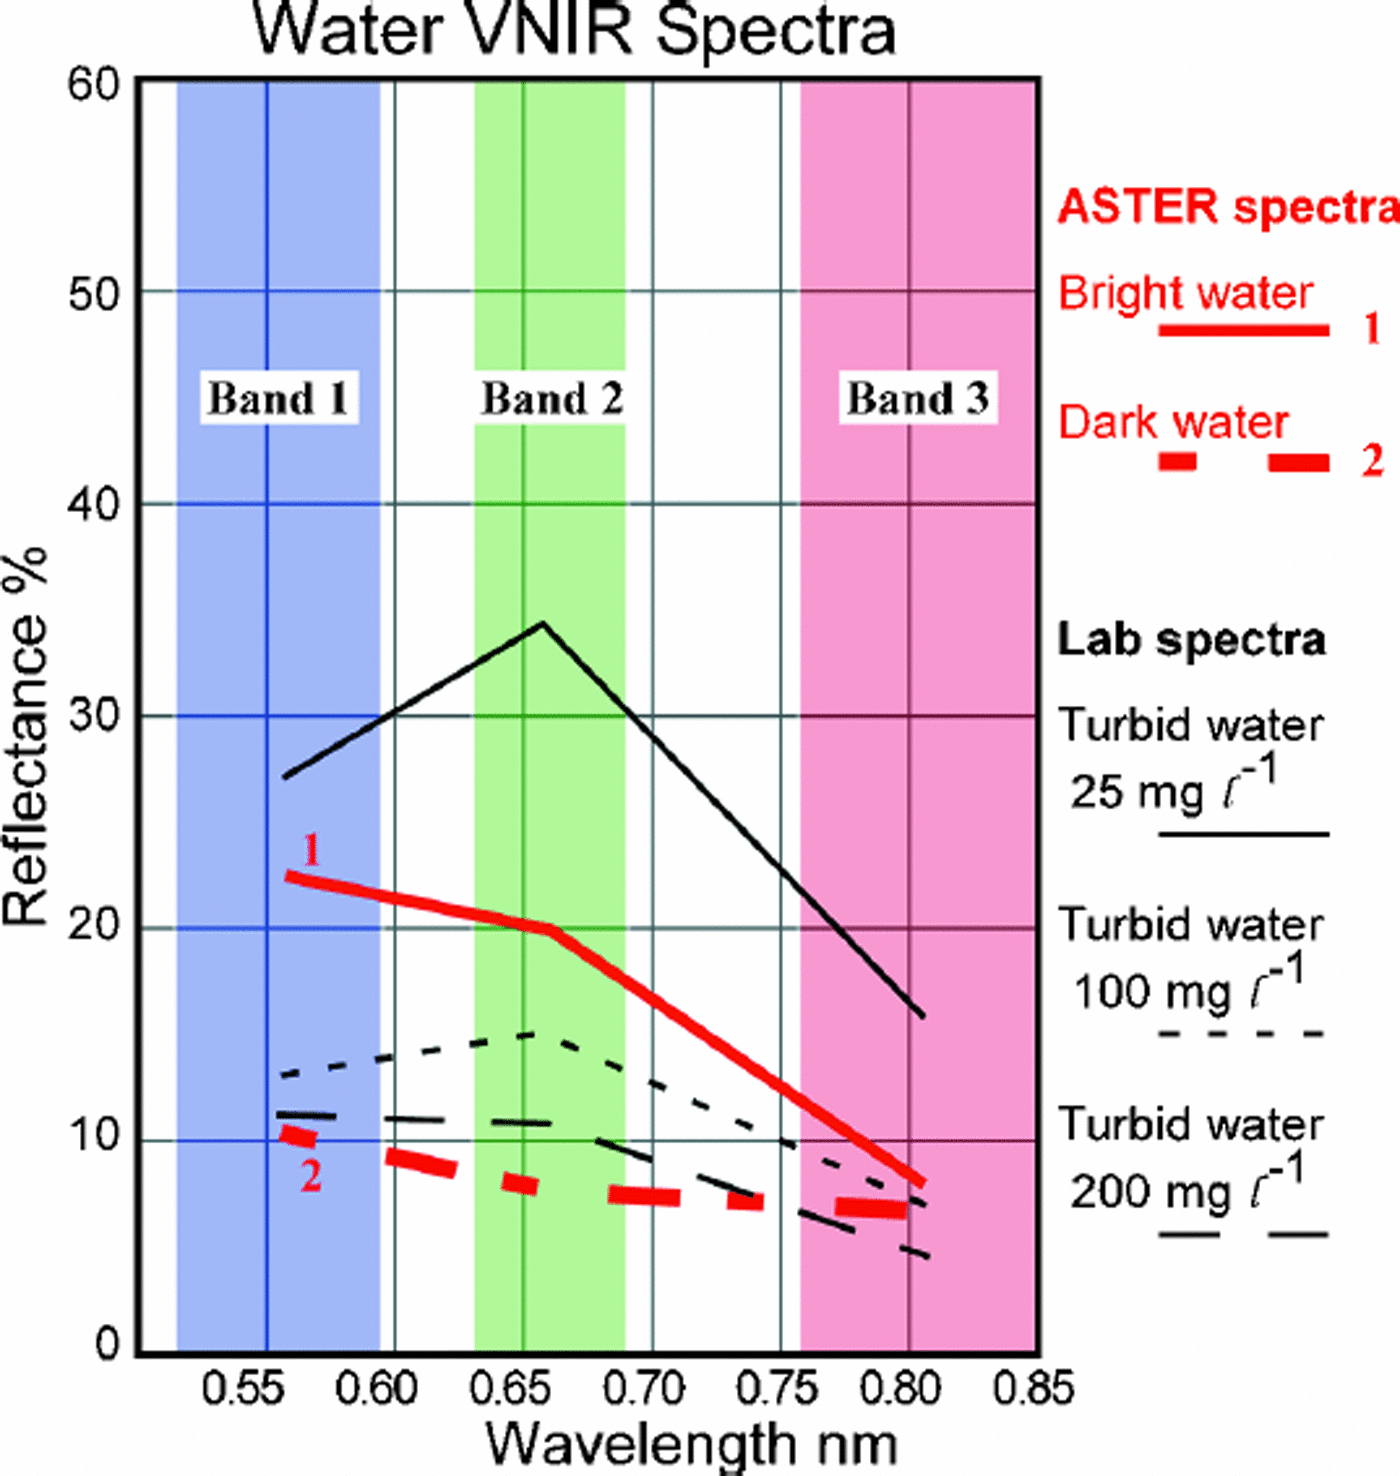
The water pixels then can be assigned a nearly continuous range of brightness values by linear scaling of band 1 reflectance. These results can be simplified into a two-fold classification of bright and dark water by arbitrarily setting a threshold. For Figure 1d we set this threshold by choosing a laboratory reflectance (from Fig. 5) of <14% that separates low turbidity (<30mg L–1 suspended solids, after Reference Takeuchi and KohshimaTakeuchi and Kohshima, 2000) from higher-turbidity lakes as described further in the discussion.
ASTER L1BVNIR image spectra 1and 2 from Figure 4 plotted with spectra of turbid water with 200, 100 and 25 mg L–1of suspended solids (after Reference ForsterForster and others, 1994).
In the case of the uncalibrated L1A image data, we used a similar classification scheme but based it on raw digital number (DN) instead of reflectance. A band 1/band 3 ratio value of 40.85 for the raw DN images captures the majority of the water and ice features.
Terrain brightness temperatures can be measured from the radiance in five ASTER TIR bands. At 273 K, the spectral emissivity of pure water (Reference Salisbury, D’Aria and WaldSalisbury and others, 1994) will cause ASTER brightness temperatures to be lower than the kinetic temperature by about 0.75 K in bands 10–12 and by about 0.55 K in bands 13 and 14. The intervening atmosphere, tending to be cold, will further contribute to ASTER brightness temperatures being below the physical temperature. However, we have found a systematic discrepancy of nearly 2 K between computed brightness temperatures from TIR bands 10–12 vs bands 13–14. These two groups of bands taken separately produce highly consistent results with a standard deviation of about 0.2 K, so until we understand and can correct the discrepancy between longer- and shorter-wavelength bands, we attribute it to a calibration error somewhere. For now, we opt to use information only from TIR bands 10–12.
Results
We initially focused our efforts on classifying ASTER L1B data (30 October 2000) over the Rongbuk glacier area, Tibet (Fig. 1), and ASTER L1A data (23 May 2000) over Khumbu Glacier, Nepal (Fig.2), and then made additional observations of Level 1B (28 September 2000) over Ngozumpa Glacier, Nepal. The L1B data of Rongbuk glacier, shown as bands 321 (RGB) false color, show a large area of debris-covered glaciers up to 15 km long. Each debris-covered glacier has many supraglacial lakes of various blue hues. Rongbuk glacier is about 14 km long with elevation ranging from 5200m at the terminus to 6800m at the source. The lower 8 km is covered with debris and at least 23 small dark-blue lakes and 27 bright-blue, mostly large lakes. Most of the lakes on Rongbuk Glacier are concentrated within 2 km of the terminus. These images show that the smallest lakes generally have low ASTER band 1 reflectance values of 4–15%, while the largest lakes have values of 15–25%. Figure 4 shows the 14-band spectra for each ROI on Rongbuk glacier. Using the ratios described above, we can map each lake as either dark or bright blue and also separate out snow and ice and non-H2O areas (Fig.1).
The ASTER L1A data of Khumbu Glacier are cloudy over much of the region. Fortunately the area over Khumbu Glacier is cloud-free in one L1A image available at this writing. The main Khumbu Glacier is about 17 km long with elevation ranging from 4900m at the terminus to 7600m at the source. The lower 9 km is covered with debris and at least 15 small dark-blue lakes and about 20 slightly larger lighter-colored lakes. Most of the lighter-colored lakes occur in the lower 4 km of the glacier. As with the calibrated ASTER data, we use the ratios described earlier to map each lake as either dark or bright colored (using a raw DN threshold of 90) and also separate out the snowand ice (Fig. 3a).
The multispectral terrain classification and mapping of water, snow, ice and rock/vegetation (Figs1–3) needs detailed field validation/verification, but it appears to be relatively successful and the results plausible. Some edge artifacts are apparent, as shown in the upper right of Figure 1, where bright water is mapped––erroneously we believe––along the contact between glacier ice and moraine-covered glacier. There also are problems with the apparent misclassification of snow as ice in areas of deep shadow near mountain peaks. With these exceptions, the classification appears to be reasonable and is probably accurate. The classification is tailored to separate liquid from solid forms of water and to further distinguish the hue of liquid water. Water hue (as appears in Fig. 1, 2a and 3) is interpreted in terms of turbidity; dark blue water is believed to be relatively clear, and bright blue water relatively turbid.
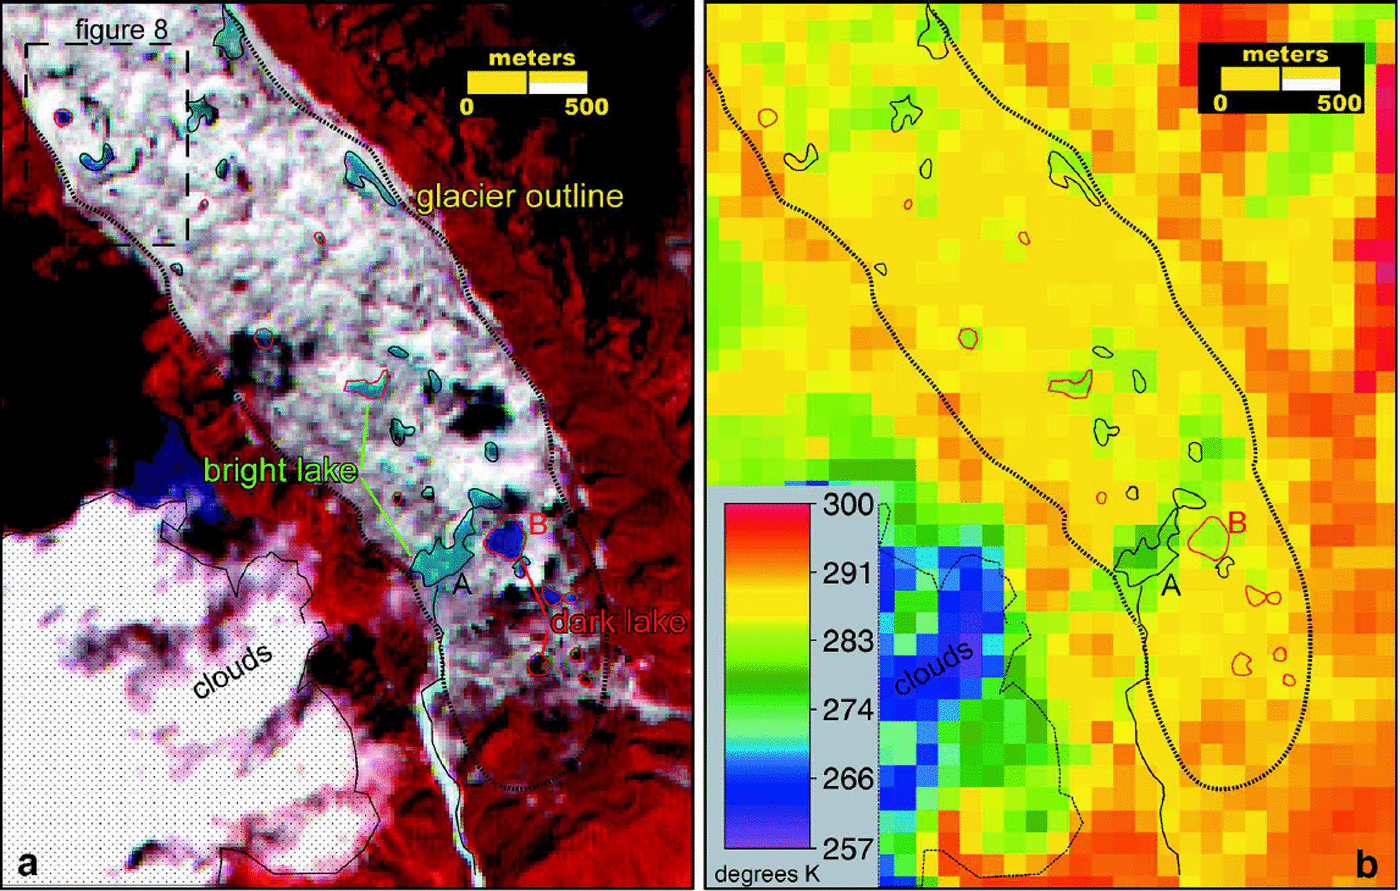
The brightness temperatures of supraglacial lakes on Rongbuk glacier, computed from 90m ASTER TIR radiance, range from about 272.2 to 276.7 K. Based on initial instrument calibration results (Reference Gillespie, Matsunaga, Rokugawa and HookGillespie and others, 1998) and our presentation of methods, we assume that there is a 0.75 K systematic underestimation relative to actual kinetic temperatures, so that these lake temperatures actually are thought to range from about 273.2 to 277.6 K. On Ngozumpa Glacier, brightness temperatures were obtained for the two largest lakes near the terminus, lake A (276.6K) and lake B (282.2K); the surface debris on this glacier exceeded 290 K in places (Fig.7, shown later); again, these values would have to be adjusted upward by around 0.75 K to obtain estimated kinetic temperatures.
Discussion
Water color and turbidity
Reference Takeuchi and KohshimaTakeuchi and Kohshima (2000) believed that high levels of turbidity in supraglacial ponds are a sign of high rates of meltwater input from streams or erosion of ice cliffs, and thus are an indirect measure relating to the activity and hydraulic integration of the lake with respect to other lakes and streams in the glacier. Since lakes may absorb and transmit to underlying ice up to seven times as much energy as adjacent debris-covered non-lake areas (Reference Sakai, Takeuchi, Fujita and NakawoSakai and others, 2000), turbidity is also important because it affects the energy balance of the lake and, hence, of lake-riddled parts of glaciers.
Turbidity caused by most natural inorganic suspended matter is known to cause (in comparison to pure water) an increase in reflectivity in the visible region, a longward shift in peak reflectivity, and a more precipitous longward decline in reflectivity in the near-infrared region (Reference Ritchie, Shiebe and HenryRitchie and others, 1976; Reference Topliss, Amos and HillTopliss and others, 1990; Reference ForsterForster and others, 1994). The reflected spectrum measured above liquid water varies with the substrate’s spectrum if the water is shallow (Reference Bartolucci, Robinson and SilvaBartolucci and others, 1977), and further spectroscopic variation is expected to be caused by suspended matter of differing mean grain-size and grain-size-frequency distribution. Organic material and especially chlorophyll either in suspended particles or on the bottom (if the bottom is sensed) also exerts a strong control on the reflectance spectrum of natural surface water. Variations in the compositions and particle-size distribution of suspended matter probably account for the wide variation in published spectra of natural surface water.
The absorption and scattering pathlength of visible and infrared radiation inmost glacial meltwater streams and lakes is generally less than the water depth, and the suspended material is mostly inorganic. Thus, with few exceptions, water reflectance in the VNIR spectral range can probably be interpreted primarily in terms of turbidity due to inorganic suspensions without any bottom effects. In SWIR wavelengths, chlorophyll may be important in some meltwaters. Ignoring expected variations caused by grain-size effects, the average spectra of dark and bright supraglacial waters (seen in VNIR bands 1–3) on Rongbuk glacier can be interpreted, using the empirical results of Reference ForsterForster and others, (1994) as a guide, as containing 30 and 150 ppm (by mass), respectively, of suspended particles (Fig. 5).
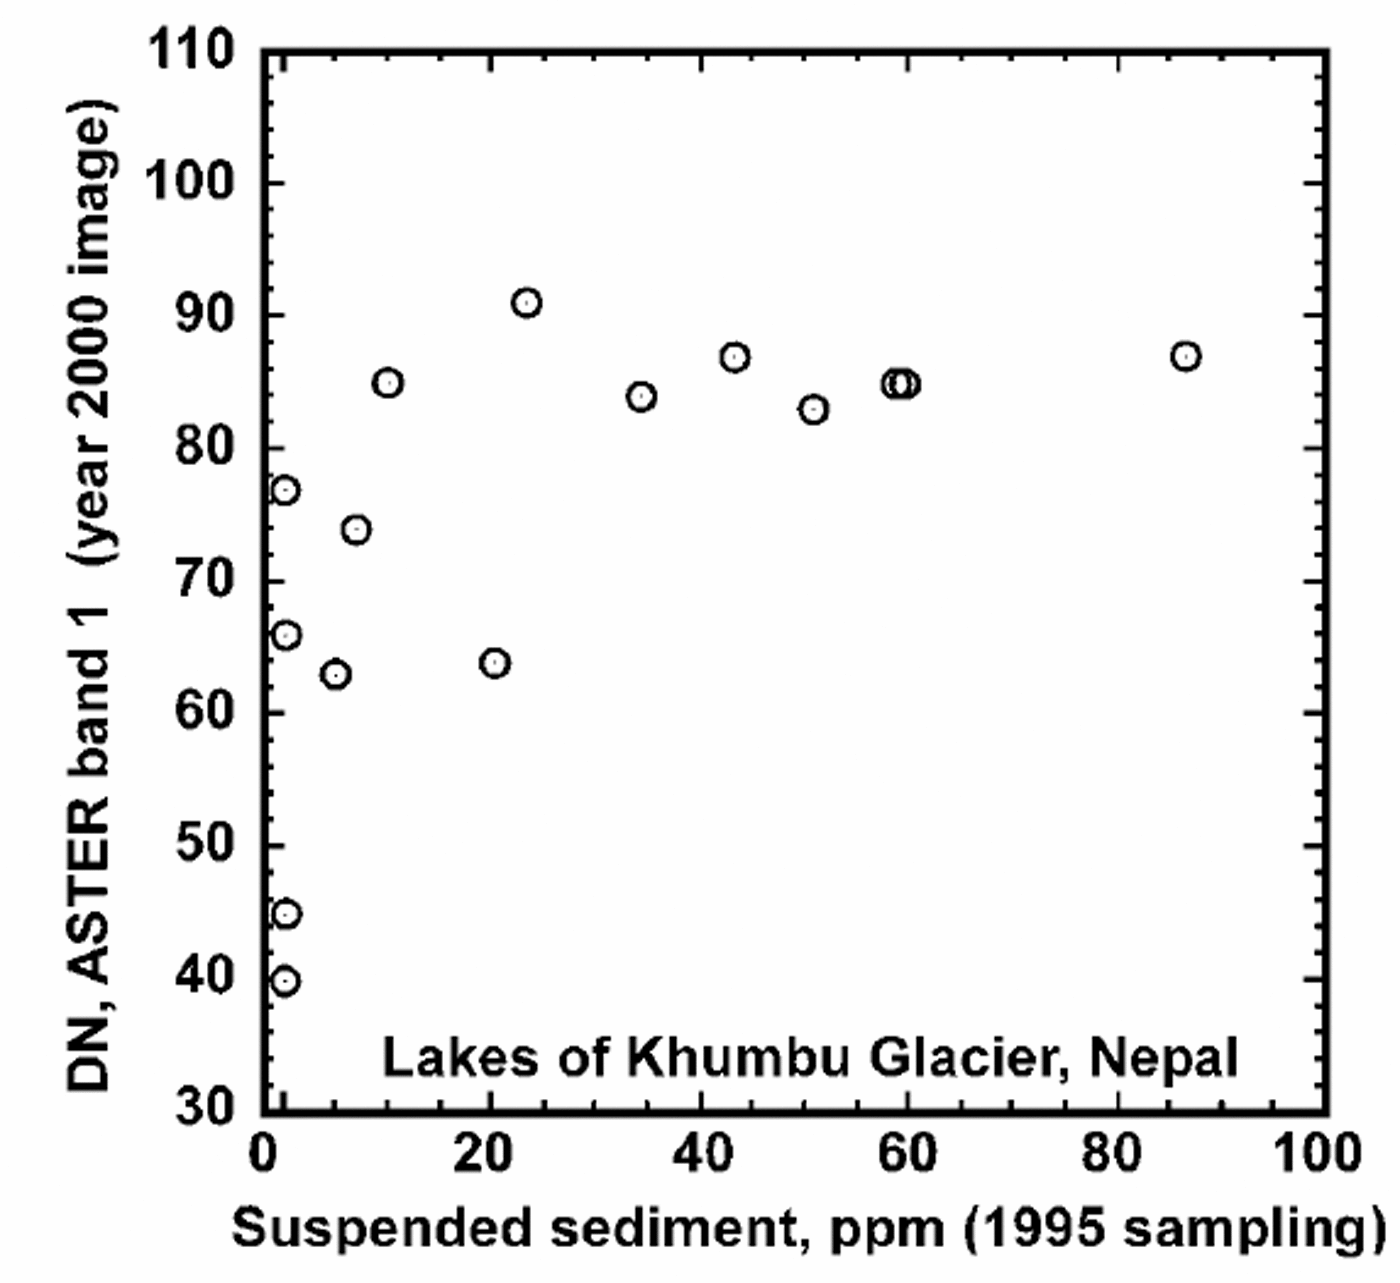
For the interpretation of remote-sensed spectra we have used surface observations on the occurrence of and impurities in supraglacial ponds on Khumbu Glacier (Reference Iwata, Aoki, Kadota, Seko and YamaguchiIwata and others, 2000; Take uchi and Kohshima, 2000). Reference Takeuchi and KohshimaTakeuchi and Kohshima (2000) measured the suspended matter in 40 supraglacial ponds on Khumbu Glacier in late October/early November 1995 and found a range of 0–86.5 ppm. Whilemany of the lakes had disappeared or were not fully resolved in the ASTER image, we are able to compare their measured concentrations of suspended matter with spectra of the same lakes as measured in the 23 May 2000 ASTER image for those lakes that still existed and were well resolved. All of the lakes that had >30mg L–1 suspended particulates in 1995 were mapped by us as bright in the 2000 ASTER band 1 image, while 56% of lakes with <30mg L–1 appear dark. Reference Takeuchi and KohshimaTakeuchi and Kohshima (2000) apparently used an arbitrary division of 30 mg L–1 to separate low- and high-turbidity lakes. The correlation is good except for four lakes that had clear water in 1995 but were bright (indicating high suspended sediment) in 2000. This discrepancy implies either that turbidity increased in the four lakes or that there is a bias in our image measurement.
Reference Takeuchi and KohshimaTakeuchi and Kohshima’s (2000) observations of particulate concentrations are compared against ASTER band 1 DN image intensity in Figure 6. Lakes reported by them to have had >30ppm of suspended matter show a constant high reflectance in band 1, but below 30 ppm there is a widely varying reflectance, with a rough correlation between band intensity and sediment concentration. Overall, these results suggest that sediment concentrations remained similar 5 years after sampling. The scatter in the correlation (Fig. 6) could be caused by transient or long-term changes in suspended-sediment abundance, bottom effects on image intensity, or to error in measurement of the image related to resolution effects or our inability to know the exact spot in the lake to measure (as there is some spatial variability).
Band 1 DN measured in image acquired in 2000 vs suspended-sediment concentration measured in 1995. Sediment concentration is from Reference Takeuchi and KohshimaTakeuchi and Kohshima (2000).
Further improvements to the classification may involve (a) use of a DEM and slope map (computable from stereo VNIR imaging), which would reduce the problem of misclassified pixels in shadow and steeply sloping areas, (b) simultaneous use of all available SWIR and VNIR bands to determine the type of rock exposed in moraines and surrounding non-glacier areas, (c) mapping fractional debris cover on ice, (d) mapping ice/snow grain-size, and (e) determination of the composition (using spectral classifiers) of suspended sediment in water.
According to our classification, most supraglacial lakes and moraine-dammed lakes are highly turbid. Where proglacial streams are resolved, our classification shows them as being generally turbid; proglacial lakes not in contact with glaciers have relatively low turbidity. These classifications are qualitatively consistent with our expectations. Most of the turbid supraglacial lakes on Rongbuk glacier (Fig. 1 and 3a) are interconnected by a turbid supraglacial stream, which eventually exits the snout of the glacier. The less turbid dark supraglacial ponds are small and appear to be isolated to the limit of resolution of the imagery. We can say nothing directly about the englacial or unresolved supraglacial drainage network, but the low turbidity of the dark ponds suggests that they have relatively little input of water or fine sediment from these possible sources.
Bright and dark lakes are clustered on the surfaces of Khumbu and Rongbuk glaciers. This clustering would appear to be related to parts of the glaciers that are hydrologically integrated (areas of bright blue turbid lakes) vs isolated/compartmented (areas of dark lakes). Reference Nakawo, Fujita, Ageta, Shankar, Pokhrel and TandongNakawo and others, (1997), who considered possible englacial as well as supragla-cial drainage, also believed that some lakes are hydraulically well integrated, whereas others are isolated.
Comparison of our mapping of bright and dark lakes with the sampling of relatively turbid and clear lakes done by Reference Takeuchi and KohshimaTakeuchi and Kohshima (2000) provides a hint that the longevity of these lakes differs greatly. Eighty per cent of highly turbid lakes measured by them in 1995 still existed in 2000, whereas only 33% of the relatively clear lakes still existed at the limit of ASTER VNIR resolution (15m). However, there is no question that dark lakes are, on average, much smaller than bright ones, and so image resolution could be a significant factor explaining this difference.
Lake temperature
The coldest pixel found in lake A (abright lake) on Ngozumpa Glacier was 3.5 K warmer than the ice point, and the coldest point in lake B (a dark lake) was 9 K warmer (Fig. 7). Although some thermal-emission contamination from debris may have occurred, it seems likely that both lakes exhibit substantial superheat. The large bright lakes on Rongbuk glacier have measured temperatures close to 273.2 K, and so would appear to lack much superheat. Superheat of 0–8K in supraglacial lakes is commonly measured in the field (Reference Chikita, Jha and YamadaChikita and others, 1999; Reference Raymond and NolanRaymond and Nolan, 2000; Reference Sakai, Takeuchi, Fujita and NakawoSakai and others, 2000; Reference Takeuchi and KohshimaTakeuchi and Kohshima, 2000), so the temperatures found here are within the usual range. These results demonstrate the ability of ASTERTIR to resolve small temperature variations and to adequately sense the temperature of lakes larger than two TIR pixels, although caution is needed for lakes that size and smaller, and wherever an unresolved patchwork of thermally distinct emitters is thought likely.
(a) ASTERL1B15 m VNIR bands 321 (RGB) of the terminus of Ngozumpa Glacier, showing supraglacial lake distribution and outlines (acquired on 28 September 2000). (b) ASTER L1B 90 m TIR band 10 (8 μm) of the same area showing the lower brightness temperatures (in Kelvin) of the brightlakes compared to the dark lakes.
The standard deviation of brightness-temperature measurements made from bands 10–12 is about 0.2 K, a reasonable estimate of instrument precision. However, few lakes are actually spatially resolved, and, for lakes near the resolution limit, accuracy is not nearly so good. The probability of a randomly placed circular feature completely containing a square pixel of size L rises from 0 at diameter  (127m for TIR) to unity at
 255m for TIR). We consider 2L to be the minimum lake size allowing useful measurements to be made, with a minimum of for high-accuracy analysis. For lakes exceeding the latter size, and lacking any unresolved islands of debris, temperature measurement error likely corresponds entirely to instrument/calibration bias and precision limits. Only bright lakes exceeded the criterion (ensuring complete resolution), and only the largest dark lake on Ngozumpa Glacier has a diameter close to the 2L criterion (incurring a risk of thermal-emission contamination from surrounding debris-covered glacier areas). Other dark lakes are the scale of a single pixel, at which reliable temperature measurements cannot be made. Since the temperature contrast between lakes and debris-covered glacier surfaces is on the order of 10 K, emission contamination is an issue for any lakes smaller than 2L, even for the largest dark lake on Ngozumpa (*1.7 pixels).
Reference Raymond and NolanRaymond and Nolan (2000) modeled the thermodynamics of supraglacial lake drainage and channel incision and found that warm lakes are, all other things being equal, much less stable than ice-cold lakes. A supraglacial lake on an Alaskan glacier had just 0.7 K superheat, and this excess was calculated to make a crucial difference that destabilized that particular lake and allowed it to undergo runaway drainage (Reference Raymond and NolanRaymond and Nolan, 2000). The superheat of the large dark lake B on Ngozumpa Glacier is sufficient to cause runaway drainage and suggests that this lake is unstable and unlikely to grow much larger. Bright turbid lakes tend to be large and seem to exhibit stable supraglacial drainage; lack of superheat in some of these lakes is a factor tending to aid their stability and growth. This is qualitatively as expected from the theoretical analysis of Reference Raymond and NolanRaymond and Nolan (2000).
From a hazards perspective superheat might often be a blessing in disguise. It may make supraglacial lakes so unstable that they cannot persist for long or grow to large sizes, and so these lakes might not pose a significant hazard. Lakes lacking superheat lack the capacity to thermally erode high-capacity conduits for outflow of water, and so they can grow to large sizes. These lakes can eventually drain catastrophically if they intersect cavernous thermokarstic structures or if they mechanically erode through ice-cored terminal moraines. Especially alarming would be a large lake that, for some reason, developed a superheated condition; lakes A and B on Ngozumpa Glacier merit some attention in this regard, as they might have been superheated significantly at the time of acquisition of the 28 September 2000 L1B image (Fig.7).
Monitoring lake boundaries over time
Reference Benn, Wiseman and WarrenBenn and others (2000) reported the rapid development of a supraglacial lake on Ngozumpa Glacier between October 1998 and October 1999. Three isolated ponds observed in 1998 had deepened and merged over that 1year period. The authors noted that water deepening and lake expansion by calving retreat form a positive feedback, and they predicted that lake growth would consequently continue until the lake intersected an englacial conduit, at which point the lake would drain partly or fully. In fact, the L1B ASTER image of this lake taken almost a year later shows that the lake has indeed partly drained and broken up again into three separate dark-blue or intermediate-blue ponds having a geometry almost identical to that in October 1998 (Fig. 8). Reference Benn, Wiseman and WarrenBenn and others (2000) also stated that this lake had appeared, in undated air photos predating 1998, as a large, single lake. Their observations taken with the new ASTER-based findings suggest that this particular basin fills and drains episodically. Ice cliffs bordering the October 1999 lake had moved little by September 2000. The capability of ASTER to contribute to the monitoring of lakes this size and larger is well demonstrated by these results.
Supraglacial lake (lake 7092.1 from Reference Benn, Wiseman and WarrenBenn and others, 2000) on Ngozumpa Glacier, October 1998–September 2000. The 28 September 2000 ASTER L1B image (bands 321RGB smoothed) shows that the lake receded back to the 1998 level shown by lake outlines from Reference Benn, Wiseman and WarrenBenn and others, (2000).

The facts that some lakes on Khumbu Glacier mapped in 1995 (Reference Takeuchi and KohshimaTakeuchi and Kohshima, 2000) could not be seen in the 2000 satellite image, and that some observed in 2000 were not mapped in 1995 suggests that episodic filling and drainage is a common property of lakes on glaciers in this region. This supports the speculations of many observers, including Reference Takeuchi and KohshimaTakeuchi and Kohshima (2000). The small, dark lakes seem to be especially variable, whereas bright lakes tend to be more stable, larger and better hydraulically integrated with other lakes and supraglacial streams (hence are colder and more turbid than dark lakes).
Conclusions
ASTER offers new capabilities to map and monitor supraglacial lakes in terms of changes in size and inorganic turbidity at spatial resolutions of >30 m (two VNIR pixels) and temperature at resolutions of 4180 m (two TIR pixels). Still lacking is a suite of field observations tied in time and space to ASTER observations to help validate/verify and fine-tune the algorithms used for terrain classification and other analysis. Thus, we regard our new results as a demonstration of capability rather than as definitive new results. Preliminary results show an overall similarity of supraglacial lakes on three glaciers. Lakes have widely varying turbidity as indicated by color, with the largest tending to be bright blue (highly turbid), cold (near 273 K) and hydraulically connected with other lakes and supraglacial streams; small lakes are mostly dark blue (relatively clear water) and appear hydraulically isolated; the largest dark lake on Ngozumpa Glacier exhibits significant superheat, perhaps as much as 9 K (though some of that may be due to thermalemission contamination from adjoining debris). One cluster of three dark lakes on Ngozumpa Glacier in 2000 represents a draindown from a higher standing merged lake 1year earlier to a lake geometry almost identical to what it had been 2 years earlier in 1998. Comparison of the 2000 satellite imagery with a 1995 field survey of Khumbu Glacier shows that many small lakes, especially the dark ones, have time-scales of a few years. For lakes that persisted from 1995 to 2000, we found that there was no substantial, systematic translational movement, suggesting that the lake-ridden region of Khumbu Glacier now is largely stagnant or just locally in slow motion. It is not understood precisely what causes some lakes to undergo runaway growth to dangerous sizes, whereas other lakes undergo apparently stable or metastable oscillations. Satellite monitoring may help us learn about key aspects of the behavior and threat potential of supraglacial lakes.



