

The constitution of economics as a discipline, both in terms of content and institutional structure, has been much debated over the last few decades. Many authors have argued that economics is more concentrated in terms of volume and recognition of research than most other disciplines (see e.g. Varga Reference Varga2011 and Fourcade et al. Reference Fourcade, Ollion and Algan2015). Investigating concentration is crucial as the development of elites within economics, be it on the level of articles, journals, regions, institutions, authors, or paradigms, may be unhealthy for creativity and innovation. This concern was prominently voiced by Akerlof, Deaton, Fudenberg, Hansen, and Heckman at the Reference Heckman2017 ASSA Annual Meeting (AEA 2017). Concentration, which is also reflected in academic rankings, may contribute to an incentive structure that discourages economists from publishing on critical issues such as climate change that lie outside the core of the economics profession (Hudson Reference Hudson2013). It may thus lead to an intellectual “lock-in” that inhibits change and acts as a barrier against new ideas and approaches (Hodgson and Rothman Reference Hodgson and Rothman1999).
One way of capturing concentration in science is scientometrics, i.e. the statistical analysis of bibliographic data about scientific research. The most common function of scientometrics today is the calculation of citation metrics such as impact factors for journals, departments, or authors. However, scientometrics also has a “cognitive” function (Rip and Courtial Reference Rip and Courtial1984), as it allows revealing latent structures in scientific discourses.
In this paper, we apply scientometric methods to a large-scale data set of around 3.5 million citations, which include around 421 thousand articles published between 1956 and 2016 in 433 economics journals listed in Thomson Reuters’ Web of Science. We investigate six dimensions along which concentration occurs: individual articles, journals, regions, institutions, authors, and paradigms. To our knowledge, this big-data analysis is the first to capture six dimensions of concentration in economics. The long time period covered by the data set also makes it possible to provide an overview of the dynamics of concentration in the discipline over the last sixty years.
1. Concentration in economics
Several studies have addressed at least one dimension of concentration in economics. For instance, on the level of authors, Tollison and Goff (Reference Tollison and Goff1986) find that, within their discipline, influential economists are cited substantially more often than influential physicists are cited within physics. Tol (Reference Tol2009, Reference Tol2013) further finds a pronounced “Matthew effect,” i.e. the positive effect that prestige has on academic recognition of research (Merton Reference Merton1968), on the level of authors. The results of Birkmaier and Wohlrabe (Reference Birkmaier and Wohlrabe2014) are more nuanced with an effect present for fewer authors. The results also indicate that the Matthew effect may be a temporary phenomenon present only until a certain threshold of citations is reached.
On the level of articles, Laband and Tollison (Reference Laband and Tollison2003) report that a quarter of all articles in 1974 and 1996 were “dry holes” that received 0 citations. Laband (Reference Laband2013) adds to this picture and shows that for a sample of 248 economics journals published between 2001–2005, the top five percent of articles received 55 percent of all citations. In contrast, the lower 55 percent of articles only accounted for 10 percent of all citations, indicating an uneven distribution of citations on the article level.
Similarly, he finds that the top 10 percent of journals account for half of all citations and 87 percent of the highest impact articles. Concentration of high-impact research in a few top journals has also been addressed by Card and DellaVigna (Reference Card and DellaVigna2013) with respect to the special status of the “Top Five” journals in economics: the American Economic Review (AER), the Quarterly Journal of Economics (QJE), the Journal of Political Economy (JPE), Econometrica (Ectra), and the Review of Economic Studies (REStud). In a panel address, Heckman (Reference Heckman2017) showed RePEc data to illustrate the dominant role of these journals and argued that the disciplines’ excessive deference to them may inhibit innovation.
In addition, there is a substantial geographical concentration in economics, with the United States holding an especially dominant position in the discipline (Coupé Reference Coupé2003; Elliott et al. Reference Elliott, Greenaway and Sapsford1998; Sutter and Kocher Reference Sutter and Kocher2001). For instance, Hodgson and Rothman (Reference Hodgson and Rothman1999) report that 66 percent of authors and 71 percent of journal editors were located in U.S. institutions. Kalaitzidakis et al. (Reference Kalaitzidakis, Mamuneas and Stengos1999) find that North American (USA and Canada) authors made up between 69 and 90 percent of all authors in ten core journals between 1970 and 1994.
Even within the United States, only a few high profile economics departments play a decisive role. According to Fourcade et al. (Reference Fourcade, Ollion and Algan2015), institutional concentration within the economics discipline’s most-cited journals is more pronounced than in other disciplines. This suggests that economics is oriented more inward and towards the top of its internal hierarchy. Congruently, Wu (Reference Wu2007) finds that five economics departments accounted for 47, 29, and 22 percent of published pages in the QJE, JPE, and AER between 2000 and 2003, respectively. Similarly, Kocher and Sutter (Reference Kocher and Sutter2001) show that authors affiliated with ten U.S. universities accounted for a quarter of articles published in 15 top-journals between 1977 to 1997. This effect was found to be even stronger when considering PhD affiliations rather than current affiliations. Also previous studies reported that graduates from selected top graduate programs accounted for the majority of published pages (Hogan Reference Hogan1986; Hirsch et al. Reference Hirsch, Austin, Brooks and Moore1984) and the highest performing authors (Cox and Chung Reference Cox and Chung1991) in the most prestigious economics journals.
Hodgson and Rothman (Reference Hodgson and Rothman1999) revealed that this “institutional oligopoly” also extends to the level of journal editors for the year 1995. Twelve institutions accounted for 39 percent of journal editors in the top 30 journals. The finding that personal ties between author and editor increase the chance of publication (Laband and Piette Reference Laband and Piette1994; Medoff Reference Medoff2003) offers one explanation for the strong institutional concentration among authors. Furthermore, Medoff (Reference Medoff2006) finds evidence for an institutional Matthew effect in economics, in particular for authors affiliated with Harvard University and the University of Chicago. Controlling for author and journal quality as well as article-specific characteristics, articles by economists from these elite universities were cited disproportionately more often and sooner after publication.
Several studies also investigate the evolution of the disciplines’ research topics, methods, and paradigms. For instance, Angrist et al. (Reference Angrist, Azoulay, Ellison, Hill and Feng Lu2017) show that there has been an empirical shift in economic research within all sub-fields of economics since 1980. With respect to the paradigmatic orientation of economics it has been suggested that the discipline has become increasingly narrow (Lee Reference Lee2004; Colander et al. Reference Colander, Holt and Rosser2004) and follows a “mainstream core-heterodox periphery” structure (Davis Reference Davis2008; Dobusch and Kapeller Reference Dobusch and Kapeller2012; Colander et al. Reference Colander, Holt and Rosser2010). Glötzl and Aigner (Reference Glötzl and Aigner2018) find evidence for such a pattern on the department level. Moreover, Bornmann and Wohlrabe (Reference Bornmann and Wohlrabe2017, 28) argue that papers published in the JEL field “History of Economic Thought, Methodology, and Heterodox Approaches” are systematically disadvantaged in research evaluations due the lower mean citation rates in the subfield. Concurrently to the breakdown of the Fordist postwar order in the 1970s, the importance of heterodox schools of thought declined (Stockhammer and Ramskogler Reference Stockhammer, Ramskogler, Frederic and Lavoie2012). Since the beginning crisis, a resurgence of heterodox and especially Keynesian economics has been evoked (Anon. 2009, 2013). However, Aigner et al. (Reference Aigner, Aisleitner, Glötzl and Kapeller2018) suggest that while the financial crisis caused a temporary increase of interest in classic contributions dealing with financial and economic instability, this was less pronounced in the “Top Five” journals and did not have much impact on the paradigmatic development of contemporary economics.
In the following sections, we scientometrically analyze a large-scale data set in order to investigate all of these six dimensions of concentration in economics and their dynamics over the last sixty years.
Data and methods
Our data set comprises 3,480,031 citations of 420,850 research items published between 1956 and 2016, retrieved from Thomson Reuters’ Web of Science (WoS) published in 433 economics journals.Footnote 1 The selection of journals in our sample was based on the WoS subject category economics. To arrive at our final data set we first manually corrected the journal names in the data for different spellings, and second limited the selection of journals in order to further increase data quality.Footnote 2 Moreover, not all types of research items were taken into account for the analysis. In our data set we include all articles, reviews, and notes, as well as a subset of other research items that pass a threshold of ten citations.Footnote 3
In the following, we refer to all research items in our data set as articles. Our analysis may be understood as capturing economics’ internal structure, as we only include articles published in economics journals and restrict our analysis to citation relationships between them. Links to journals from other disciplines are not analyzed.
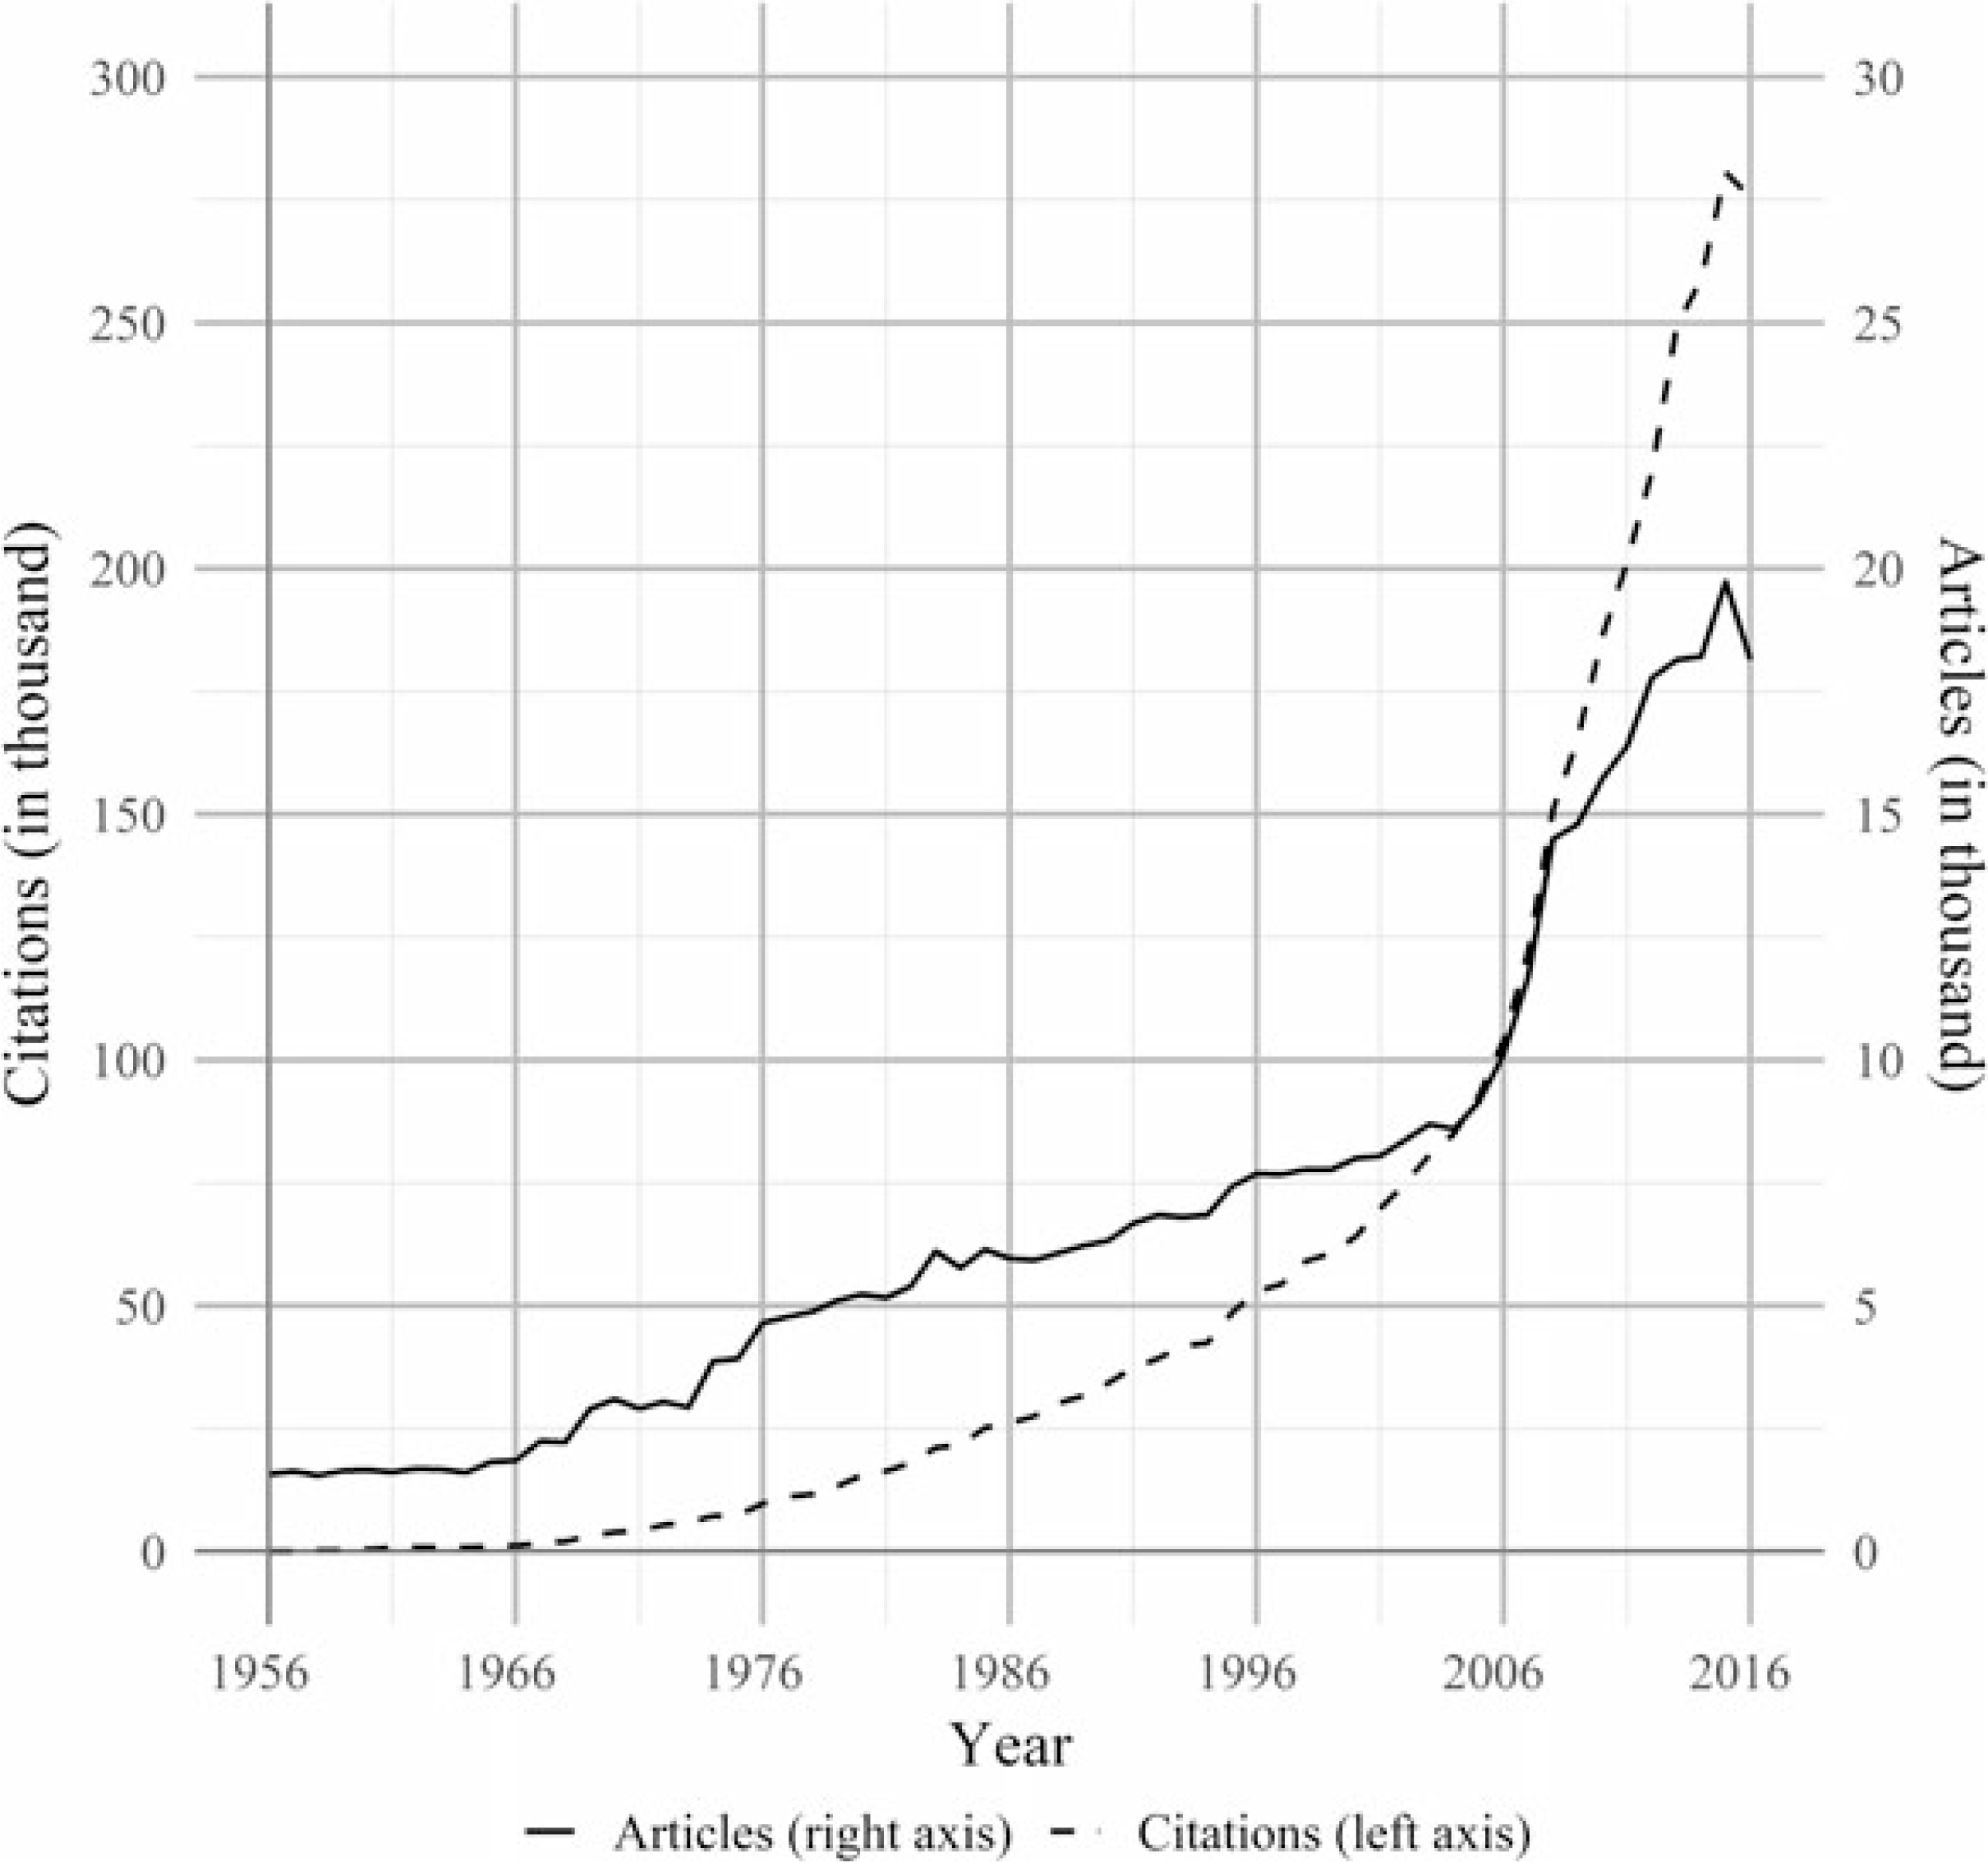
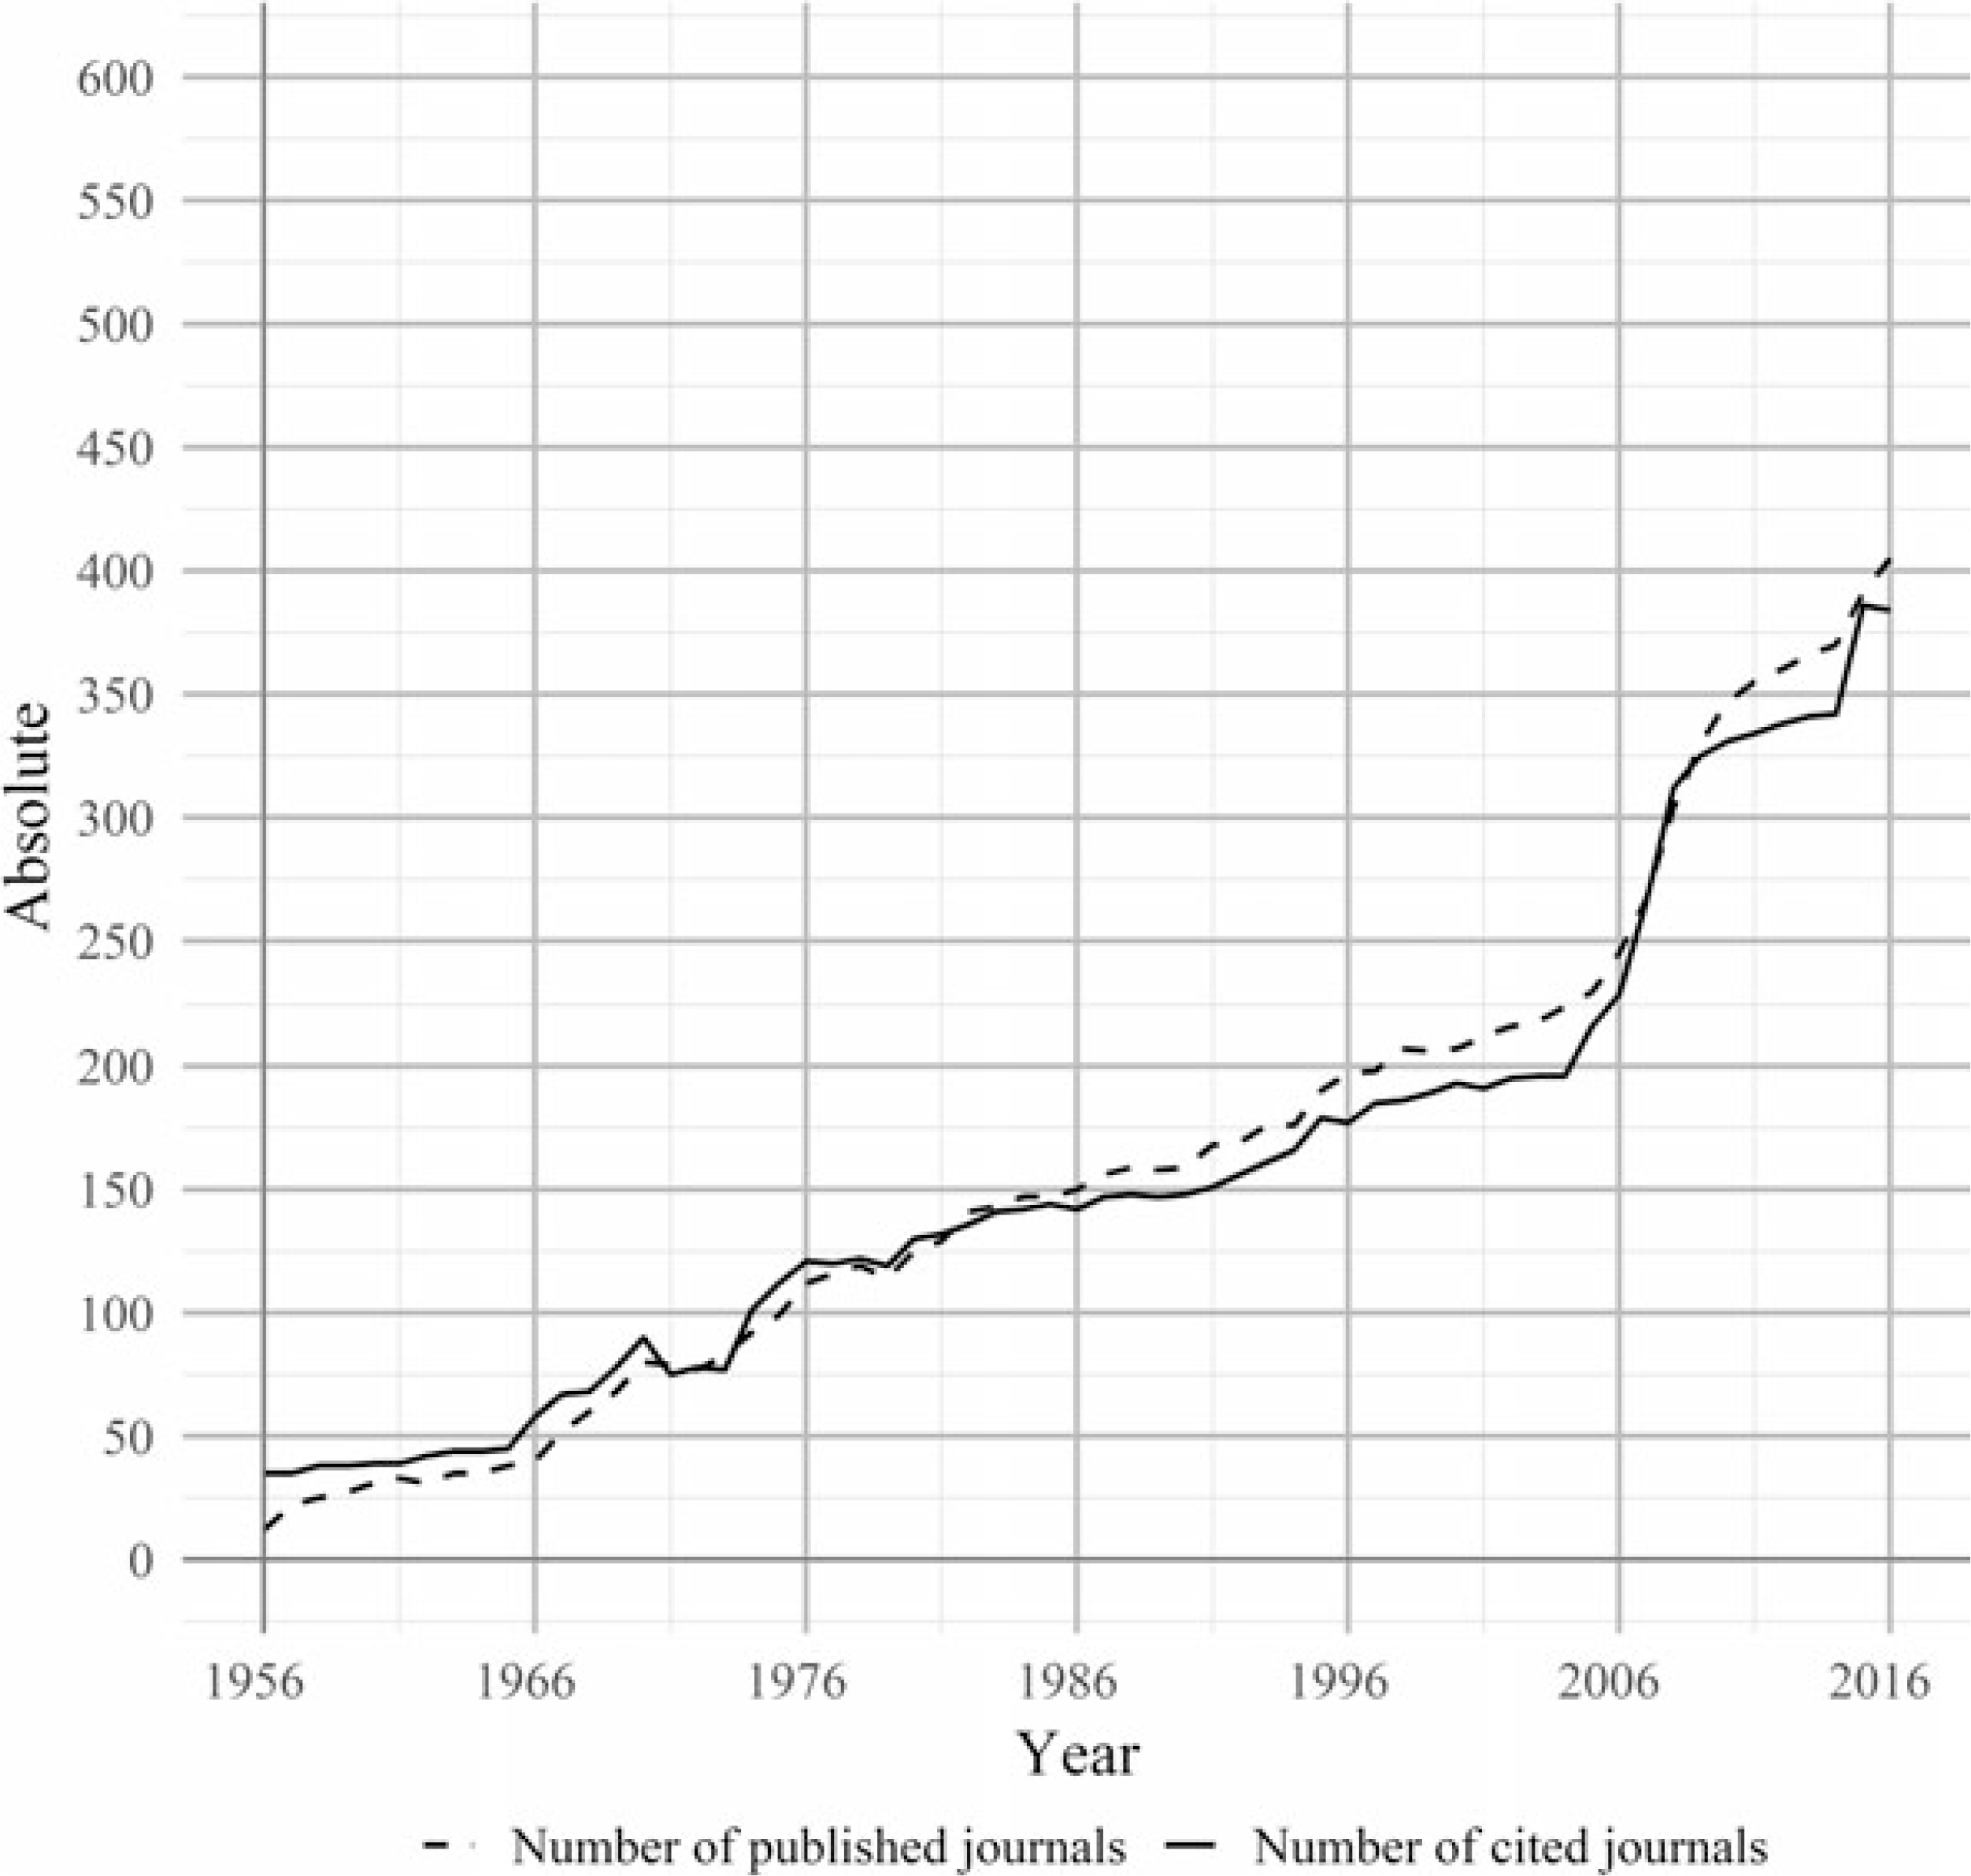
The size of the data set increases significantly with time as a result of the growing literature in economics as well as due to higher coverage in the WoS. Figure 1 shows the increases in the number of articles (solid line) and citations (dotted line); figure 2 shows the development of the number of journals.Footnote 4 The growth of citations each year has been exponential. The number of articles published each year increased fairly steadily until 2006. Between 2006 and 2007 both the number of articles and the number of journals in the data set soared. Thereafter, it continued to increase at a faster pace than before.
Number of articles and citations each year, 1956–2016.

Number of published and cited journals each year, 1956–2016.

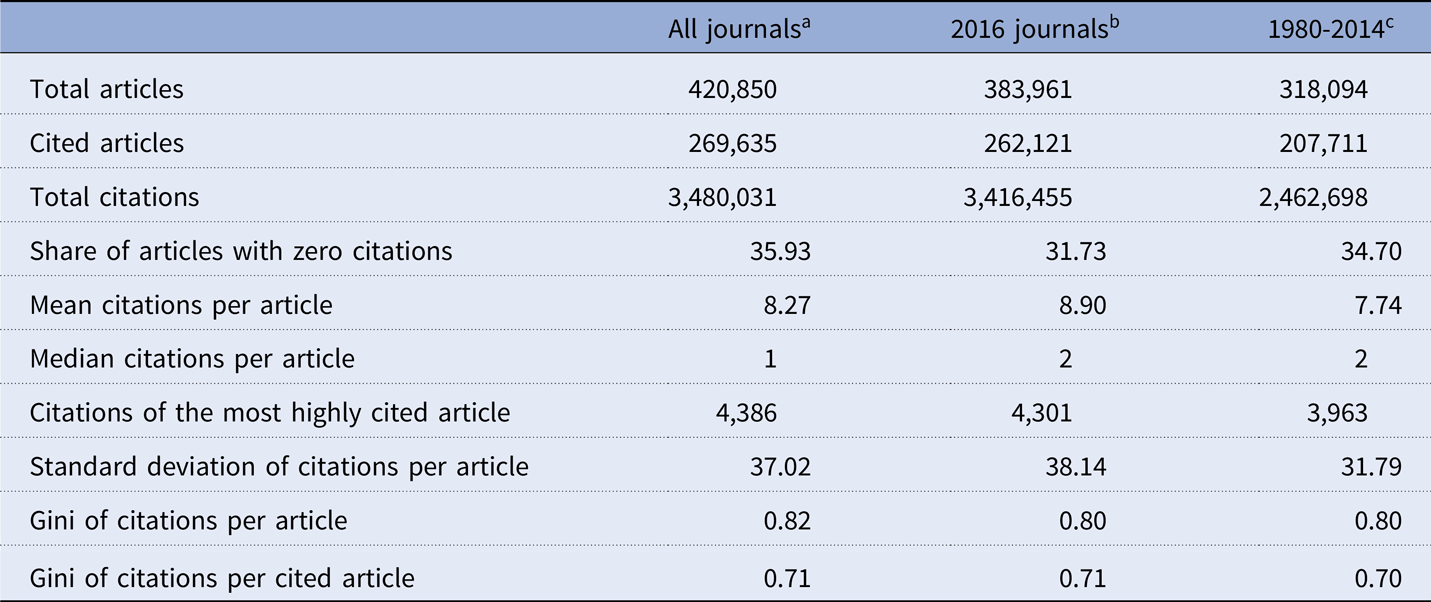
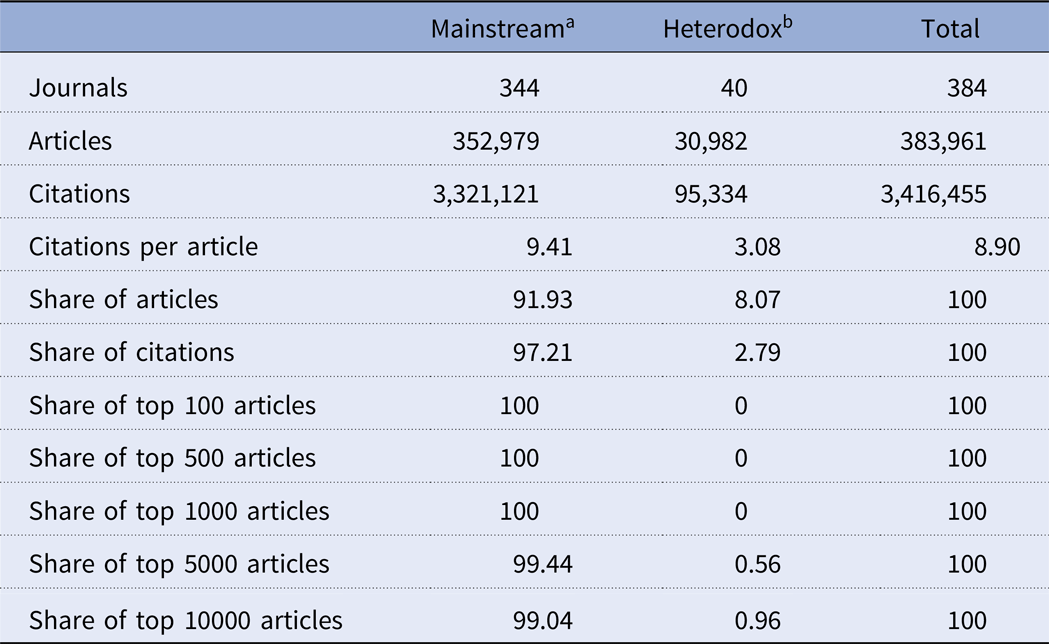
In addition to the data from the WoS, data on location and authors’ affiliations, available for the time period 1980-2014, were retrieved from Thomson Reuters’ InCites to investigate geographic and institutional concentration. To make the analysis of paradigmatic concentration possible, the data set was restricted to all journals that were still being published in 2016. These journals were then coded as “heterodox” or “mainstream” on the basis of the Heterodox Economics Directory (HED). The HED provides a list of all currently published journals that are considered to be open to publications from heterodox schools of thought (Kapeller and Springholz Reference Kapeller and Springholz2016). The 40 journals in the restricted sample that are on this list were coded as “heterodox,” the remaining 344 journals were coded as “mainstream”. The reduced data set encompasses 3,416,455 citations of 383,961 articles in 384 journals. Forty-nine journals that were no longer listed in Web of Science in 2016 (which can be the result of delistings, reclassifications, or the cessation of publication of the journal) were discarded from the analysis of paradigmatic concentration due to a lack of a satisfactory descriptor of their paradigmatic orientation. An overview on the three sub-samples of the data is given in Table 1.
Overview on the three discussed subsamples.

Notes.
a The total sample of all articles and citations listed in the Web of Science subject category economics between 1956 and 2016. This sample is used for the analysis for article, journal, and author concentration.
b The restricted sample covering all articles and citations of journals that were still being published in 2016. This sample is used for the analysis of paradigmatic concentration.
c The sample covers the time period for which data on affiliation is available in the InCites database. This sample is used for the analysis of geographic and institutional concentration.
To investigate concentration in economics, the data set was analyzed scientometrically. We chose three main indicators which provide information on different aspects of concentration for each year. The Gini coefficient is used as a general measure for the distribution of citations. In order to evaluate concentration with respect to specific groups of journals, institutions, countries or paradigms, the share of citations received by the respective group is considered. The share of a particular group in the top 100, 500, and 1000 most-cited articles or top 1, 5, 10 and 50 percent most-cited articles serves as an indicator for the concentration at the top. The results of this scientometric analysis are presented in what follows.
2. Results
2.1 Article concentration
Of the 420,850 articles in the data set, less than two-thirds were cited at least once in the respective year. The most cited article received 4,386 citations, while the average number of citations, per article is 8.27 with a standard deviation of 37.02. The median of 1 is significantly lower. This skewness is a first indicator of a concentration of citations. The overall Gini coefficient of 0.82 further underlines this. When only cited articles are considered, that is articles that were cited at least once, the Gini is still 0.71 (see Table 1).
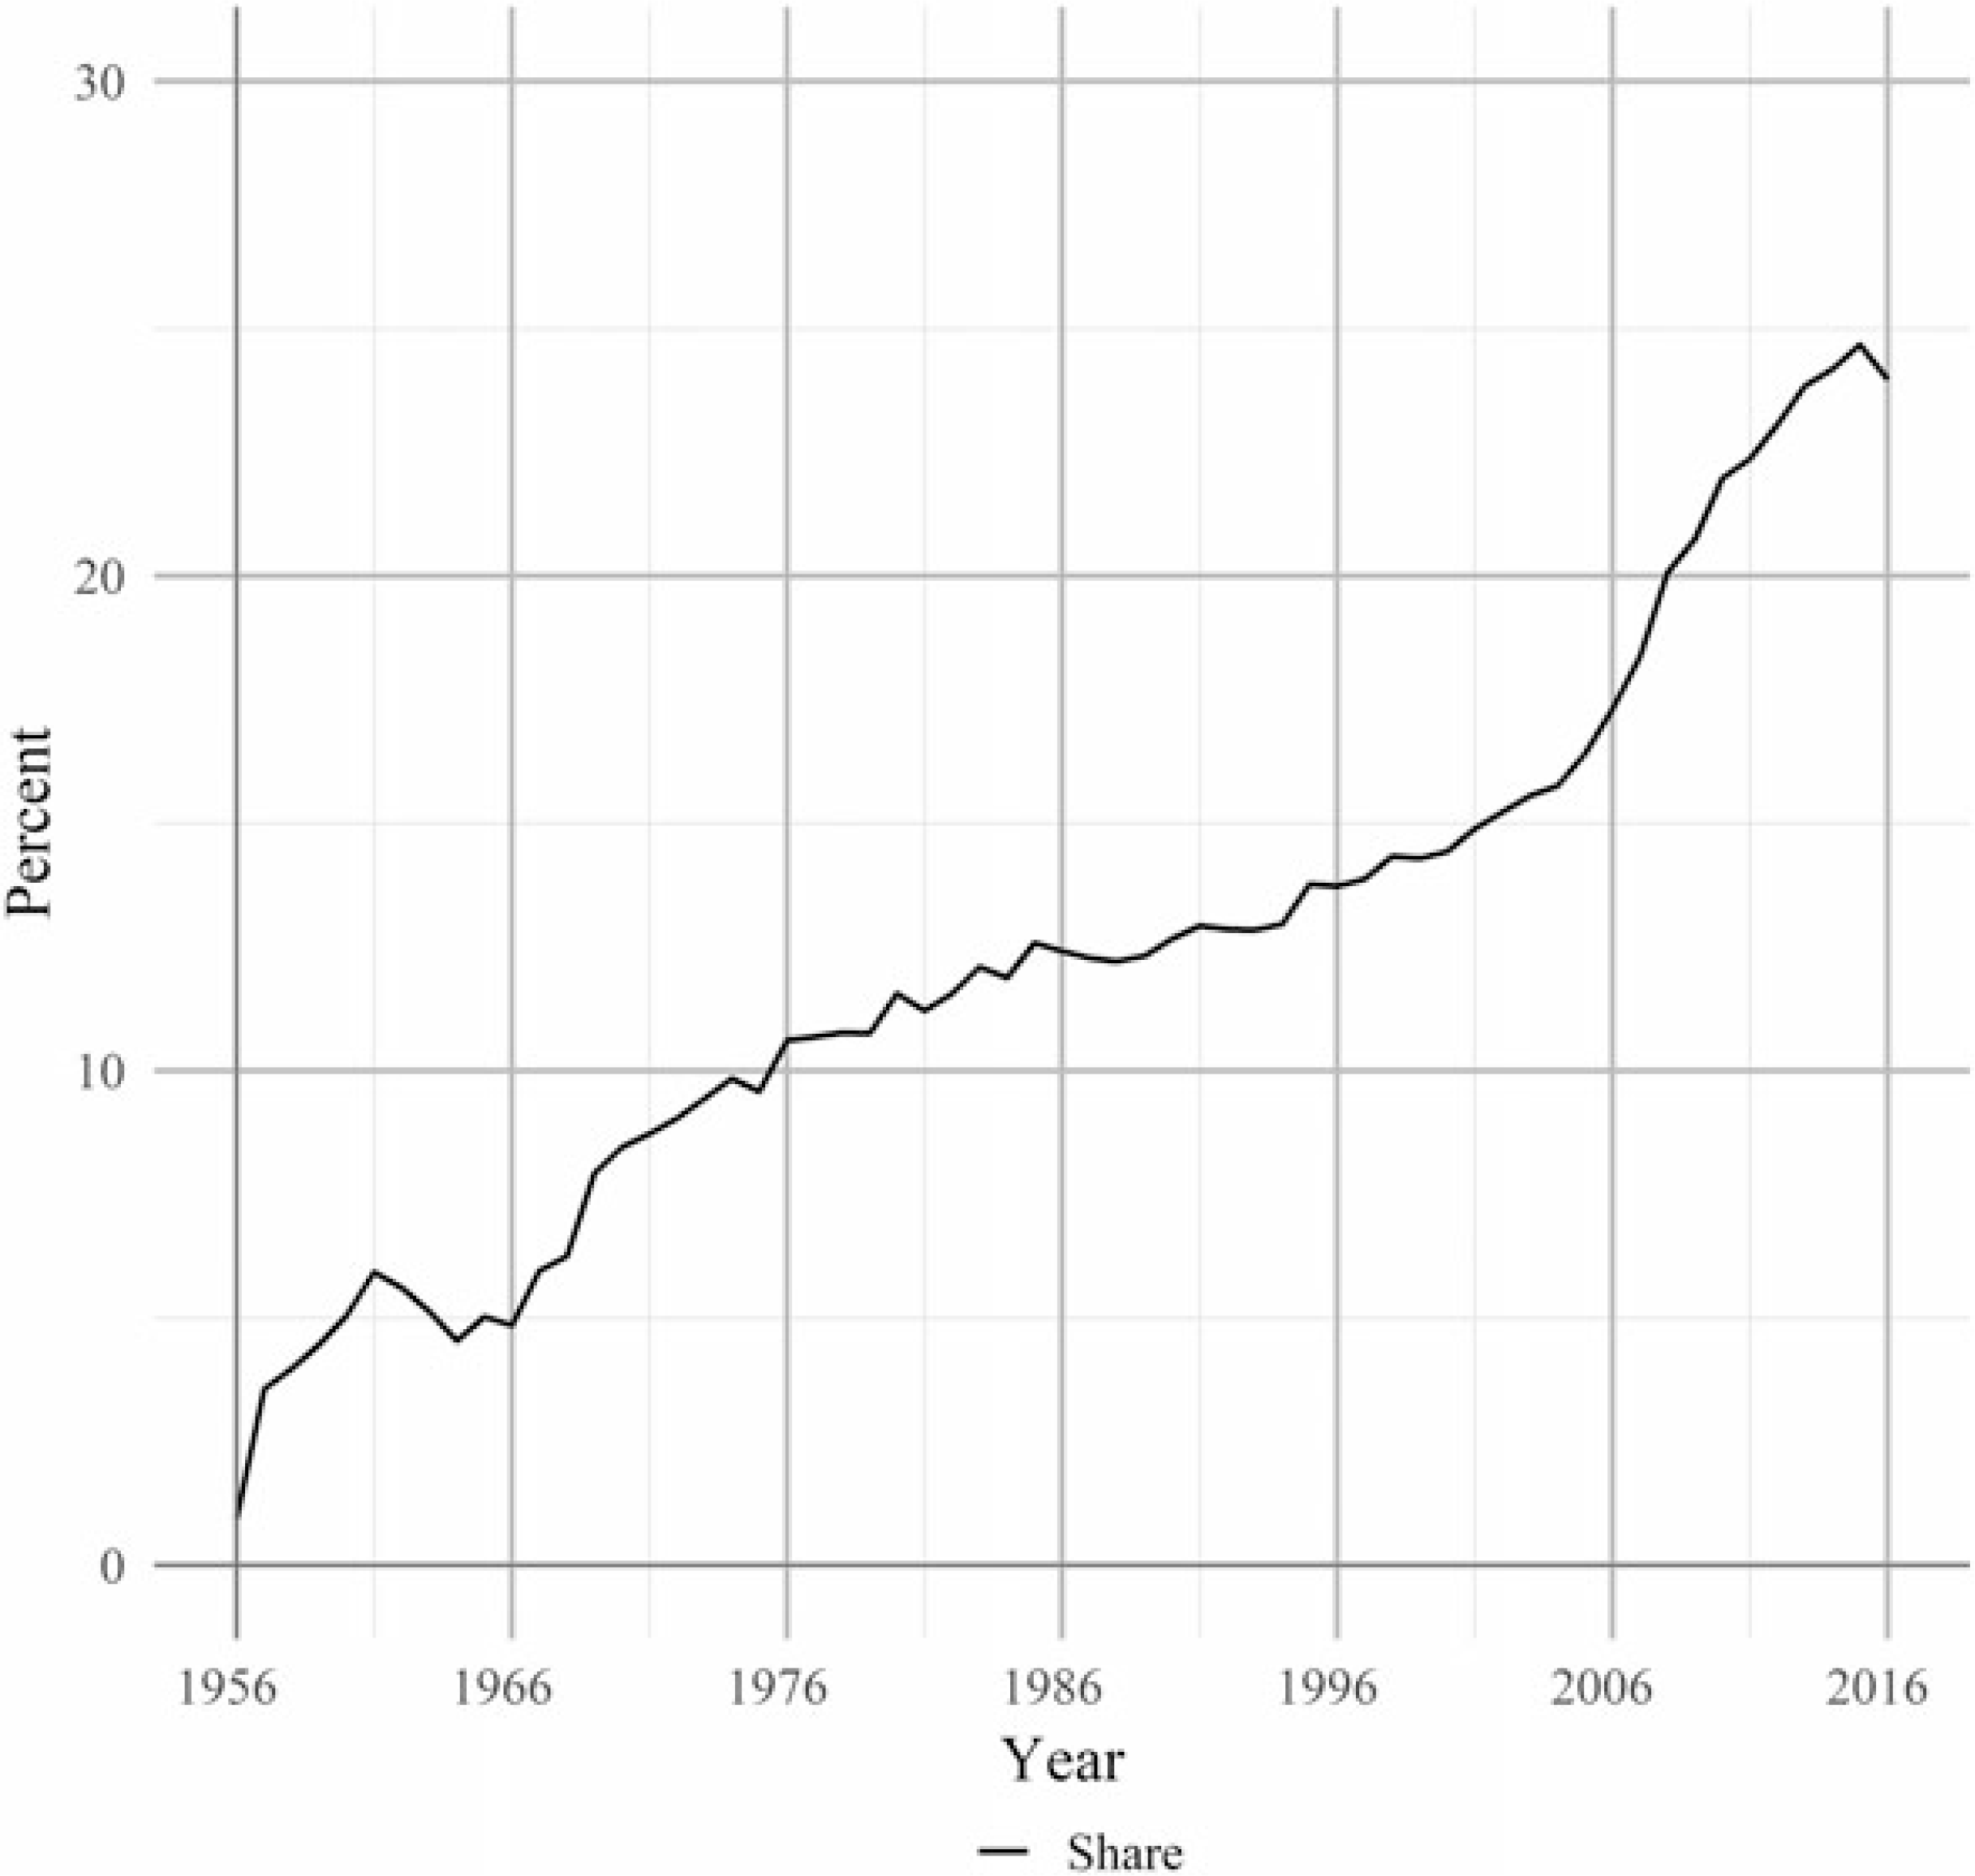
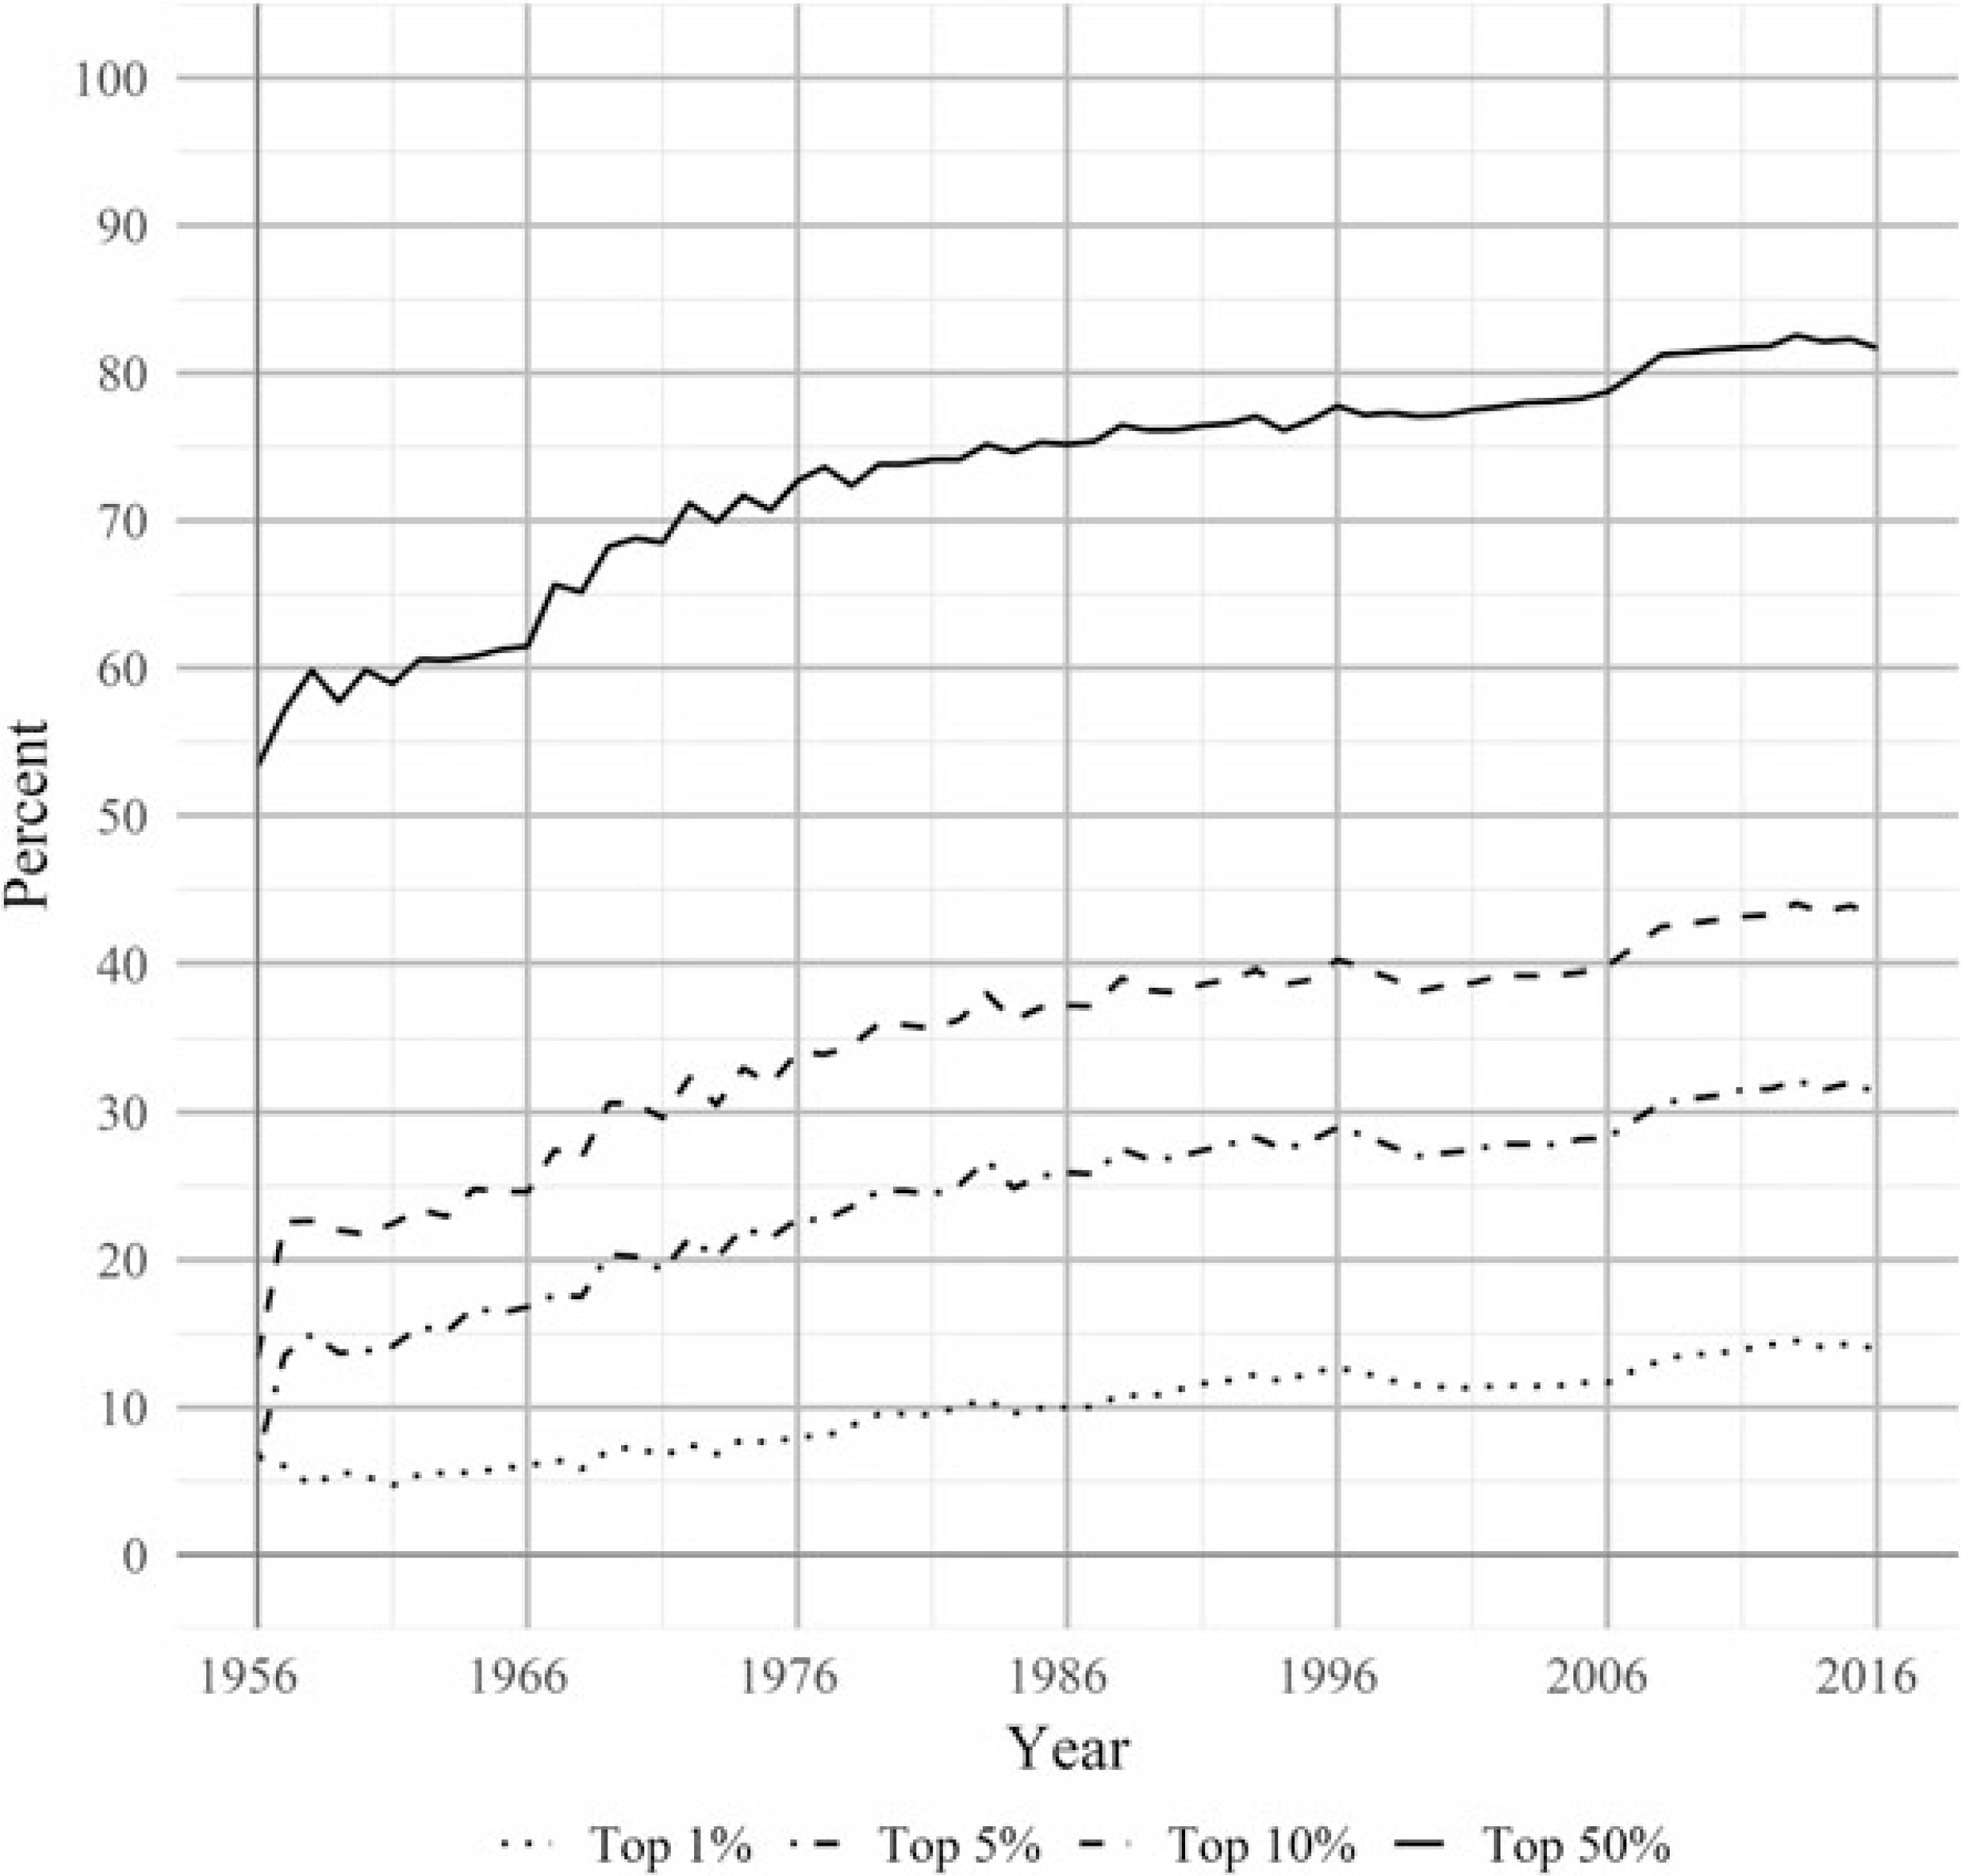
Of the cumulative articles published up to the respective year (which is abbreviated as cumulative articles), the share that receive at least one citation in the respective year has continuously increased since 1956 and is around 23.4 percent in 2016 (see fig. 3). Still, the overall distribution of citations has become more concentrated. Fig. 4 shows the share of citations going to the top 1, 5, 10, and 50 percent of cited articles each year, i.e. of all articles that were cited at least once in the respective year.Footnote 5
Share of cumulative articles in the respective year cited at least once, 1956–2016.

Share of citations to the top 1, 5, 10, 50 percent of articles each year, 1956–2016.

The share of citations received by the top 1 percent of cited articles increased from around 5 percent in 1960 to around 15 percent in 2016. Even stronger was the increase for the top 5 percent, which accounted for around 14 percent in 1960, compared to more than 31 percent in 2016. The top 10 percent of cited articles doubled their share from 22 to 44 percent, the share of the top 50 percent increased from below 60 to around 82 percent.
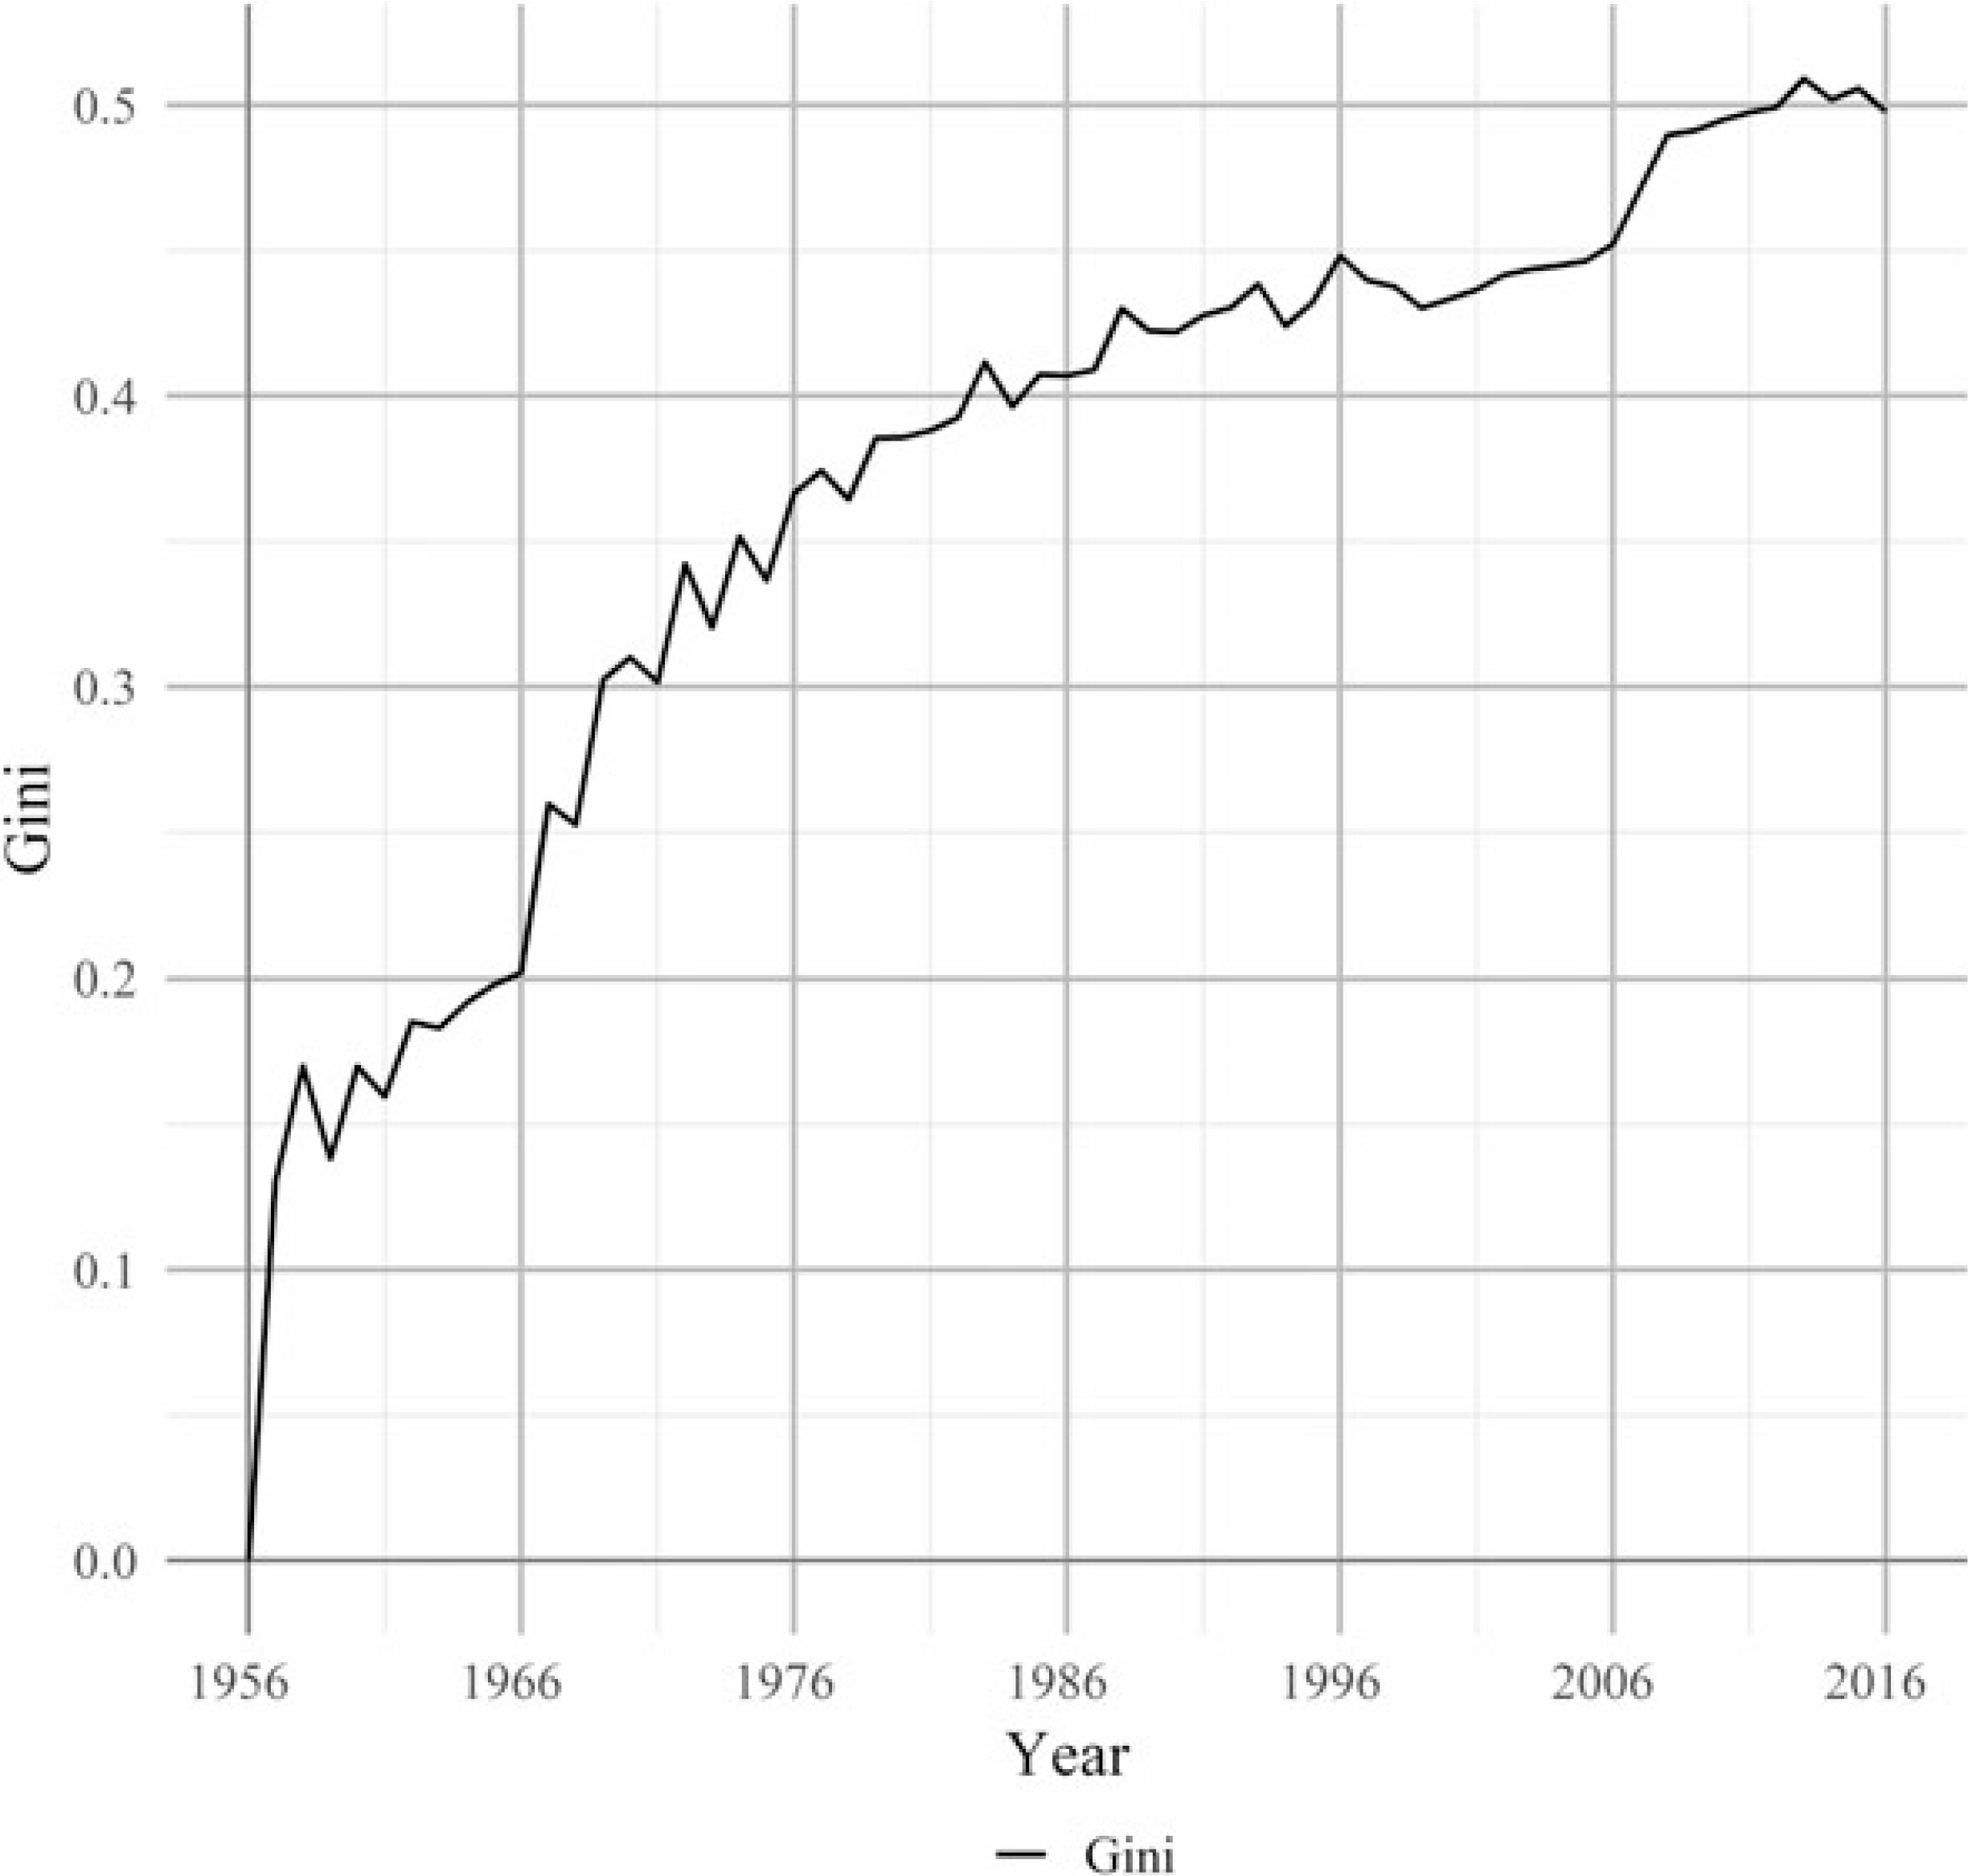
The corresponding Gini coefficients of the citation distribution among the articles that were cited at least once in the respective year, depicted in fig. 5, further support the finding of increasing concentration on the article level. The coefficient rose over the entire observation period from below 0.2 in the late 1950s to 0.5 in 2016. The sharpest increase is observable between 1966 and 1972, after which the steepness of the slope gradually declined. The Gini coefficient stayed roughly constant at below 0.45 between 1996 and 2006. Concurrently to the marked increase in articles in the data set shown in Fig. 1, the Gini jumped by around 0.04 points from 2006 to 2007 and has remained stable at around 0.5 since then. This suggests that the rise in the Gini coefficient may in part be due to the inclusion of lower ranked journals in the Web of Science which receive fewer citations.
Gini coefficients for the distribution of citations among the cited articles in the respective year, 1956–2016.

2.2 Journal concentration
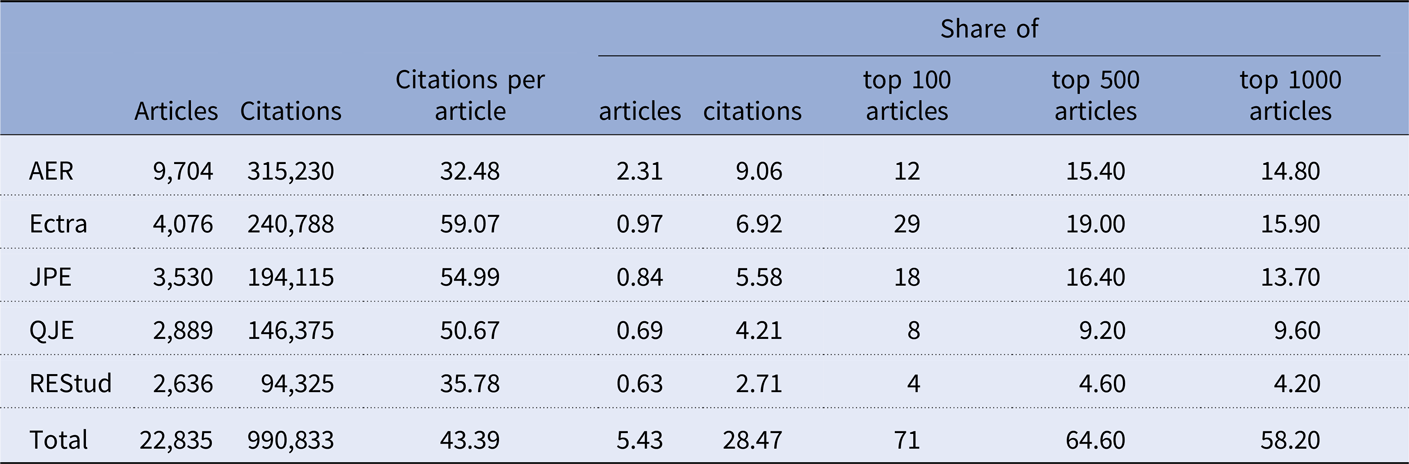
Concentration on the level of journals has been much discussed. The role of the “Top Five” journals has especially received increasing attention over the last few years (e.g. Card and DellaVigna Reference Card and DellaVigna2013 and AEA 2017). The share of citations and the share of top articles (ranked by number of citations) presented in Table 2 provides an intuition of the extent of concentration attributable to the “Top Five.”Footnote 6
The ‘Top Five’ journals in economics, 1956–2016.

Notes. Top 100, 500, and 1000 articles refers to the most-cited articles in the data set.
With 9,704 articles, which corresponds to 2.2 percent of all articles in the data set, the AER published the most papers in the “Top Five” group. Together, the five journals account for 22,835 articles and close to a million citations – that is 5.4 and 28.5 percent of all articles and citations, respectively. The AER received 9.1 percent of all citations, followed by Ectra with 6.9 percent, the JPE with 5.6 percent, the QJE with 4.2 percent, and the REStud with 2.7 percent. The concentration is still more pronounced when considering the share of top articles that were published in one of the five journals. Together, they account for 58.2 percent of the 1,000 most-cited articles in economics. Of the top 500 articles, around 64.6 percent were published in “Top Five” journals. Of the 100 most-cited articles, they account for 71. Concentration thus increases towards the top of the discipline. Bearing in mind that there are 433 journals in the sample, the substantial concentration of top articles and citations in the “Top Five” is remarkable. It is interesting to note that while the AER clearly is the most-cited journal it exhibits the lowest number of citations per article, especially Ectra has a significantly higher number of mean citations (59.1 compared to 32.5) and accounts for a larger number of top articles; a tendency that decreases the more articles are included.
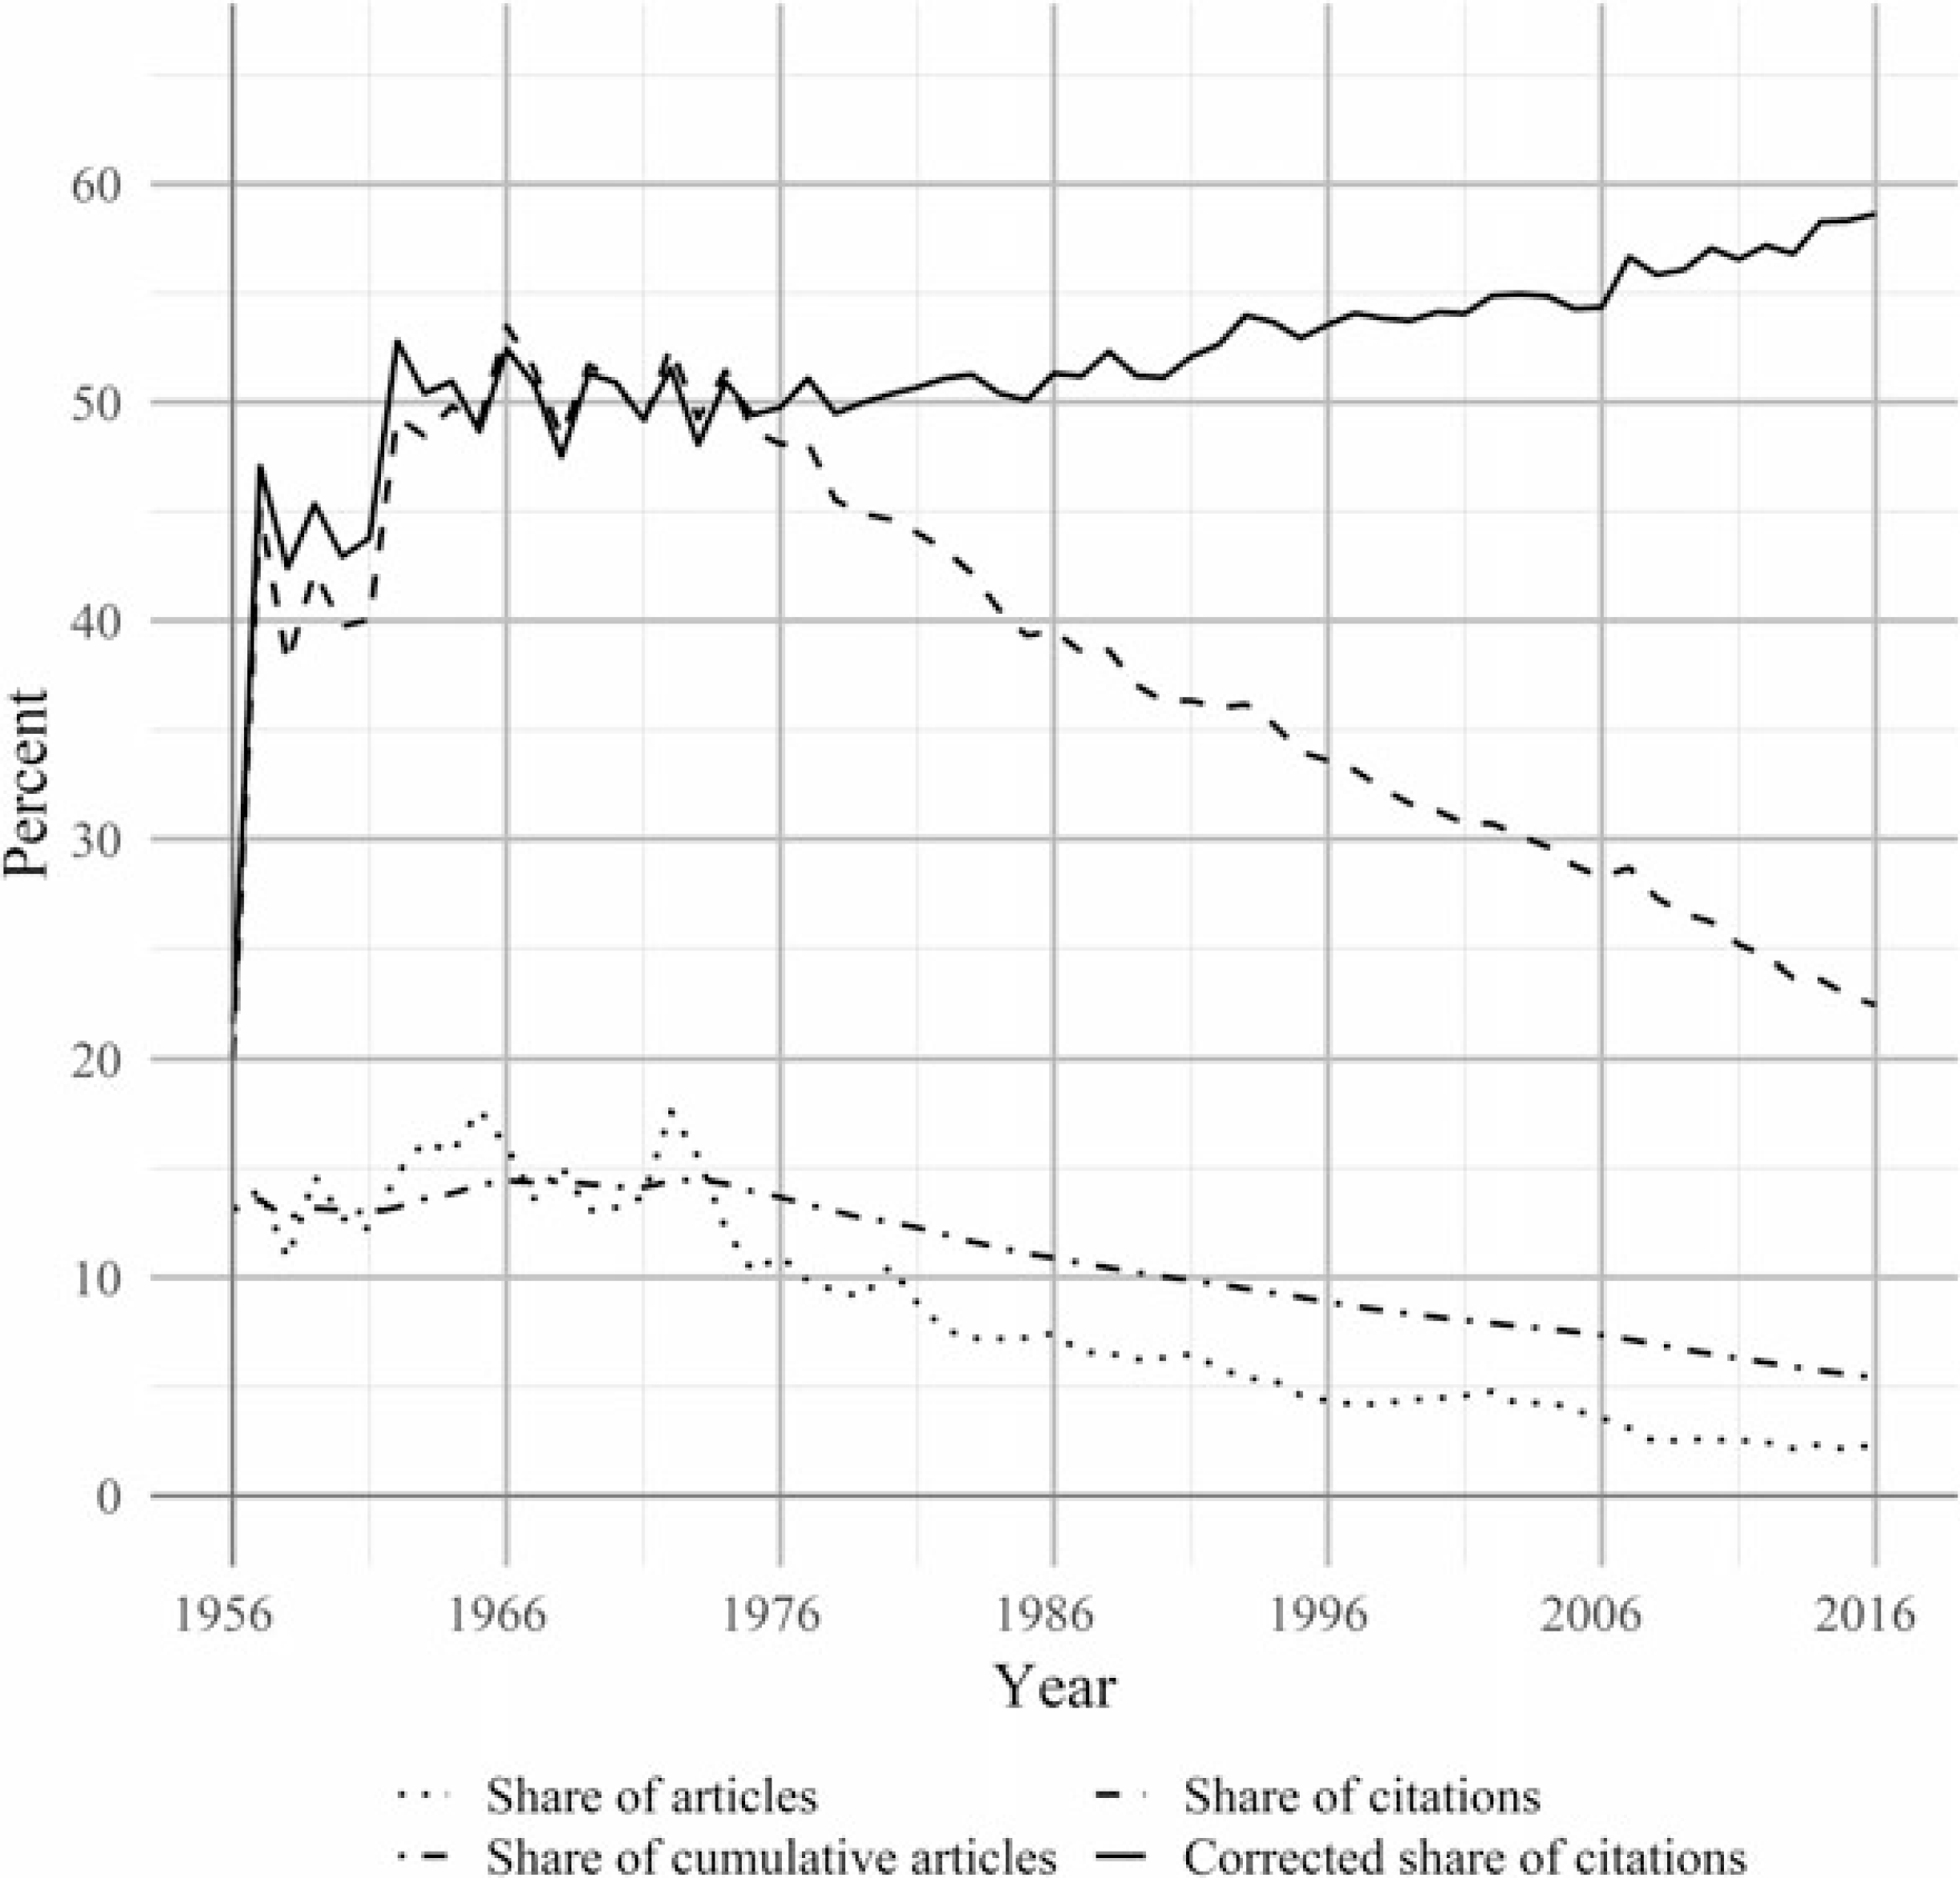
The share of articles published in “Top Five” journals each year has been gradually declining since the early 1970s (as illustrated by the dotted line in fig. 6). This is due to the fact that the field of economics is rapidly increasing in size, while the “Top Five” journals face some limit to the quantity of papers they can publish each period. As a consequence also the share of the “Top Five” in the cumulative articles in the data set decreased since then from around 15 percent to around 5 percent in 2016 (dot-dashed line). It is then not surprising that also the share of citations (dashed line) fell from its peak of over 50 to around 23 percent in the same time period. However, correcting for this by dividing the share of citations by the share of “Top Five” articles by all cumulative articles in the data set reveals different dynamics (solid line, normalized to 1970). After a marked increase until 1961, the corrected share remains stable until the mid-1980s. Thereafter, it increases gradually for the rest of the observation period. This suggests that if the number of articles published by the “Top Five” had increased at the same pace as the overall number of articles in the data set, concentration would have risen. The decreasing share of citations going to ‘Top Five’ journals thus seems to be predominantly driven by the rapid growth of the discipline, rather than changed patterns in the concentration of citations.
Share of citations and articles of “Top Five” journals, 1956–2014; corrected share normalized to 1970.

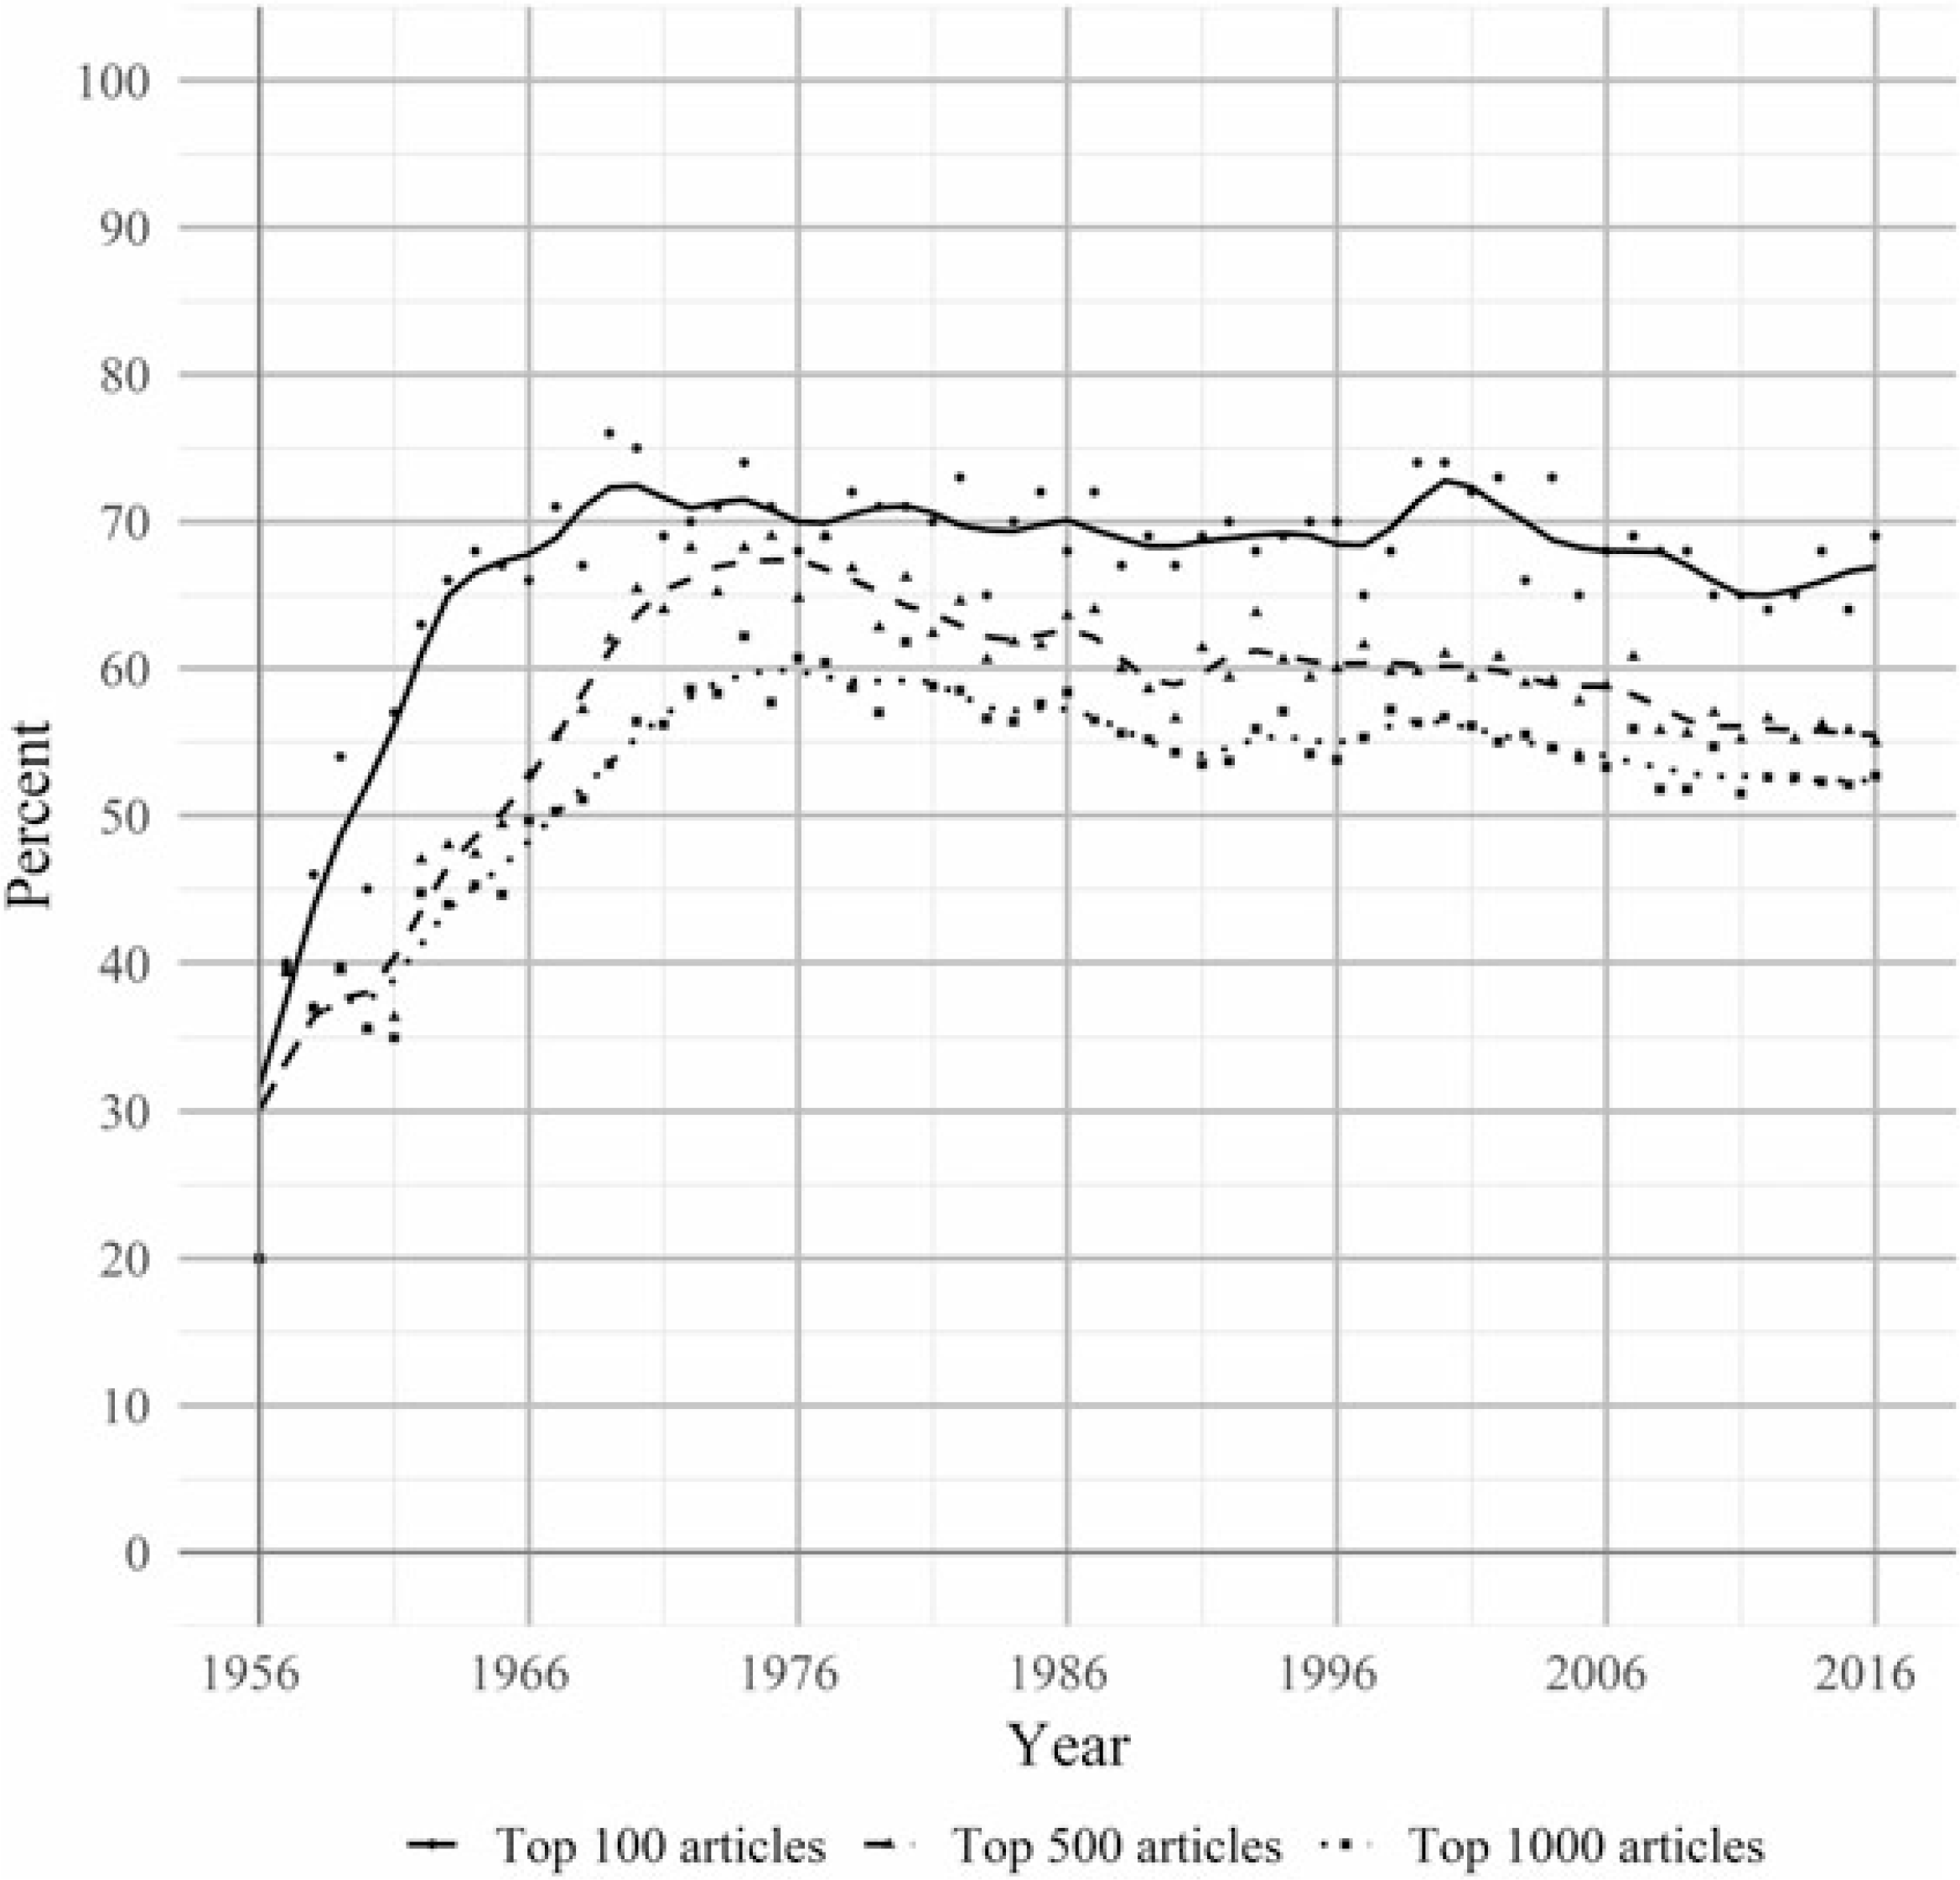
The share of top-cited articles published in “Top Five” journals has also been decreasing concurrently with the decrease of their overall share of articles in economics after the early 1970s (see fig. 7).Footnote 7 After steady increases up to that point, the share of the ‘Top Five’ in the 100, 500, and 1000 most-cited articles each year was around 70, 67, and 60 percent in 1975, respectively. After that, the share in the 500, and 1000 most-cited articles fell continuously to 55, and 52 percent in 2016, respectively. These dynamics are expectable, given the larger competition due to the declining share of the ‘Top Five’ in the cumulative articles in the data set. In contrast, the share in the 100 most-cited articles was stable for most of the observation period and only started to decline during the early 2000s. In 2016, it was still 67 percent. Again, it is noteworthy that concentration increases towards the top.
Share of “Top Five” journals in 100, 500, and 1,000 most-cited articles each year, 5-year weighted moving average, 1956–2016.

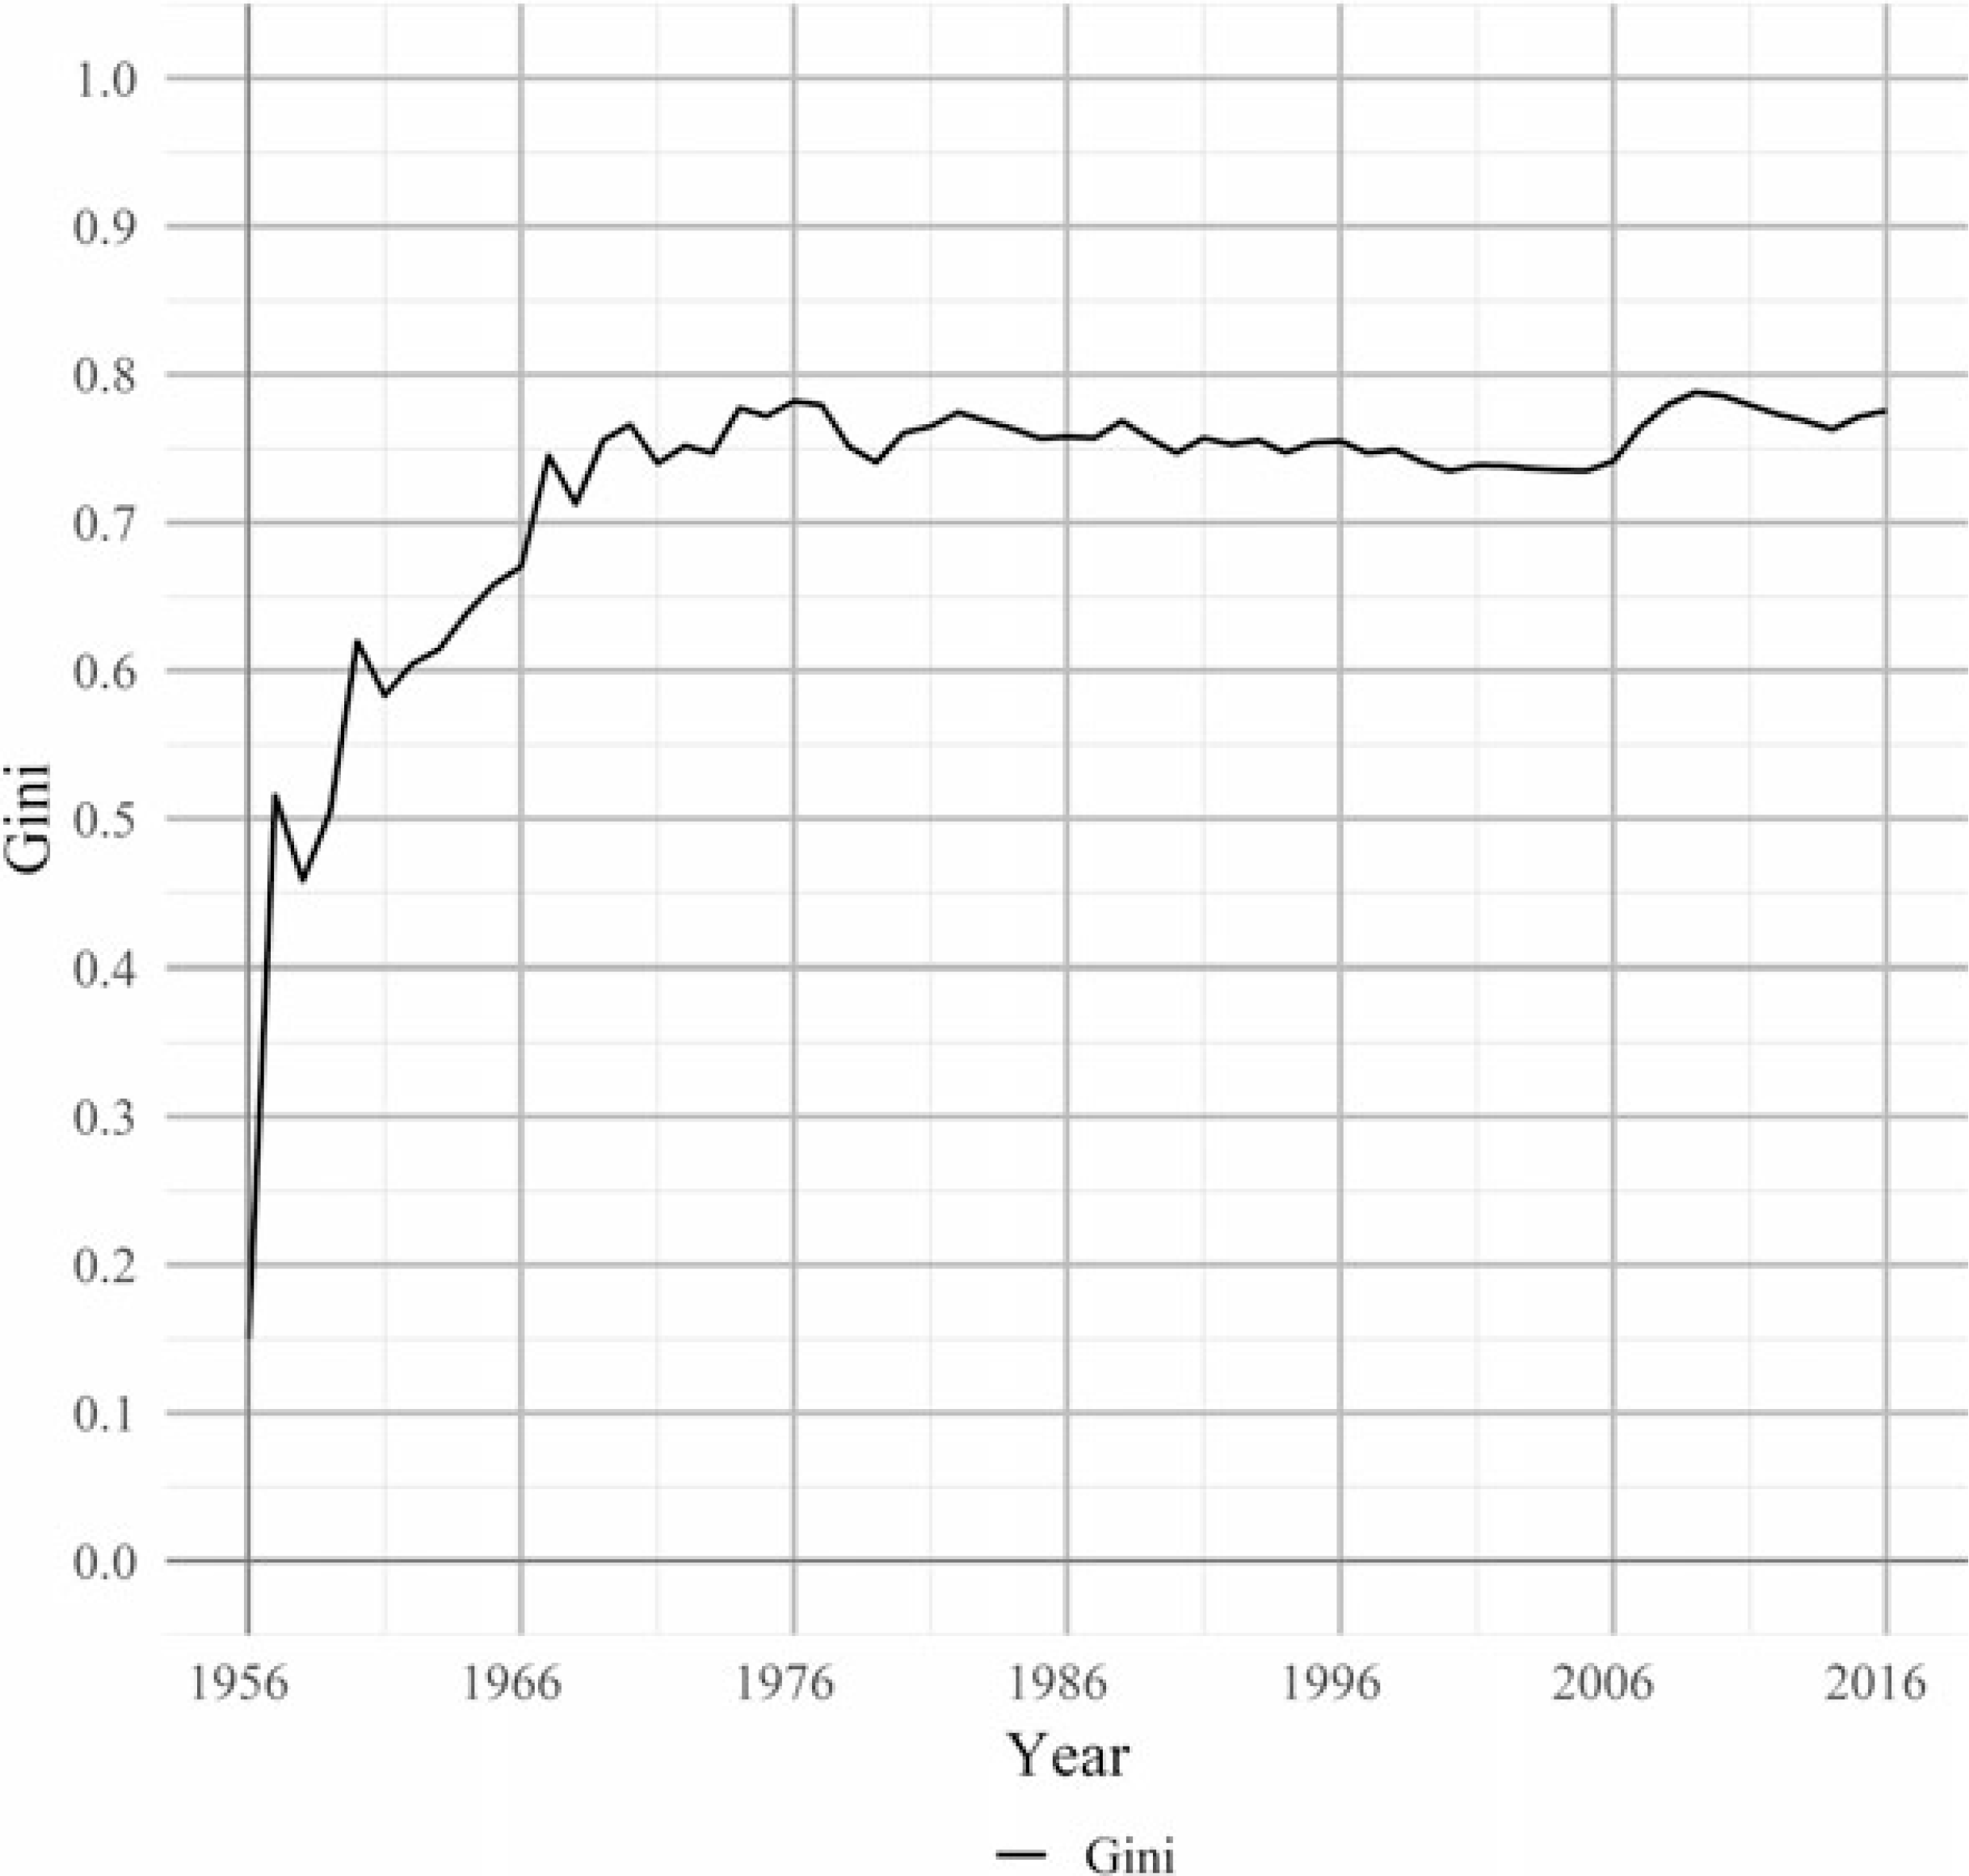
Analyzing the distribution of citations along the journal dimension as a whole further substantiates the findings made for the “Top Five”. The Gini coefficients of the distribution of citations to cited journals increased rapidly to around 0.78 in 1976 (see fig. 8). Then, for 30 years, the coefficient declined slightly to 0.74 in 2006. As previously seen on the article level, the Gini rose markedly between 2006 and 2007 and was 0.77 in 2016.
Gini coefficients of citations to cited journals in the respective year, 1956–2016.

2.3 Geographic concentration
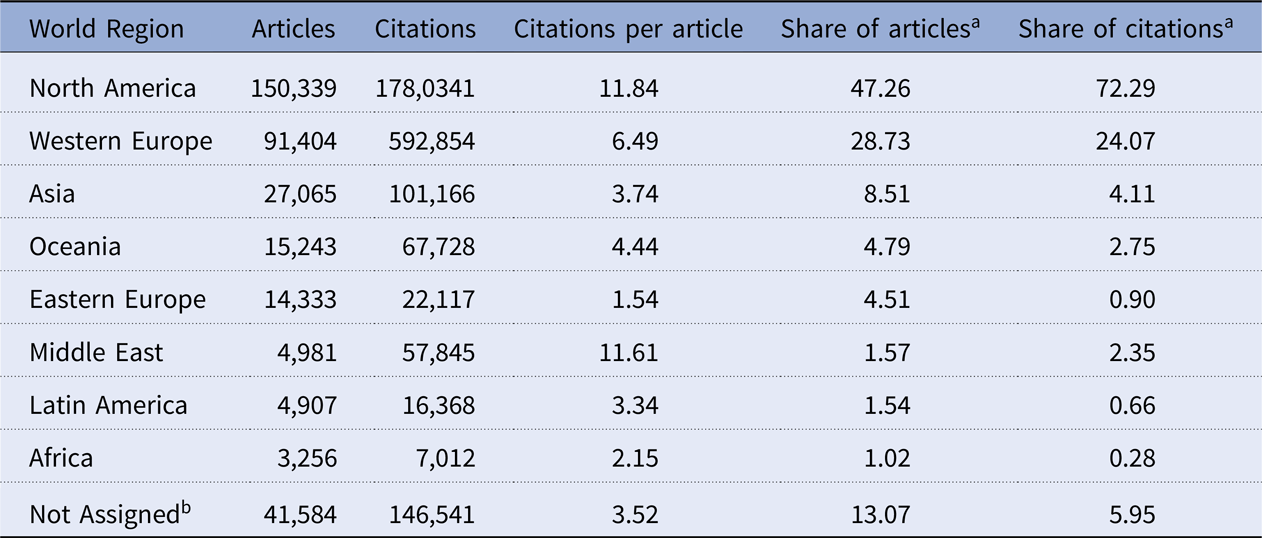
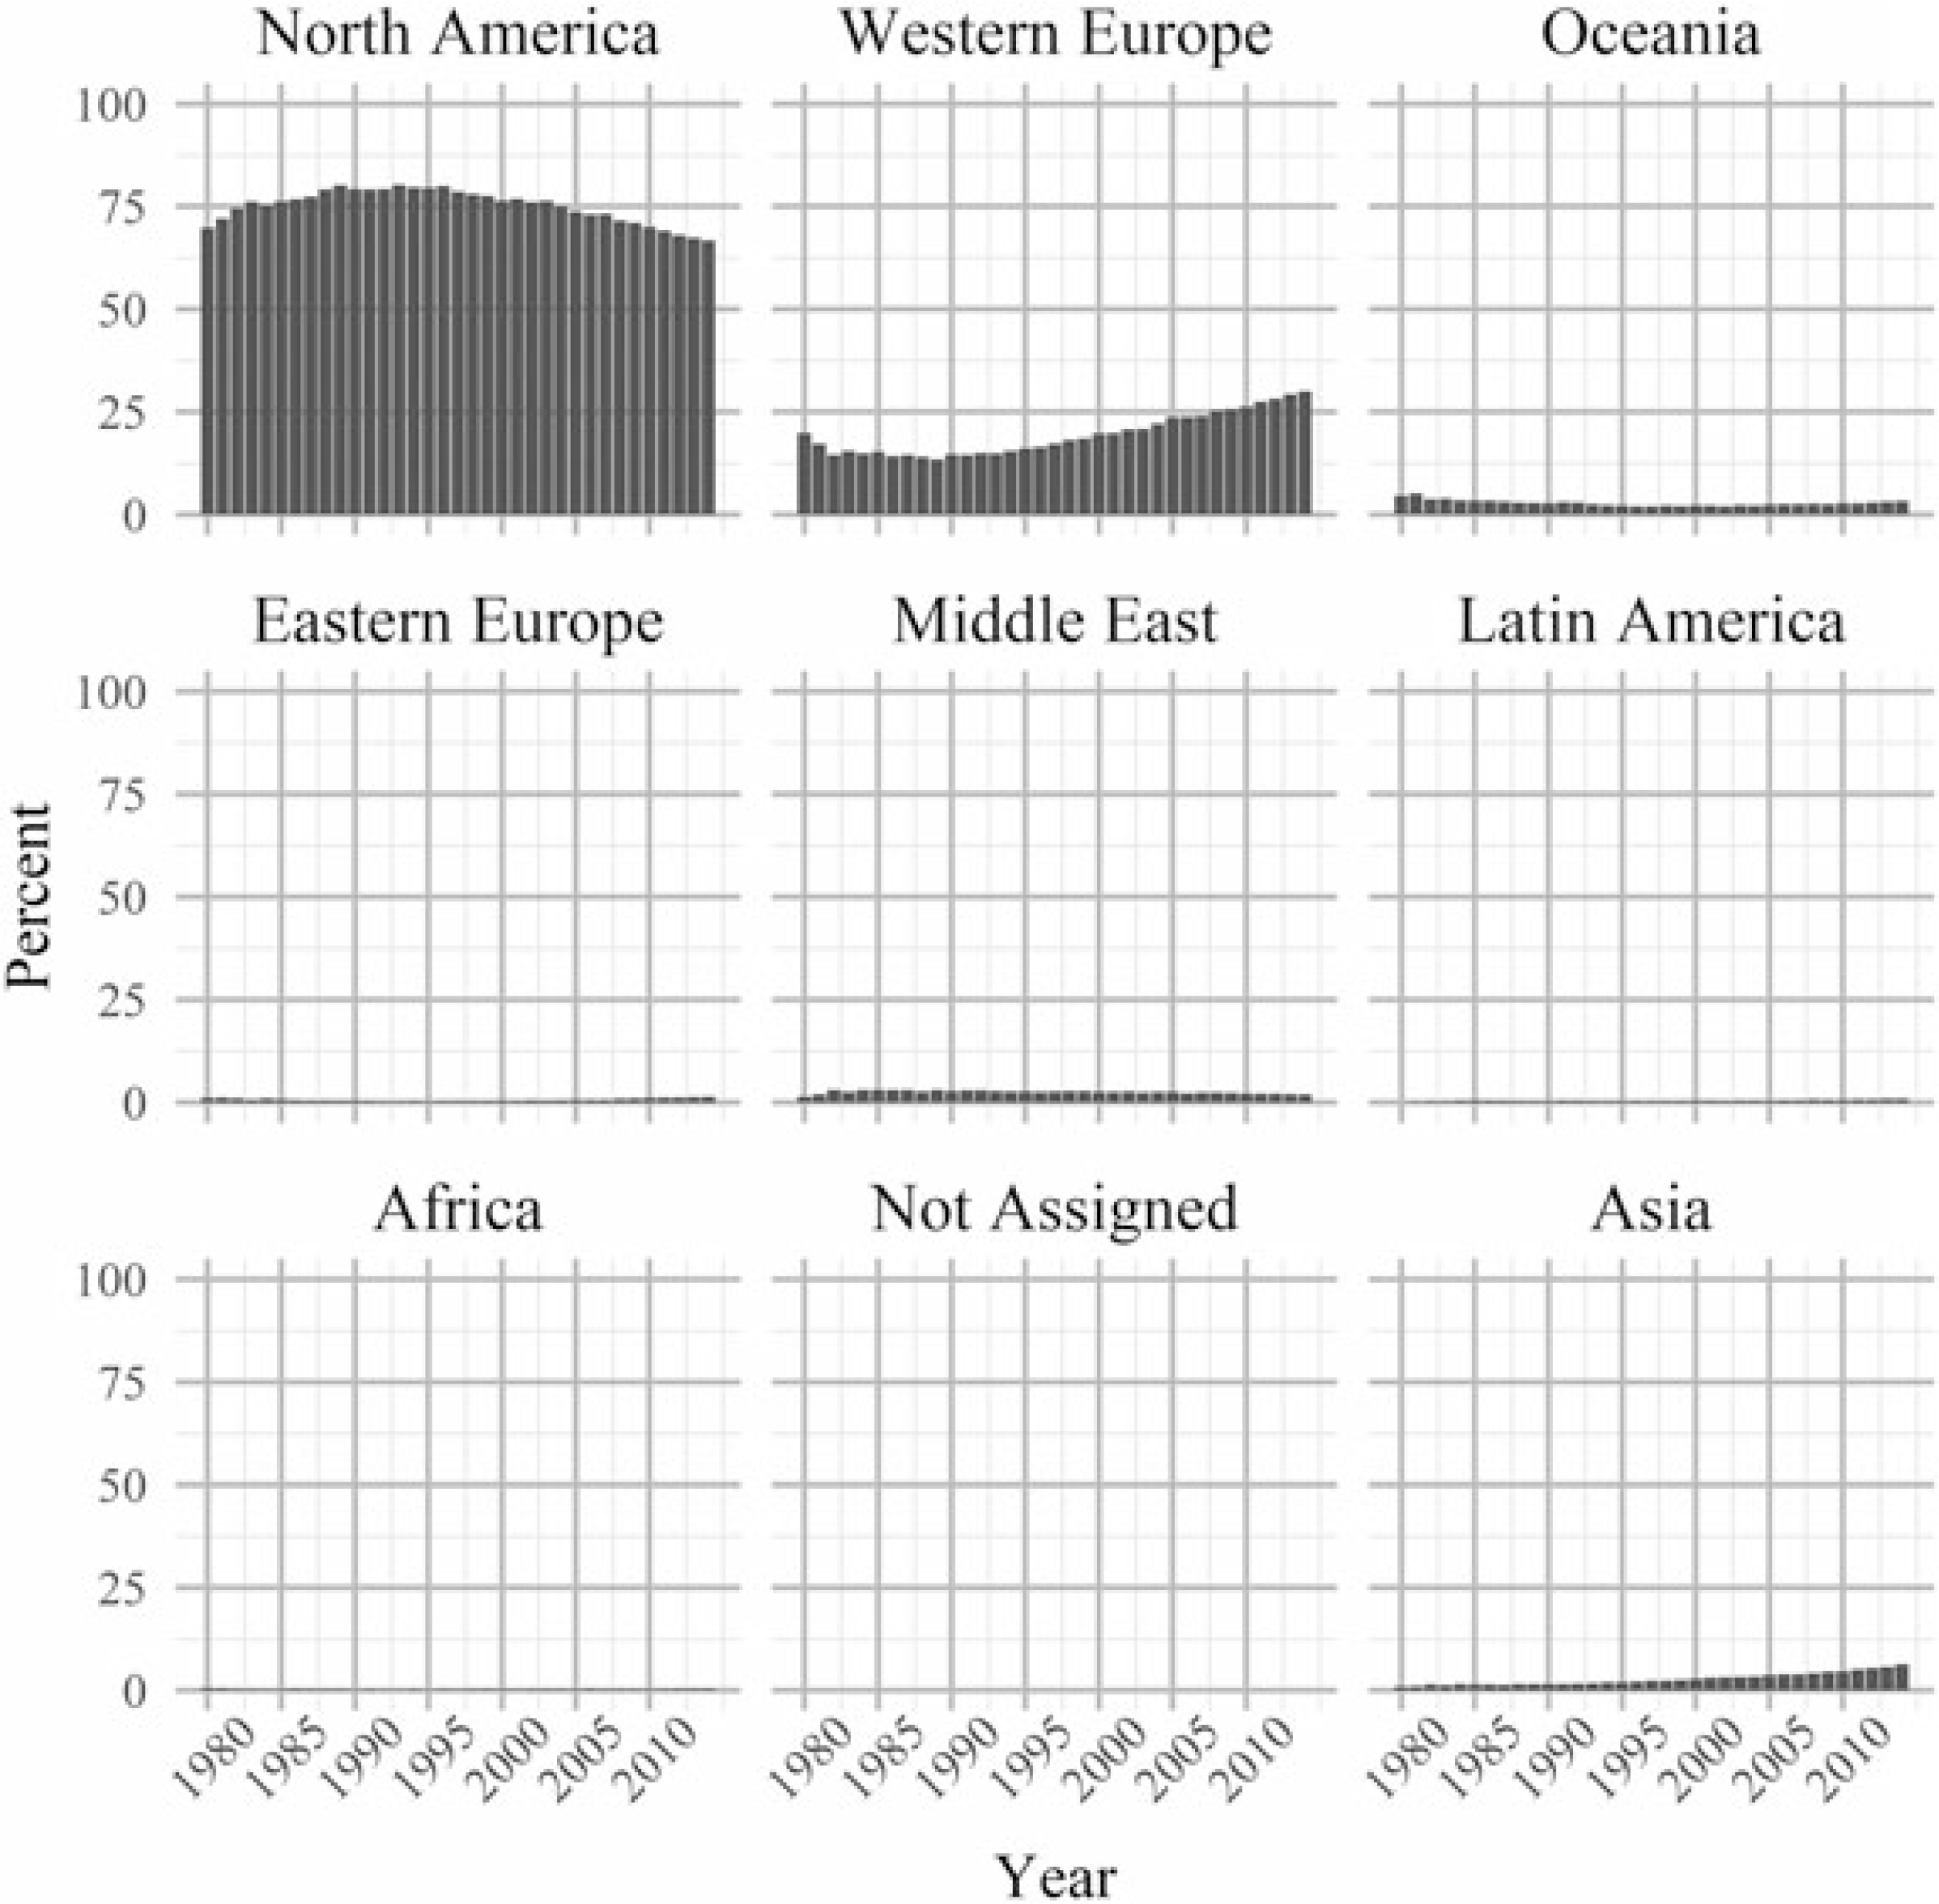
Data on affiliation, and thus also regional distribution of authors, from the InCites database allows evaluating geographic concentration. Table 3 shows the number and the share of articles and citations as well as mean citations per article by world regions. Authors affiliated with institutions in North America, i.e. the United States and Canada, are involved in nearly half of all articles (47.3 percent). Western European authors participate in more than a quarter (28.7 percent), followed by Asia (8.5 percent), Oceania (4.8 percent), and Eastern Europe (4.5 percent). Only around 1.5 in 100 articles are authored by economists in Latin America and in the Middle East, only one is authored by economists in AfricaFootnote 8.
Eight world regions in economics, 1980–2014.

Notes.
a The shares do not sum to 100 percent as co-authored articles are counted once for each region.
b 13.07 percent of articles could not be assigned to a region.
While these shares are indicative of concentration and are markedly higher than could be expected from the population of each region, once more, citations display a still stronger concentration. Articles (co-)authored by researchers from North America receive a disproportionately higher share of 72.3 percent of citations. The share of all other regions except the Middle East is disproportionately lower. Eastern Europe, Latin America and Africa together receive a mere 1.84 percent of all citations.
The source of this additional concentration in citations is the substantially different number of mean citations per article between world regions. On average, an article receives 7.7 citations over the observation period. For North America it is 11.8, while it is significantly below the overall average for all other regions apart from the Middle East (11.6), where Israel’s high number of citations pushes up the mean.
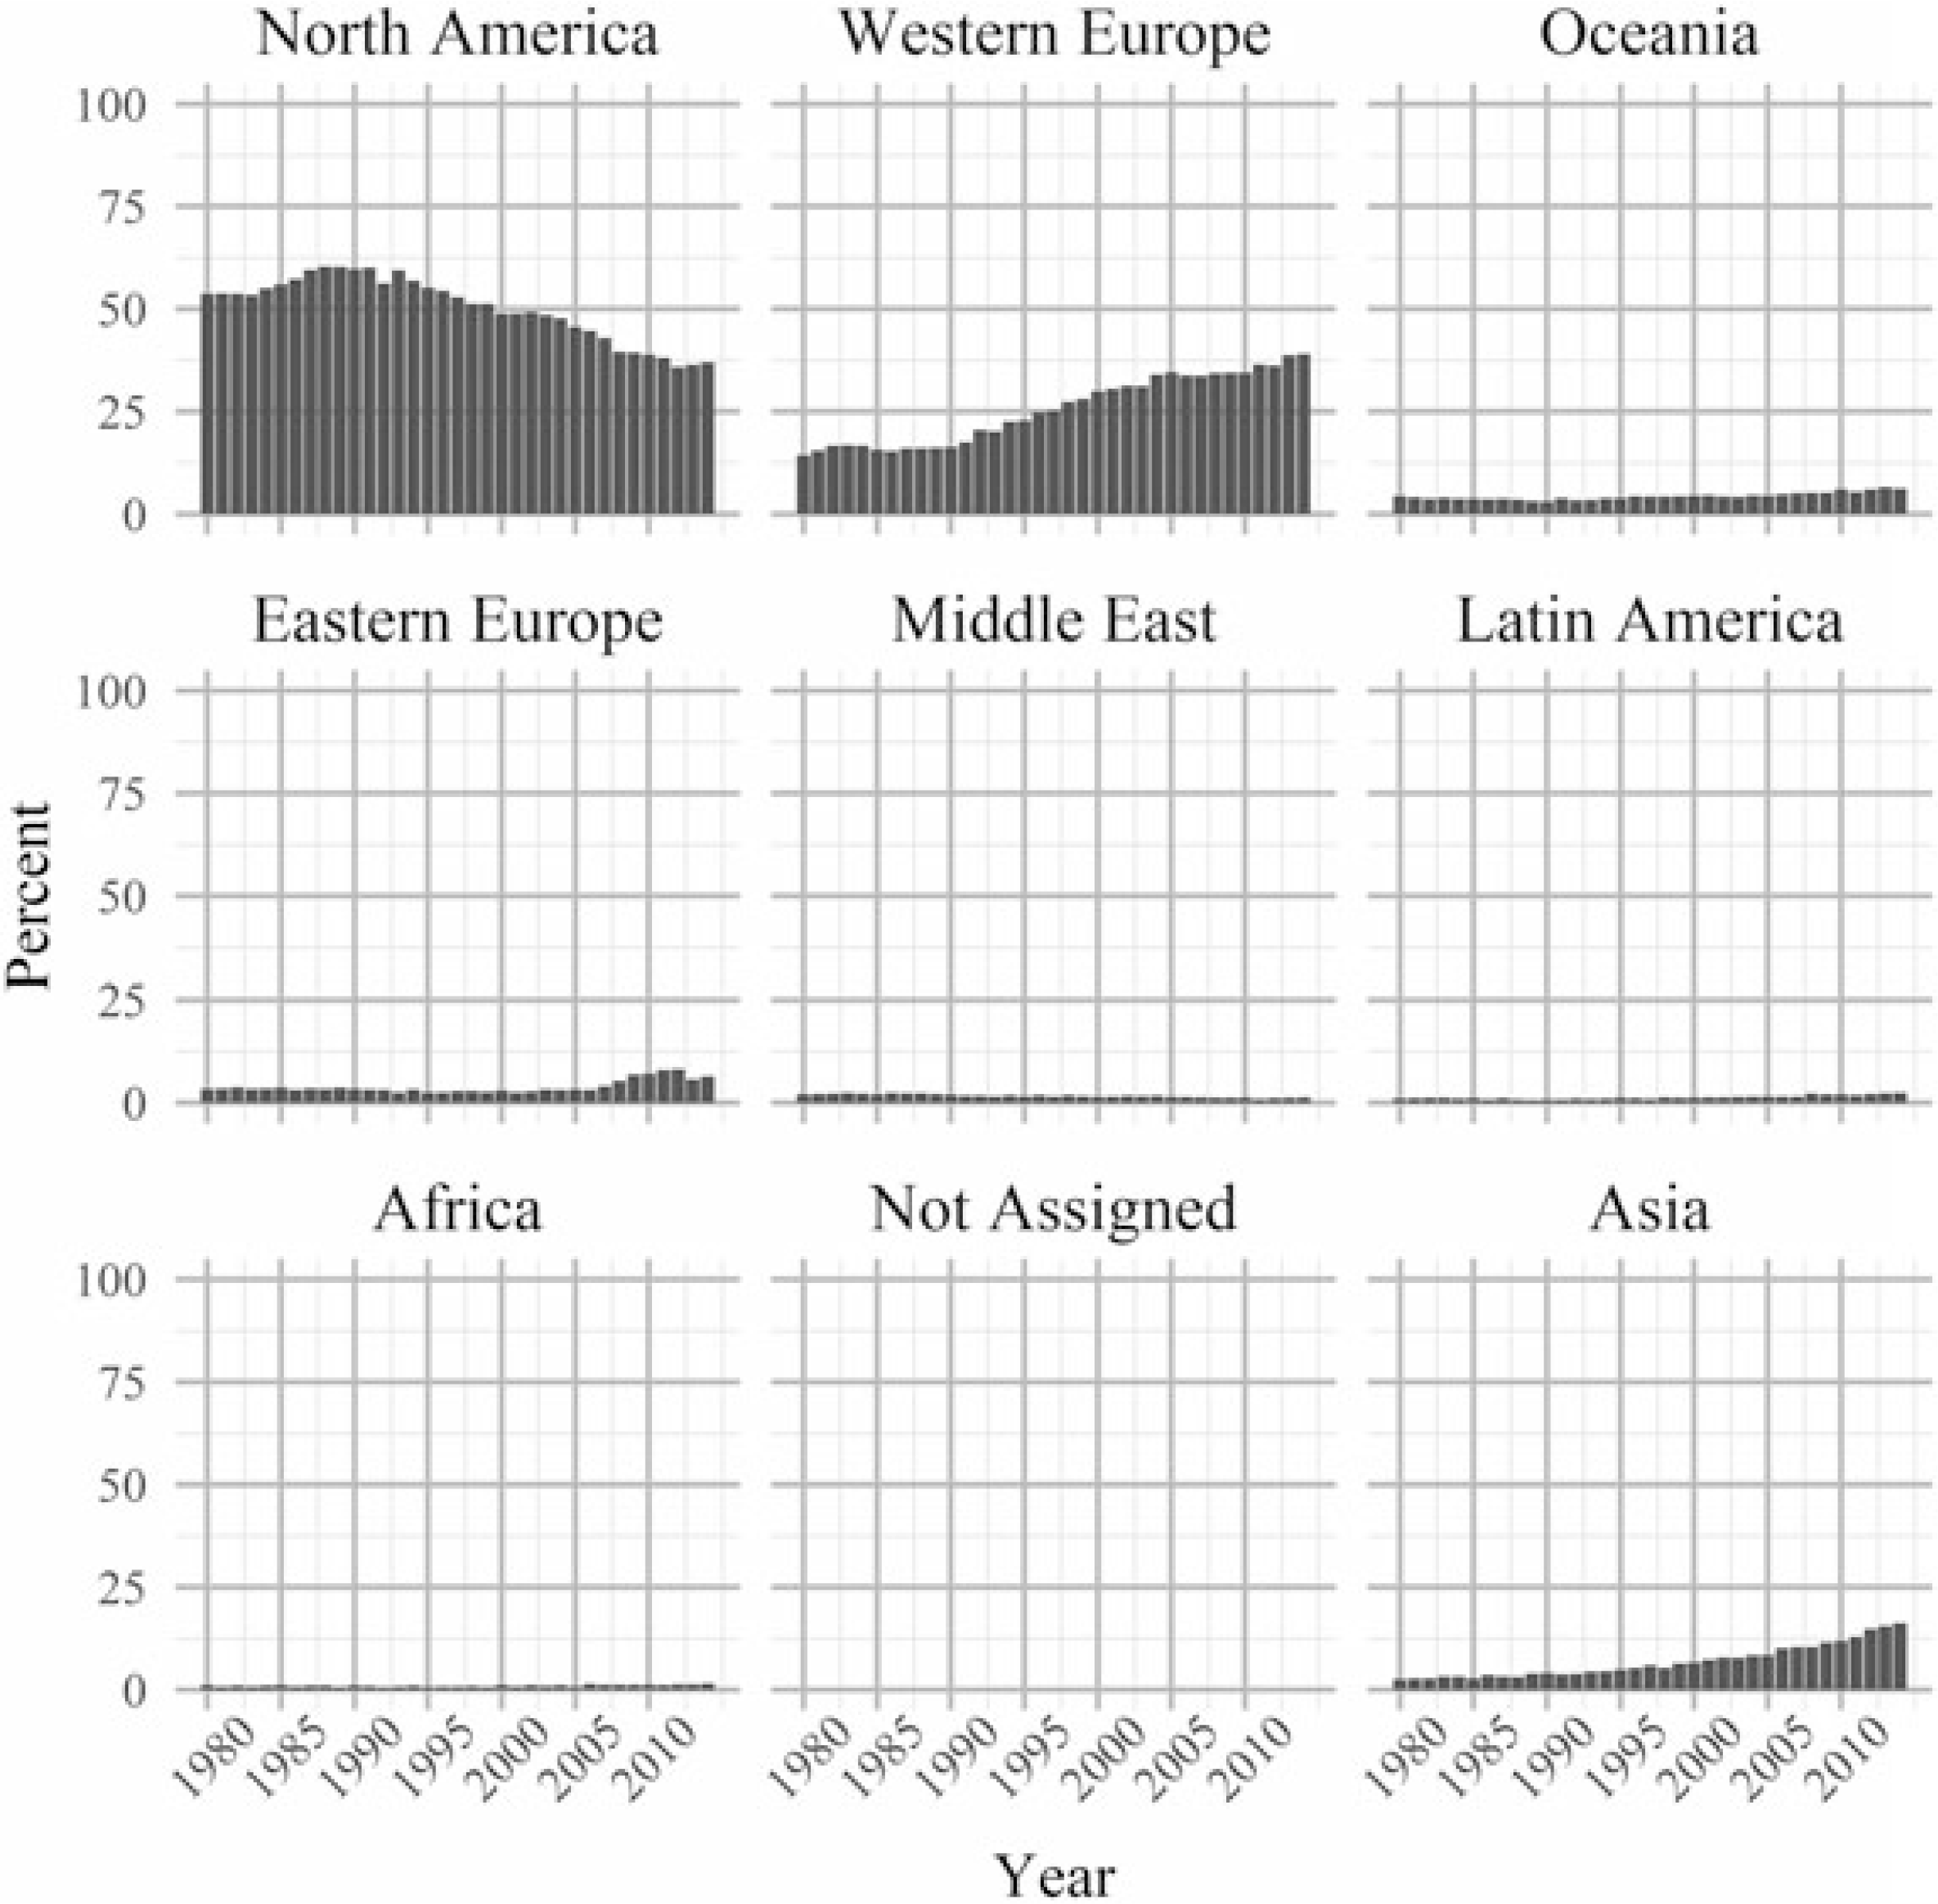
Share of articles by world region each year, 1980–2014.

Share of citations to world region each year, 1980–2014.

Figures 9 and 10 illustrate the dynamics of geographic concentration. North America’s share of articles has been declining since the 1990s, while Western Europe’s share has increased simultaneously. A clear positive trend can also be identified for Asia, to a lesser extent for Oceania, and only recently for Eastern Europe, while Latin America, the Middle East, and Africa barely register on the graph and only show very small increases. Similar trends are observable for the share of citations. Nonetheless, on the level of citations concentration seems to be more persistent, as the share of North America declines more slowly.
2.4 Institutional concentration
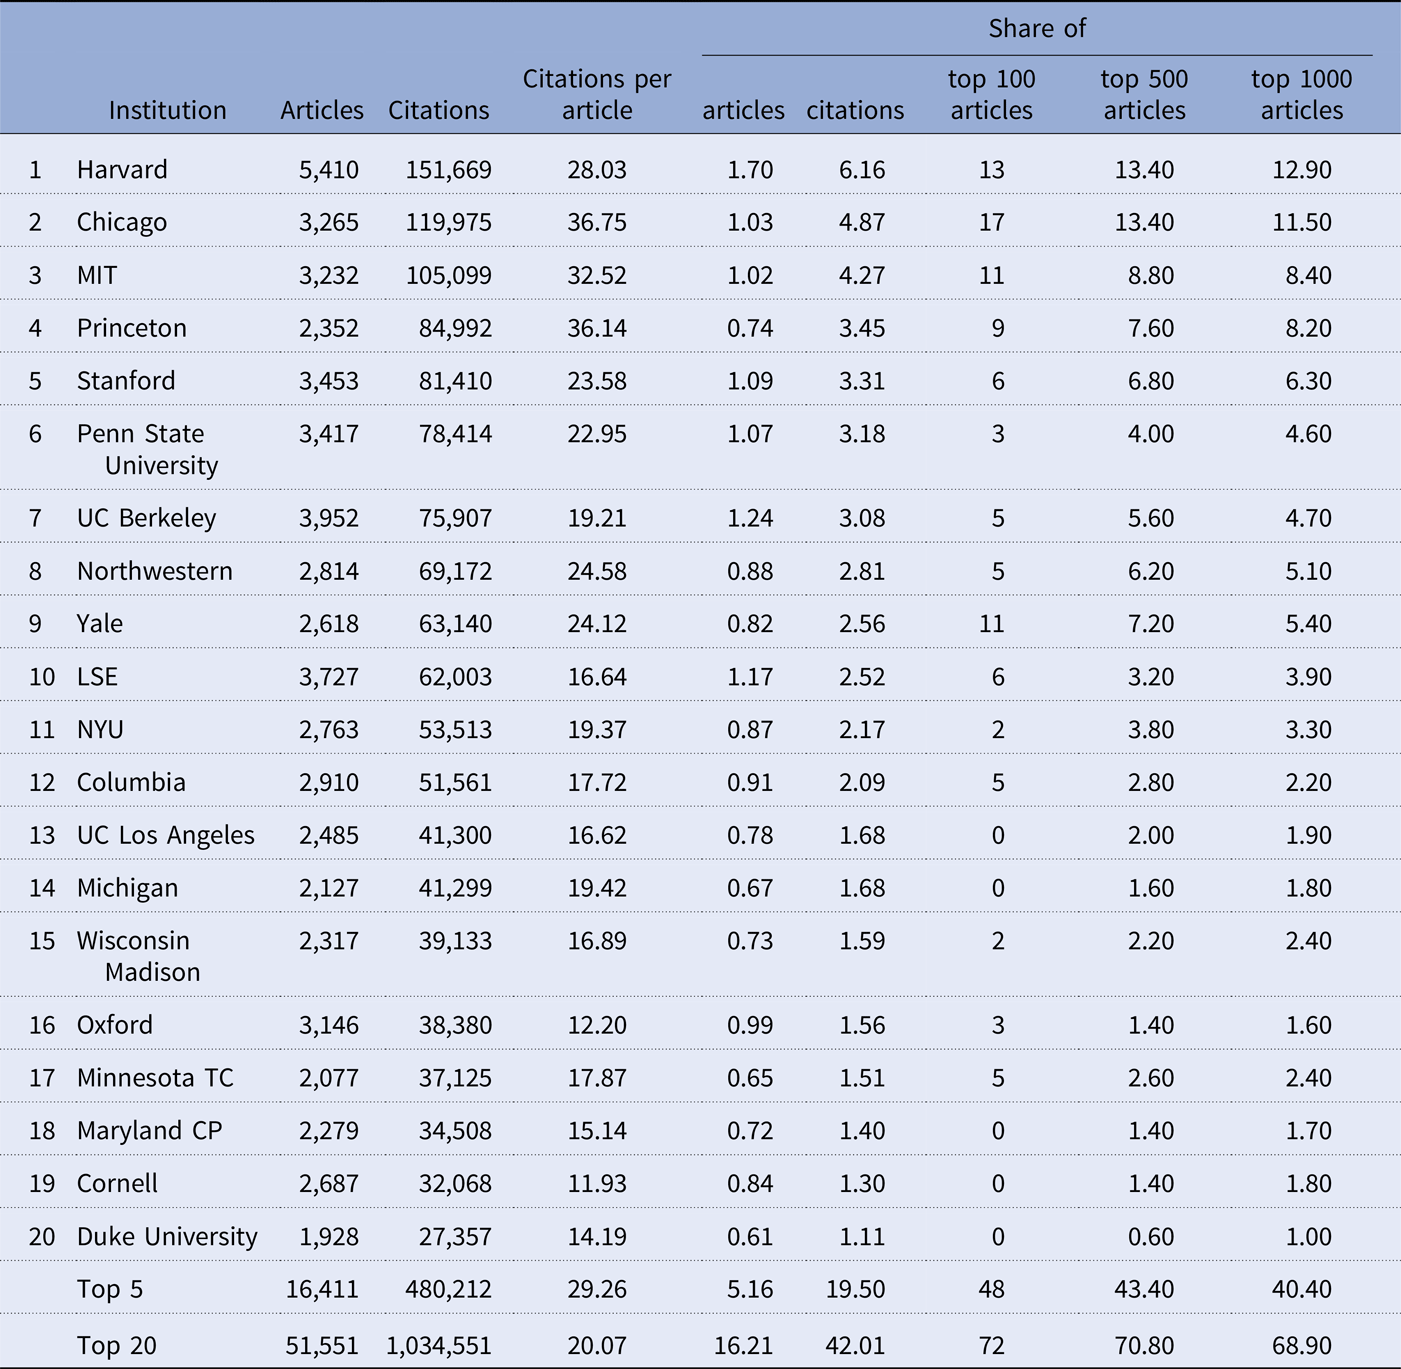
To analyze institutional concentration, we identify the top 20 economics departments based on the number of citations they received in total between 1980 and 2014. The data on institutions further adds to the picture of geographic concentration presented above, as 18 of the 20 institutions are located in the United States and two in Great Britain (LSE and Oxford). Table 4 provides an overview.
The top 20 institutions in economics, 1980–2014.

Notes. Citations per article specifies the mean number of citations an article receives. Top 100, 500, and 1000 articles refers to the most-cited articles in the data set.
The numbers indicate a high degree of concentration along the institutional dimension. The top five institutions account for over 16 thousand articles and 480 thousand citations, i.e. 19.5 percent of all citations as well as 48 of the 100 most-cited articles. Harvard University and the University of Chicago alone account for 11 percent of all citations and 30 of the 100 most-cited articles in economics. The top 20 institutions published around 52 thousand articles and received 1.04 million citations during that time period. This corresponds to 16.2 percent of all articles and 42.0 percent of all citations. Almost three quarters (72) of the 100 most-cited articles were published by authors from one of these institutions. The respective shares for the top 500 and top 1000 articles are only slightly lower. The mean number of citations per article for the top 5 (29.3) and top 20 (20.1) institutions is also significantly higher than the overall average of 7.7 for the respective sample.
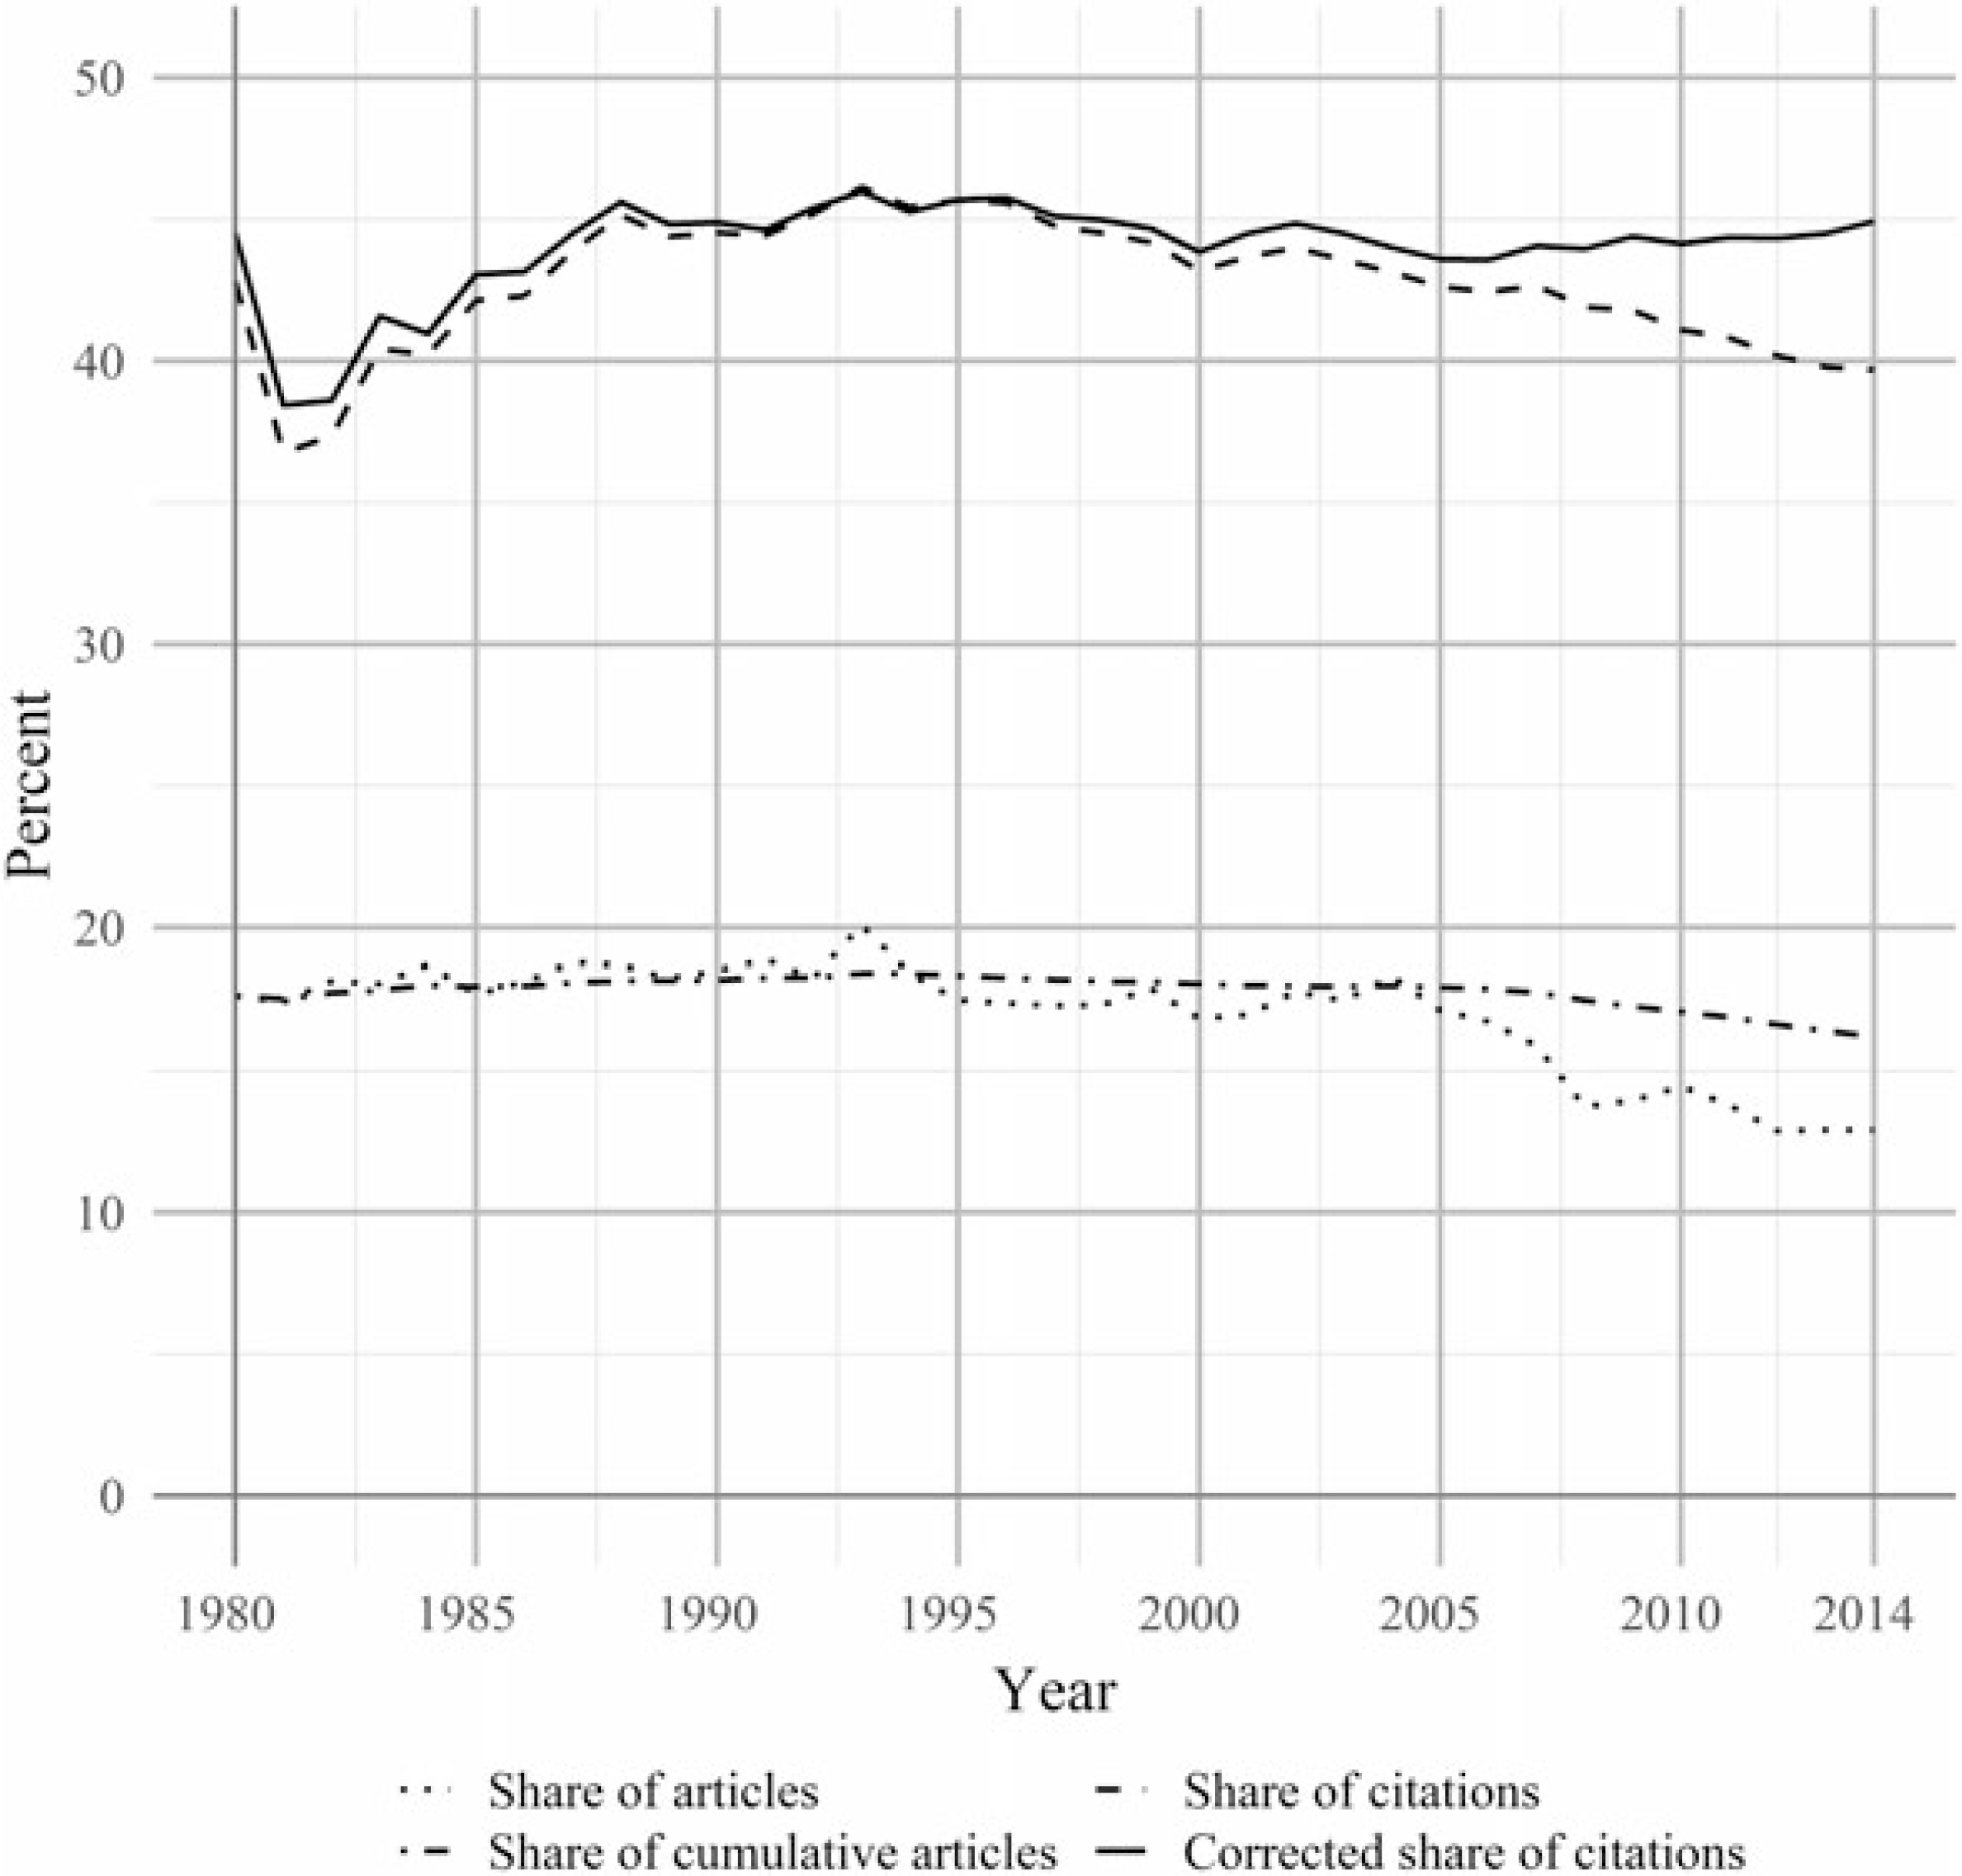
The share of citations received by these 20 top institutions increased from around 40 percent in the early 1980s to a peak of around 46 percent in 1993, as illustrated in figure 11. Since then, it has been gradually declining to around 40 percent in 2014. As is the case for the “Top Five” journals, the top 20 institutions are limited in their publication capacity. However, their yearly share of published articles (dotted line) remained relatively stable between 1980 and 2004, indicating that they grew simultaneously to the discipline as a whole. Only after 2004 their share in the cumulative articles gradually declined (dot-dashed line). Once more, correcting for this by dividing through their share in the cumulative articles, the share of citations would be stable between 2005 and 2014 (solid line, normalized to 1995).
Share of articles and citations of top-20 institutions, 1980–2014 (corrected share normalized to 1995).

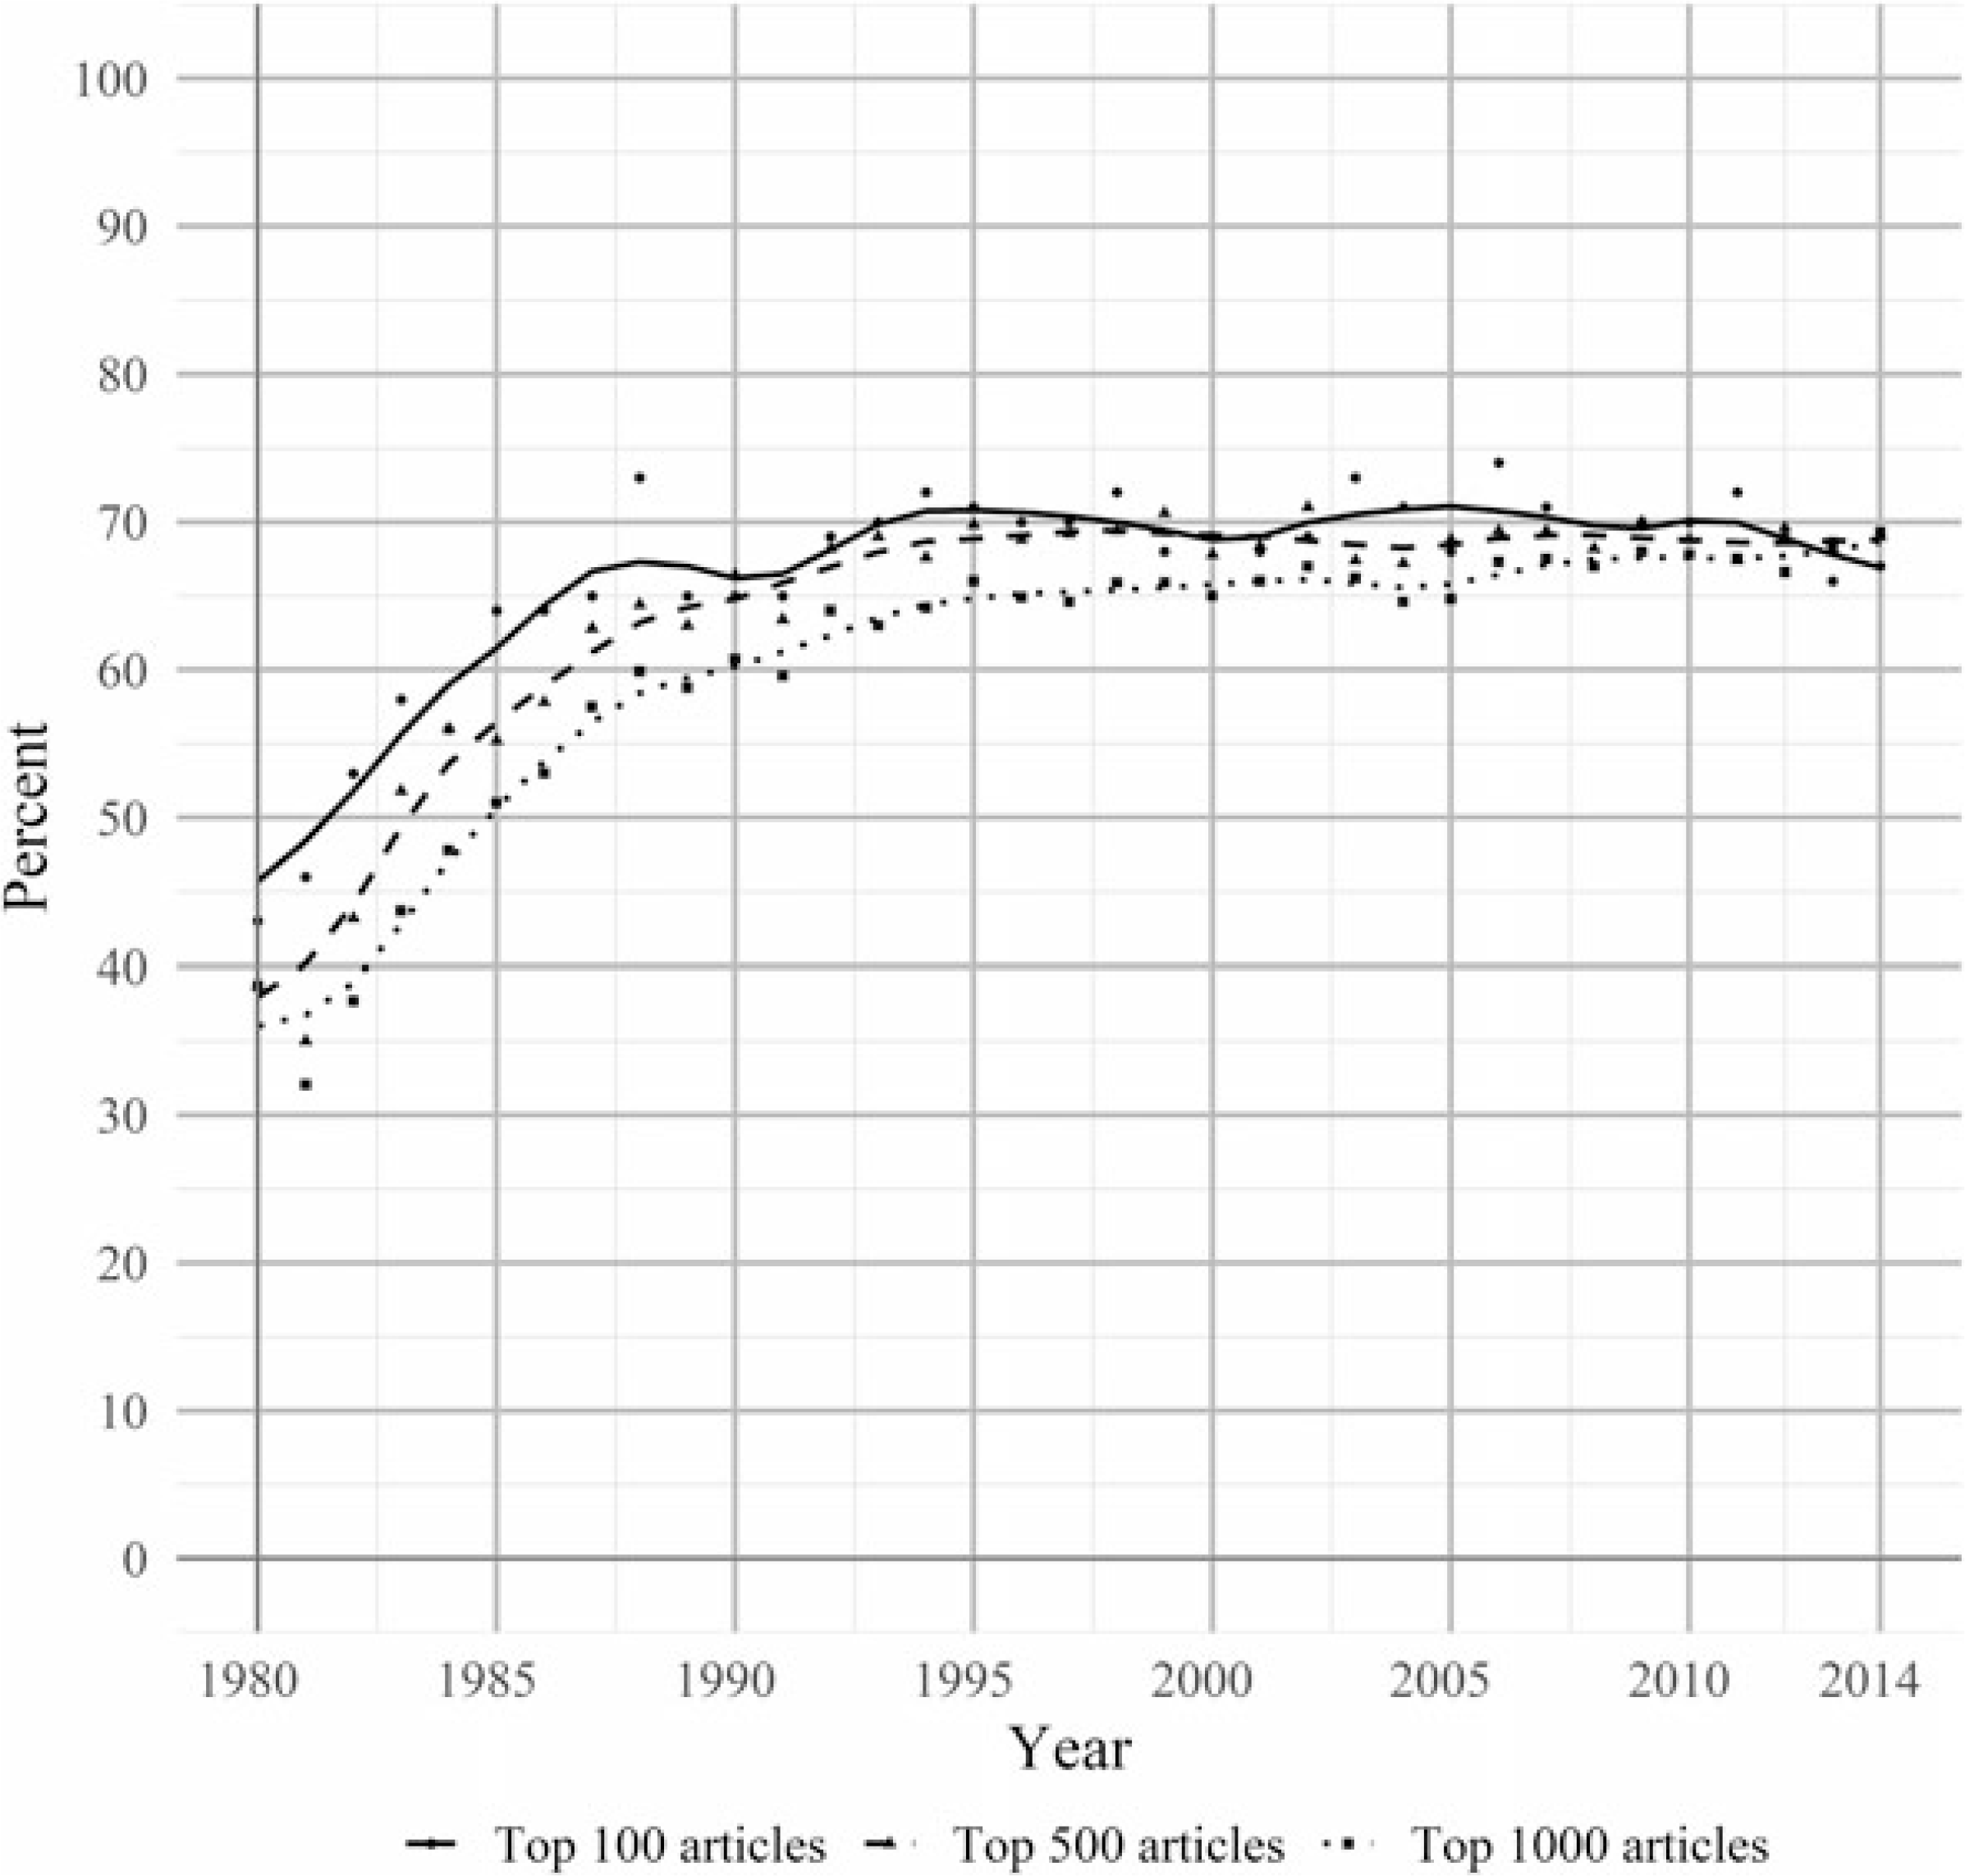
The share of articles by authors affiliated with a top 20 institution in the 100 and 500 most cited articles has followed similar dynamics (see fig. 12), increasing strongly before the mid-1990s where it reached around 70 and 69, respectively. Thereafter, it remained roughly constant. Only since 2012, the share of articles in the top 100 articles declined from 70 to 66 articles. The share of articles in the 1,000 most cited articles increased over the entire observation period from around 36 percent to 70 percent in 2016. Again, concentration is consistently higher towards the top of the discipline with the exception of the most recent years.
Share of top 20 institutions in the 100, 500, 1000 most-cited articles each year, 5-year weighted moving average, 1980–2014.

2.5 Author concentration
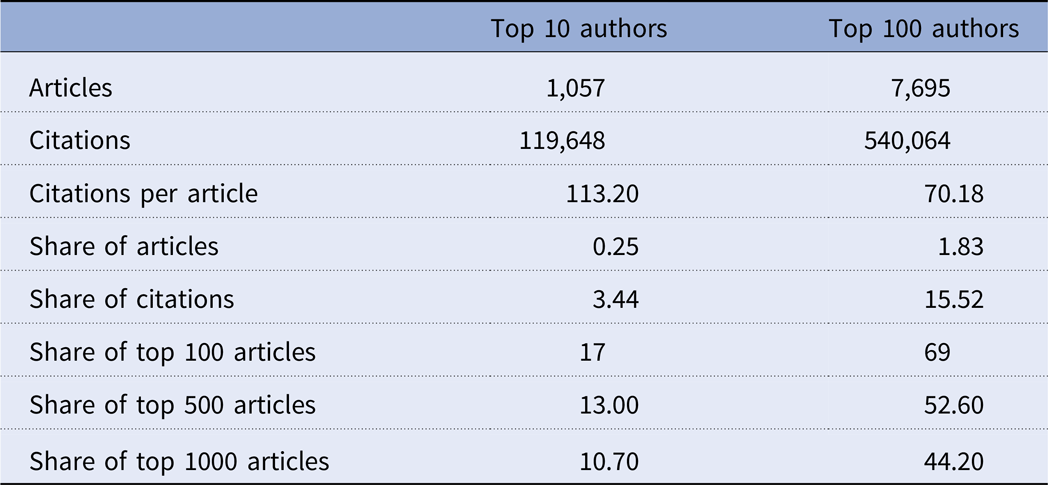
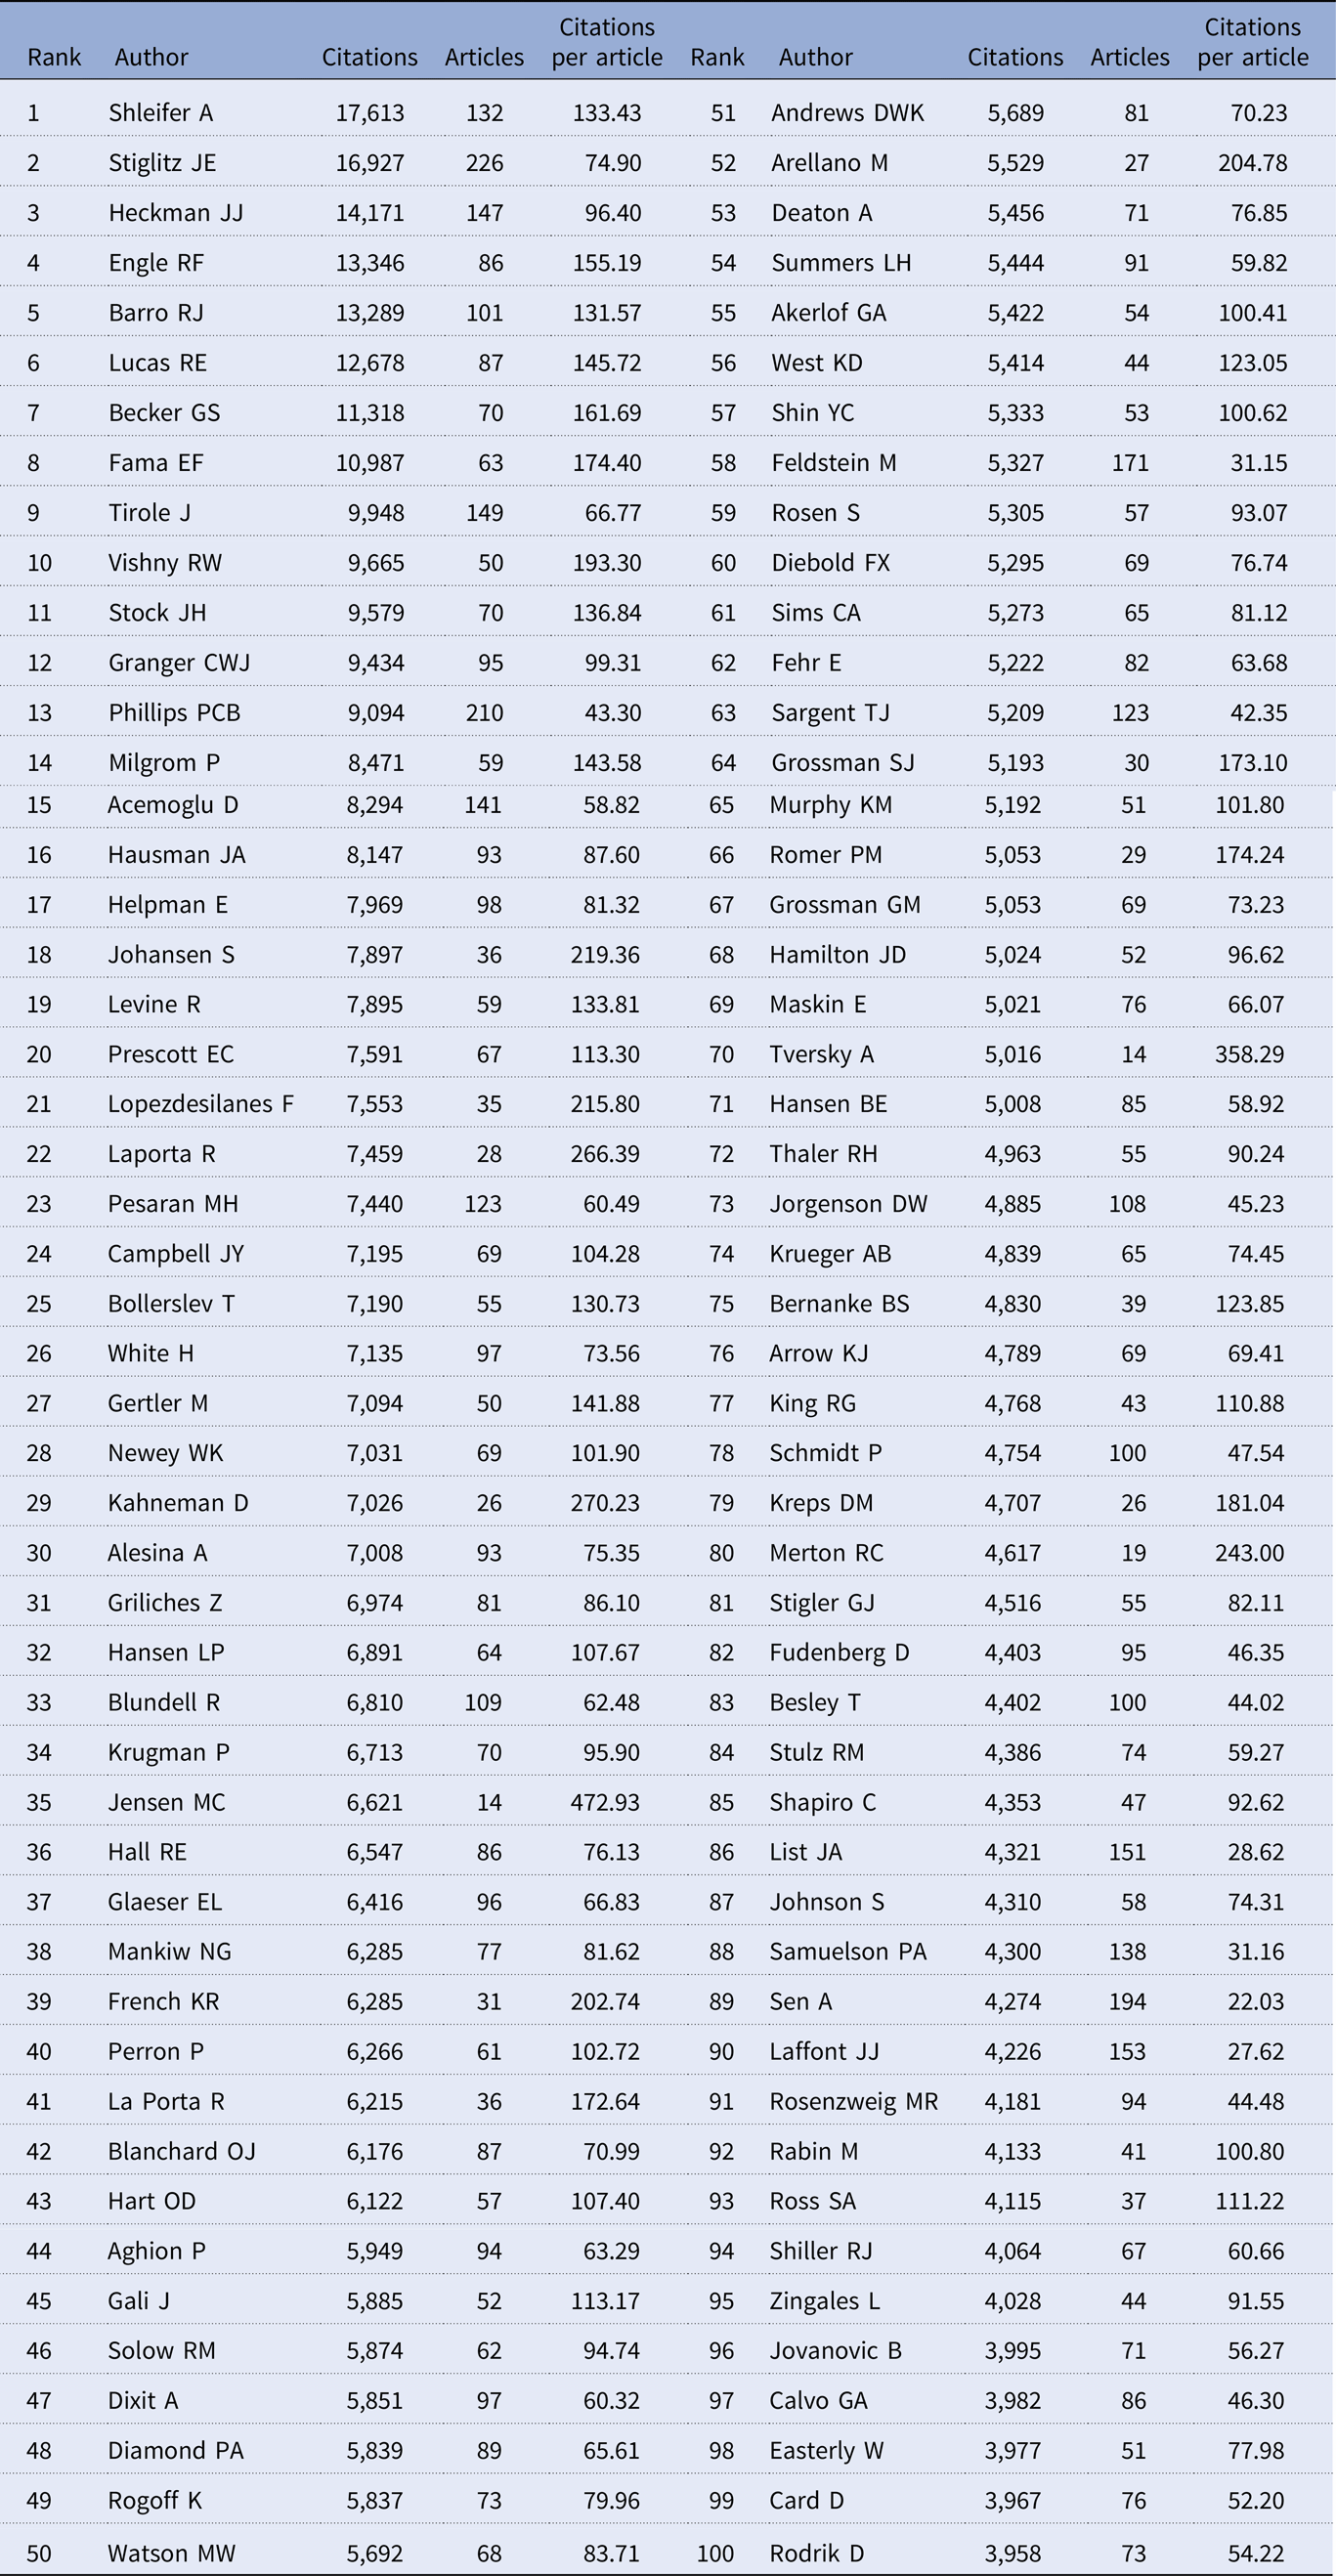
Investigating concentration on the level of authors poses a challenge, as Web of Science data only includes the last names and first name initials for most entries. Name disambiguation based purely on initials may lead to distorted results (Kim and Diesner Reference Kim and Diesner2016). One source of problems is, for instance, that an author may be included in the data set once with and once without his or her middle name initial. Therefore, we manually checked the 100 most-cited authors in order to identify cases in which an author is mistakenly included in the data with two slightly distinct names. Where it was possible to unreservedly confirm that two versions of a name referred to the same author, the data was matched accordingly. The concentration measures reported below should thus be regarded as the lower limit and may be higher in reality. Table 5 shows aggregated measures of concentration for the top 10 and top 100 authors in the data set. Measures for the individual authors can be found in table 8 in the appendix.
Overview on the top 10 and 100 authors, 1956–2016.

Notes. A full list of the 100 top authors can be found in table 8 in the appendix.
The top 10 authors alone published over a thousand articles (0.25 percent) which were cited nearly 120 thousand times, that is 3.4 percent of all citations. The top 100 authors published close to 7,700 articles (1.8 percent) which received more than half a million citations, that is 15.5 percent of all citations. The most-cited author, Andrei Shleifer, alone received 17,613 citations which corresponds to around one in every 200 citations.
On average, an article published by a top-ten author received 113.2 citations, an article published by a top-100 author received 69.5. The numbers vary between 472.9 (Michael Jensen [35]) and 22.0 (Amartya Sen [89]), the latter being only around thrice the overall mean citations per article in our data set (8.2), which is an indicator of the high productivity of top authors in terms of quantity. These top 10 and top 100 authors account for 17 and 69 percent of the top 100 articles, 13 and 52.6 percent of the top 500 articles, and 10.7 and 44.2 percent of the top 1000 articles, respectively. Once more, concentration is higher at the top of the discipline.
2.6 Paradigmatic concentration
To analyze paradigmatic concentration, the journals were coded with the Heterodox Economics Directory into a mainstream and a heterodox group. Table 6 shows the number of journals, articles and citations by each group. This overview reveals that schools of thought that diverge from the mainstream find less journals to publish in and account for only a small fraction of articles (8.1 percent) and citations (2.8 percent). On average papers in heterodox journals are cited 3.1 times compared to 9.4 times in mainstream journals. None of the 1,000 most-cited articles was published in a heterodox journal, and only 0.56 and 0.96 percent were published in the top 5000 and 10,000 respectively.
Overview on paradigms in economics, 1956–2016.

Notes.
a Refers to all journals that are in the Web of Science subject category economics but are not listed in the Heterodox Economics Directory.
b Refers to all journals that are in the Web of Science subject category economics and are listed in the Heterodox Economics Directory.
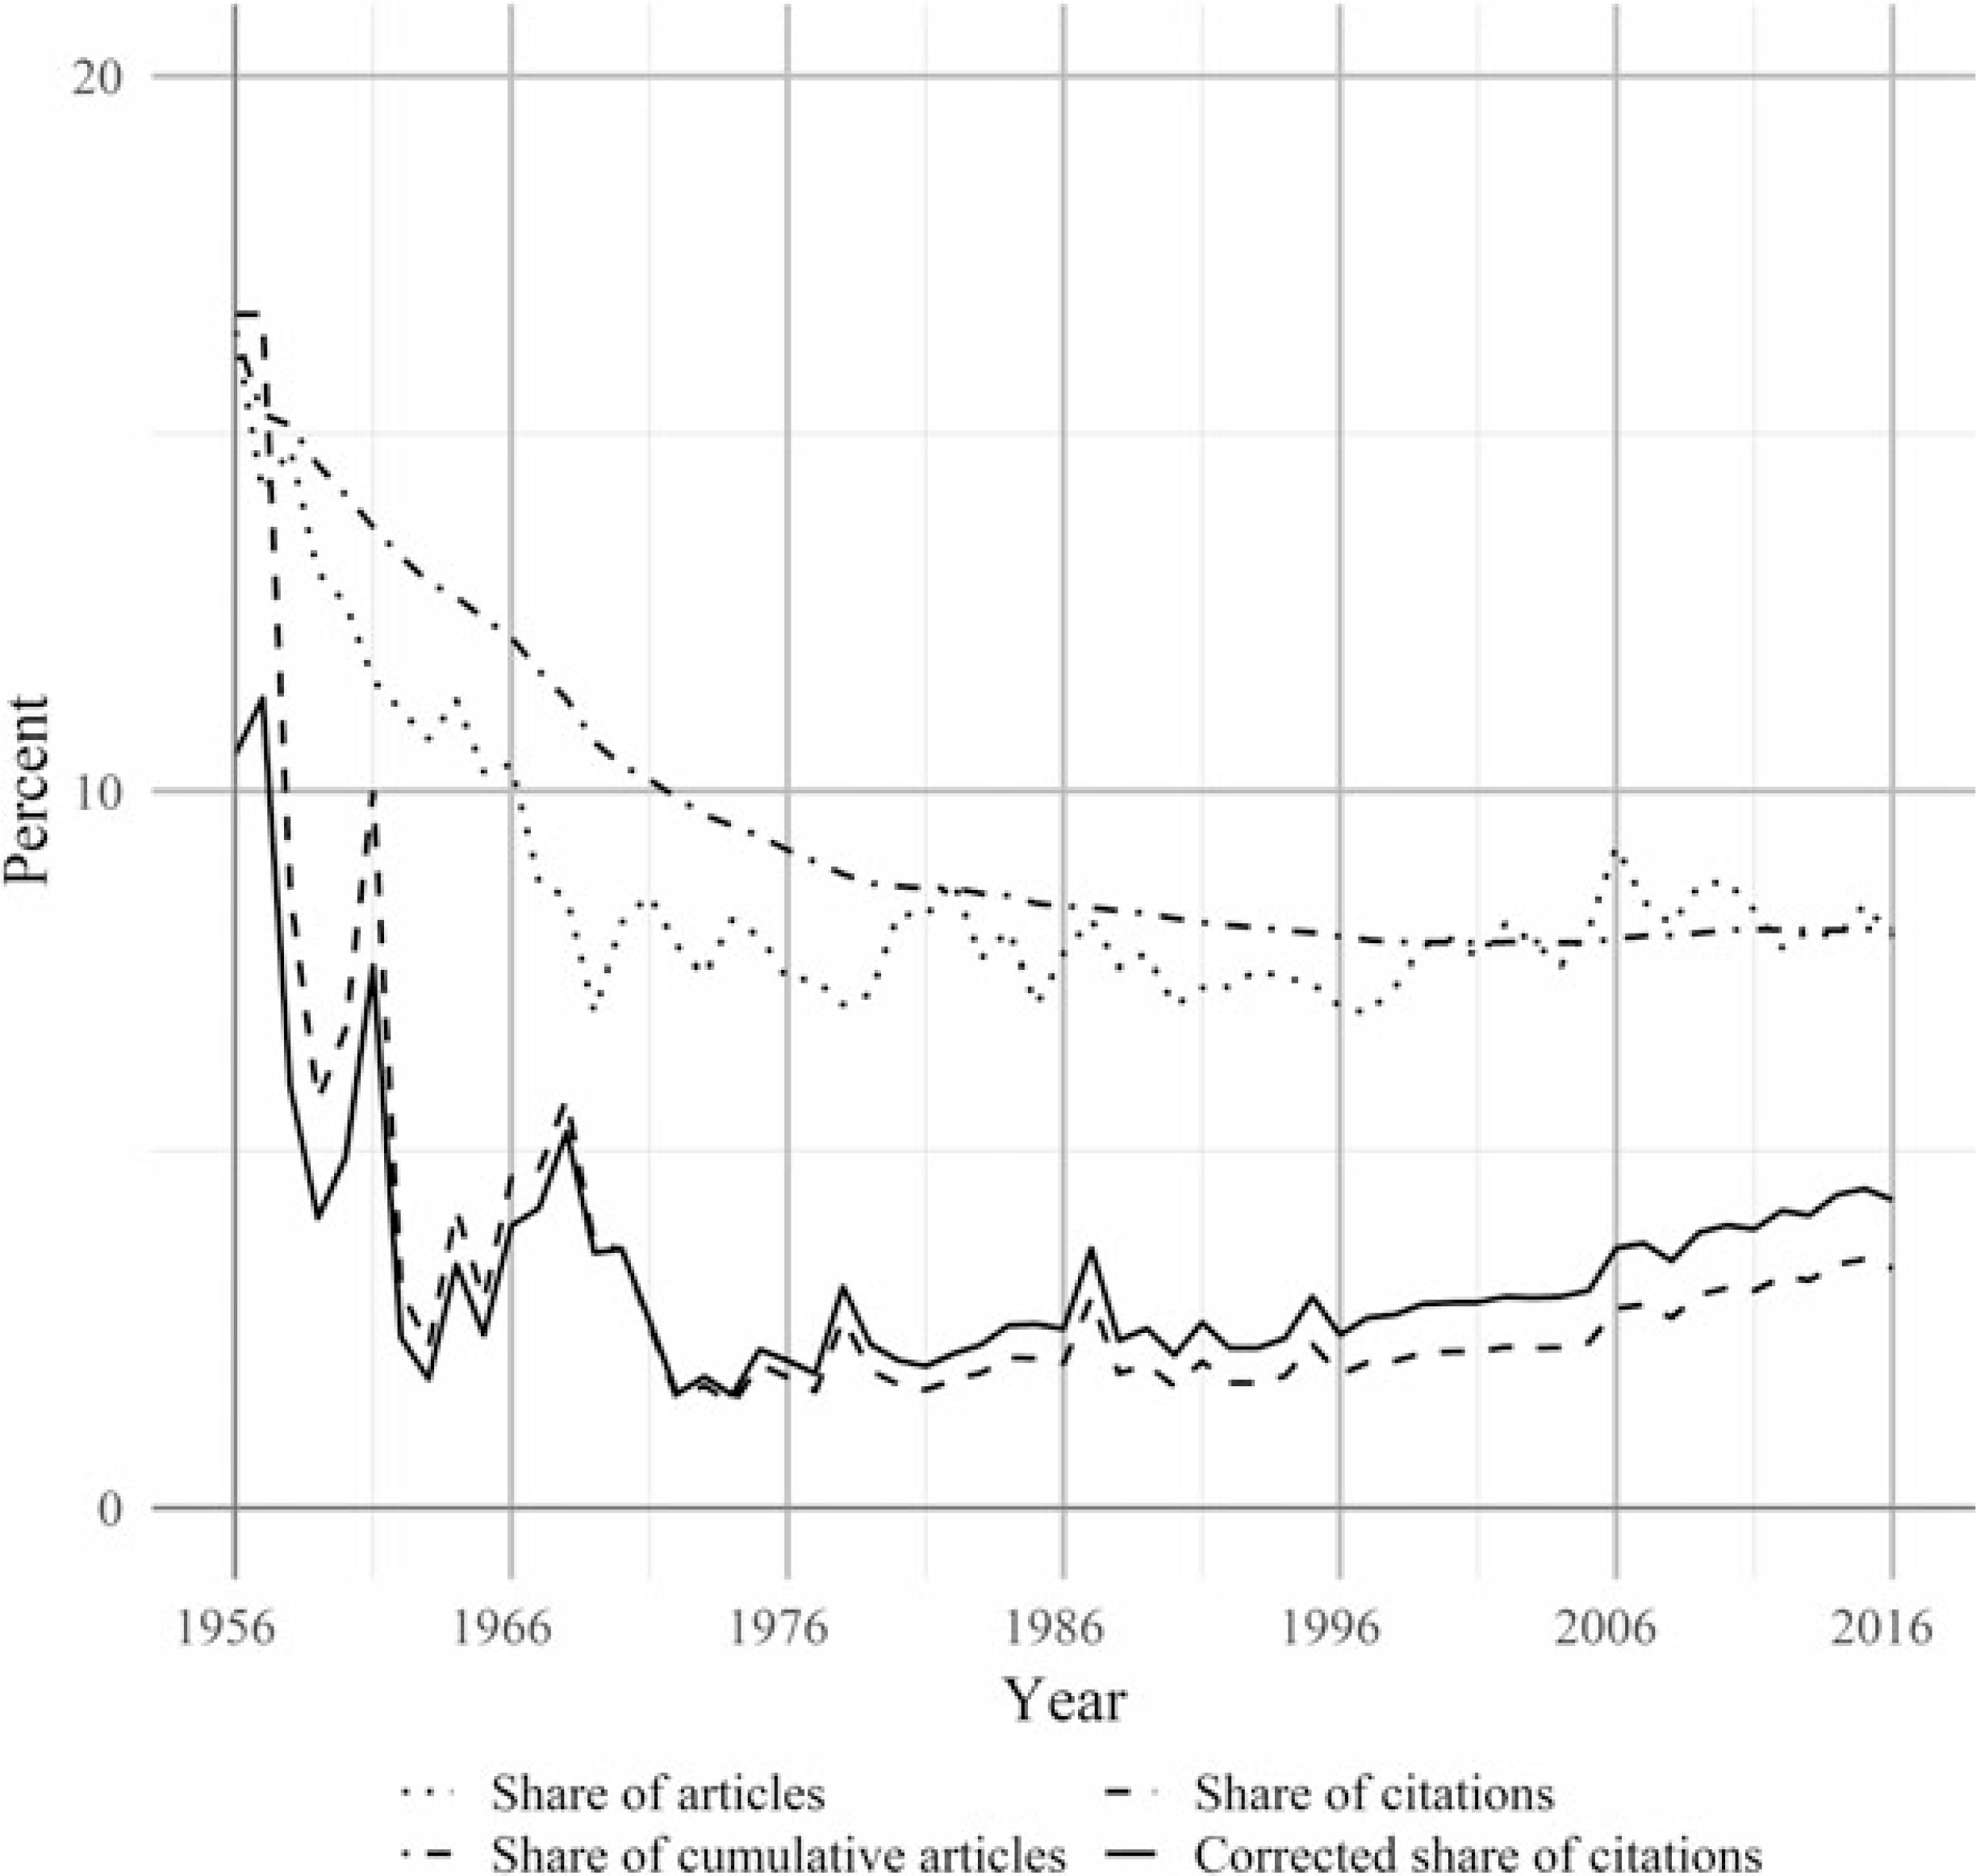
Figure 13 shows the share of articles published in heterodox journals and the share of citations these journals received each year. While heterodox schools of thought still played a significant role before the 1970s, their importance rapidly declined thereafter. The share of articles (dotted line), along with the share of cumulative articles (dot-dashed line), fell from around 16 percent to around 8 percent until 1970, where it has remained stable ever since. The share of citations (dashed line) fell steeply from the same level to around 2 percent in this time period. Only during the last decade the share rose again notably to close to 3.5 percent. Correcting for the declining share in the cumulative articles in the data set would yield a slightly stronger increasing dynamics (solid line, normalized to 1970).
Share of heterodox articles and citations, 1956–2016 (corrected share normalized to 1970).

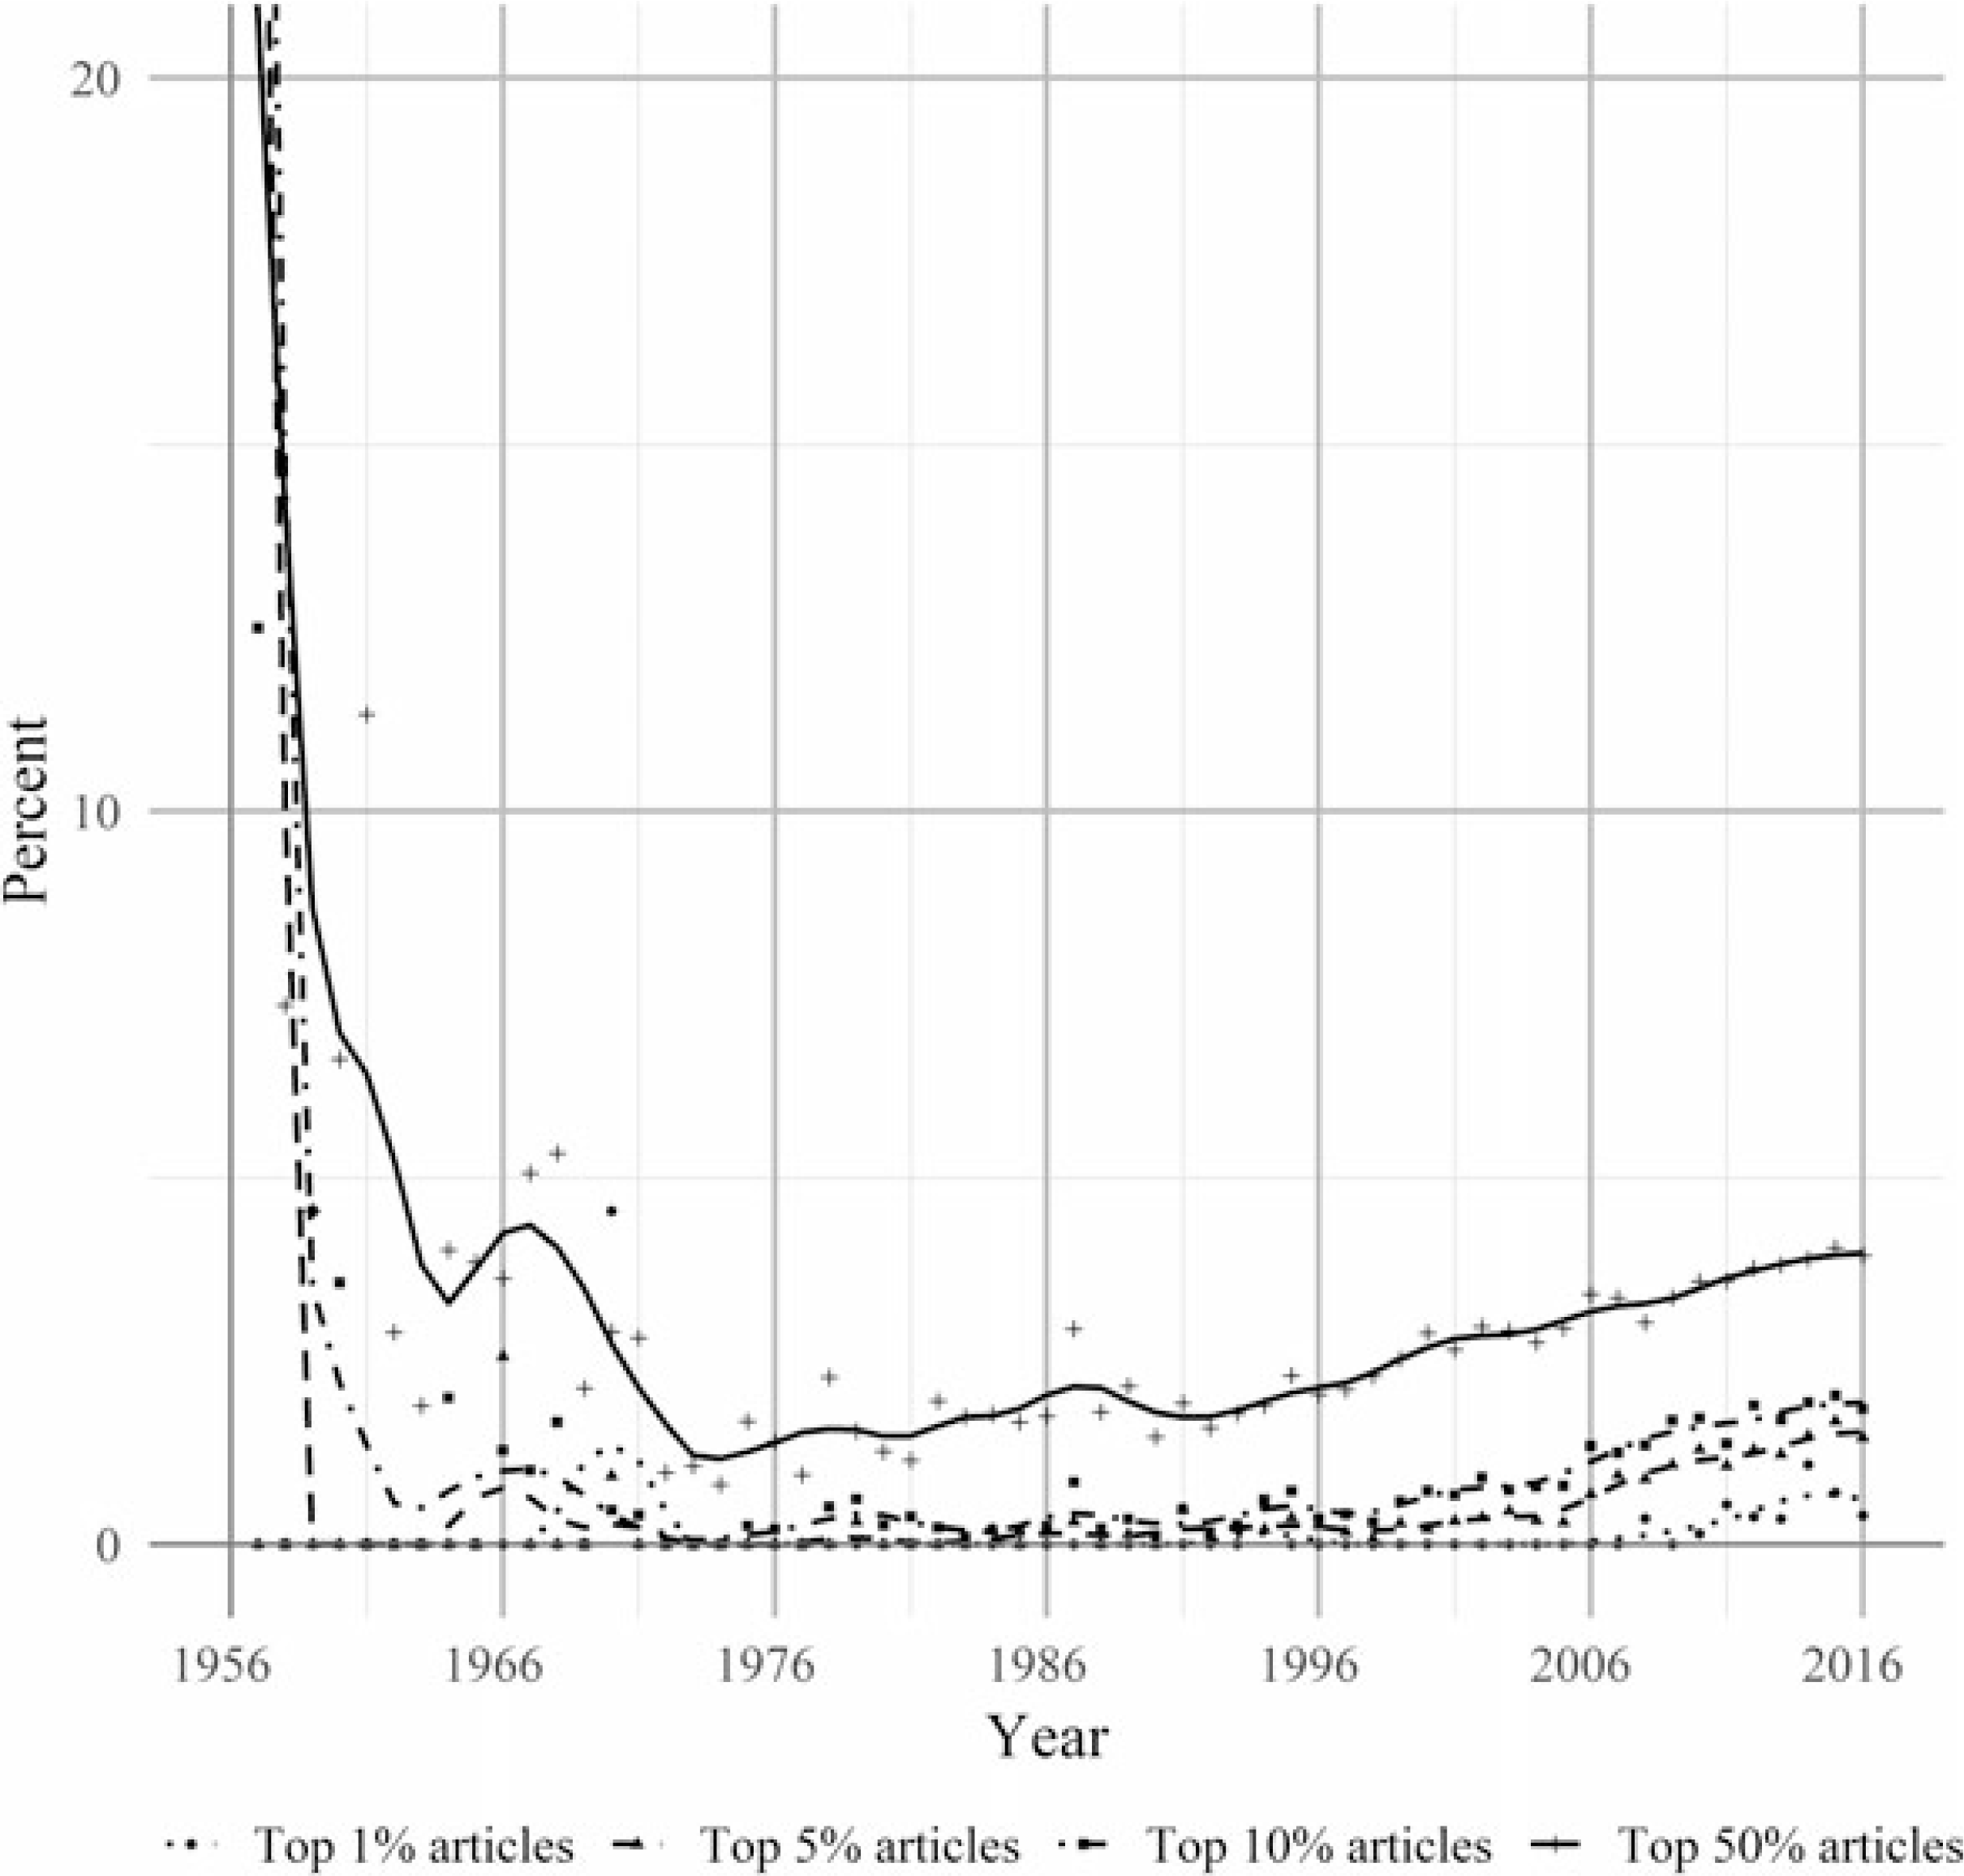
Figure 14 shows the share of heterodox articles in the top 1, 5, 10, and 50 percent of articles each year. Similarly to before, the shares sharply decreased from high levels until the 1970s. From then until the mid-1990s the share of heterodox articles was 0 percent for the top 1, 5, and 10 percent. The shares for the top 1 percent only started to increase slowly after the financial crises 2008 in 2010. In 2016 the shares reached 0.6, 1.6, 2, and 4 percent, respectively.
Share of top 1, 5, 10, and 50 percent of articles that were published in heterodox journals, 1956–2016.

3. Discussion
While previous studies have mostly focused on single aspects of concentration, this article provides a comprehensive picture by investigating six dimensions of concentration in economics: article concentration, journal concentration, geographic concentration, institutional concentration, author concentration, and paradigmatic concentration. Moreover, by investigating a large-scale data set covering all articles published in economics journals listed in the Web of Science over the last six decades, this study allows us to discuss trends and draw conclusions for the discipline as a whole. Some general features may be inferred.
Economics is strongly concentrated along all investigated dimensions. The overall distribution of citations to articles is very unequal with a corresponding Gini of 0.82 (when only considering articles that were cited at least once it is still 0.71). The results showed that 35.9 percent of all articles received 0 citations, which is higher than the rate of “dry holes” found by Laband and Tollison (Reference Laband and Tollison2003) of around a quarter (though it needs to be noted that our analysis only includes intra-economics citations). On the journal level the concentration is still more pronounced and the “Top Five” journals out of 433 alone account for 28.5 percent of all citations and 71 of the 100 most-cited articles. North America dominates the discourse in economics with around half of all articles authored and three quarters of all citations received over the entire observation period. Western Europe accounts for around 29 percent of articles and almost a quarter of citations. All other regions in our analysis play a minor role. Also institutional and author concentration are substantial. Out of 4,337 academic institutions listed in Thomson Reuter’s InCites, the top 20 alone author 16.2 percent of all articles and receive 42 percent of all citations, confirming tendencies found by other authors (see e.g. Kocher and Sutter Reference Kocher and Sutter2001; Hodgson and Rothman Reference Hodgson and Rothman1999; and Fourcade et al. Reference Fourcade, Ollion and Algan2015). The 10 and 100 most-cited authors received around 120 thousand and 540 thousand citations, corresponding to 3.4 and 15.5 percent of all citations, respectively. Finally, economics is also paradigmatically concentrated. Heterodox economics accounts for only 40 of 344 journals, 8 percent of articles, 2.8 percent of citations and not a single one of the 1,000 most-cited articles.
Concentration on the level of citations tends to be more pronounced and more persistent compared to the article level. While both the share of articles and the share of citations are concentrated along the six dimensions, the share of citations tends to be higher in each of the dimensions. The particularly strong concentration in terms of the share of citations is due to the fact that those journals, regions, institutions, authors, or paradigms that account for a larger share of articles also have a higher mean number of citations per article. For instance, on the level of geographic concentration, North America’s share of citations fell significantly less than its share of all articles.
Concentration tends to increase towards the top of the discipline. For example, the share of the “Top Five” journals, top 20 institutions, or top 100 authors is higher in the 100 most-cited articles than in the 500, or 1,000 most-cited articles. One possible explanation for this may be the Matthew effect, that academic recognition in the form of citations and prestige are mutually reinforcing (Merton Reference Merton1968; Tol Reference Tol2013), though Birkmaier and Wohlrabe (Reference Birkmaier and Wohlrabe2014)’s results on the author level suggest that the Matthew effect may in fact wear of with an increasing number of citations.
The strongest increases in concentration occurred before the 1970s. Both on the level of articles and journals the Gini coefficient increased markedly until the 1970s, followed by a long period with slower increases in the Gini coefficients. Between 2006 and 2007 the coefficients rose significantly again, concurrently to the pronounced increase in the number of articles in the data set. Also the share of citations reaped by the top 1, 5, 10, and 50 percent of articles has been steadily increasing throughout the observation period. These dynamics differ from the results of Larivière et al. (Reference Larivière, Gingras and Archambault2009) for the natural sciences and engineering, medical fields, social sciences, and the humanities as a whole, who found decreasing concentration across disciplines between 1990 and 2007.
On the level of geographic concentration, North America’s shares of articles and citations have declined since the 1990s, mostly in favor of Western Europe and to lesser extent Asia. This is in line with the results of Coupé (Reference Coupé2003) and Sutter and Kocher (Reference Sutter and Kocher2001) who find rising shares of (continental) European authors starting in the 1990s for a selection of journals. It may further be considered a trend reversal to Kalaitzidakis et al. (Reference Kalaitzidakis, Mamuneas and Stengos1999), who find no evidence of an increase in articles published by European authors between 1971 and 1994. The shares of articles and citations of all other regions remain low - recent trends indicate only slow change.
Also the temporal dynamics of paradigmatic concentration are insightful. Both the overall share of heterodox articles and the share of heterodox articles in the most-cited papers plummeted before the early 1970s. The share of citations fell by around 15 percent during this period. In the following decades, heterodox economics was largely disregarded, receiving only around 2 percent of citations and accounting for nearly none of the 1, 5, or 10 most-cited percent of articles. This is consistent with the analysis that the importance of heterodox schools of thought decreased until the 1970s (Lee Reference Lee2004; Stockhammer and Ramskogler Reference Stockhammer, Ramskogler, Frederic and Lavoie2012). After 30 years during which little changed in the position of heterodox economics, there is a small upward trend in the share of citations during the last decade. Also the share of heterodox articles at the top of the discipline increased gradually. After the financial crisis there are heterodox articles among the top 1 percent for the first time in decades. While this does suggest that the crisis did have an impact on academic economics, the results of Aigner et al. (Reference Aigner, Aisleitner, Glötzl and Kapeller2018) indicate that this impact was rather temporary and did not entail a substantial paradigmatic shift.
Despite the growth of the discipline, the influence of a fixed number of top journals and institutions remains remarkably stable. The number of journals in the data set increased from 35 in 1956 to 384 in 2016. Yet, the share of articles from the “Top Five” in the 100 most-cited articles each year has remained stable over time. The decreasing share of citations received by these journals may be attributed to their declining share in the cumulative articles in the data set. When correcting for this, the share increased steadily over the last 30 years. Similarly, despite a rising number of institutions up to 4,337, the share of citations going to the top twenty institutions only fell by 5 percent over the last 25 years, and when correcting for the increasing number of articles it indeed remained on its high level. The share of top 20 institutions in the 1000 most-cited articles each year has increased from 60 percent to 70 percent during the same time period. Only since 2012 did their share of articles in the top 100 articles decline from 70 to 66 articles. One source of this institutional concentration may be the fact that personal ties between authors and editors increase the chance of publication (Laband and Piette Reference Laband and Piette1994; Medoff Reference Medoff2003). While Laband and Piette (Reference Laband and Piette1994) as well as Medoff (Reference Medoff2003) suggest that this “favoritism” does not necessarily lead to the publication of lower quality articles, Hodgson and Rothman (Reference Hodgson and Rothman1999) worry that this situation might be a barrier for innovative research in economics. At least in part, concentration on the institutional level may, however, also be the result of a process of self-selection, where the best authors join the best and most reputable departments. In turn these departments will enjoy an even better reputation and attract more top-tier authors and so forth.
This article presents aggregate results for concentration in economics along six dimensions. Interactions between these dimensions have thus far not been investigated. The general feature that concentration increases towards the top of the discipline suggests that concentration may be even higher at the intersections of the dimensions. Furthermore, the contributions of each of these dimensions to the stratification of the discipline may be analyzed and a dynamic perspective on the author concentration could be added to this research. Also switching the perspective by investigating the citation behavior and patterns of particular journals, regions, institutions, authors, and paradigms seems promising for understanding the underlying dynamics that lead to the concentration of economics. Finally, using social network analysis and applying text-mining methods to the keywords and abstracts of the articles may allow further insights into the structure of the discipline.
4. Conclusion
The constitution of economics as a discipline has been much debated over the last few decades. The failure of economics to predict the financial and economic crisis has further fueled this discussion (Colander Reference Colander2011). In this debate, concentration of the discipline is key, as it may lead to an intellectual “lock-in”, where an elite within economics, consisting of a limited number of journals, regions, institutions, authors, or countries, may shield it from new approaches and ideas (Hodgson and Rothman Reference Hodgson and Rothman1999). The dominant position of such an elite is reinforced by path-dependencies and network effects (Sterman and Wittenberg Reference Sterman and Wittenberg1999; Merton Reference Merton1968). For instance, following unwritten rules and codes (Fourcade et al. Reference Fourcade, Ollion and Algan2015) or adhering to the dominant paradigm may often be essential for publication in certain journals, for obtaining tenure, or for earning research funds (Kapeller Reference Kapeller2010).
Moreover, not only may concentration lead to intellectual “lock-in”, but economics may also be “locked in concentration”, as “economists … tend to see institutionalized hierarchies as emergent, truthful indicators of some underlying worth, and consequently are obsessed with them” (Fourcade et al. Reference Fourcade, Ollion and Algan2015, 98). The fact that there is more data and research about rankings in economics than in all other social sciences may indicate that economists may be equating concentration with quality (Fourcade et al. Reference Fourcade, Ollion and Algan2015).Footnote 9 These rankings based on citation metrics may not effectively measure the quality of the research (Frey and Rost Reference Frey and Rost2010; Laband Reference Laband2013) and may further act as an amplifier of existing modes of hierarchy formation (Dobusch and Kapeller Reference Dobusch and Kapeller2009). They can produce an incentive structure in which economists, who place high value on the impact of a journal within the economics profession (Liebowitz and Palmer Reference Liebowitz and Palmer1984), may be deterred from publishing on critical issues that are considered to lie outside of the core of the discipline such as climate change or health (Hudson Reference Hudson2013).
This study provides a quantitative overview on the level and dynamics of concentration in economics along six dimensions. The results indicate that the discipline is highly concentrated and that concentration has been increasing over the last six decades. Recent trends do not prompt the conclusion that these overall dynamics will soon reverse, though concentration has stopped increasing or even slightly declined along some dimensions. The danger this persistent concentration entails for discipline’s ability to change and to embrace alternative approaches and innovation was pointedly summarized by George Akerlof (Reference Akerlof2017) in his recent panel address at the 2017 ASSA conference:
“What I am worried about most of all is what we don’t see. So, I am worried about the analysis that is never seen, that never becomes a paper. And it doesn’t become a paper, because it can’t become a paper. And it can’t become a paper, because that’s not what a paper in economics is all about.” (Akerlof Reference Akerlof2017)
Acknowledgments
We are grateful for financial support from the Forschungsinstitut für Gesellschaftliche Weiterentwicklung (Research Institute for Societal Development).
Appendix
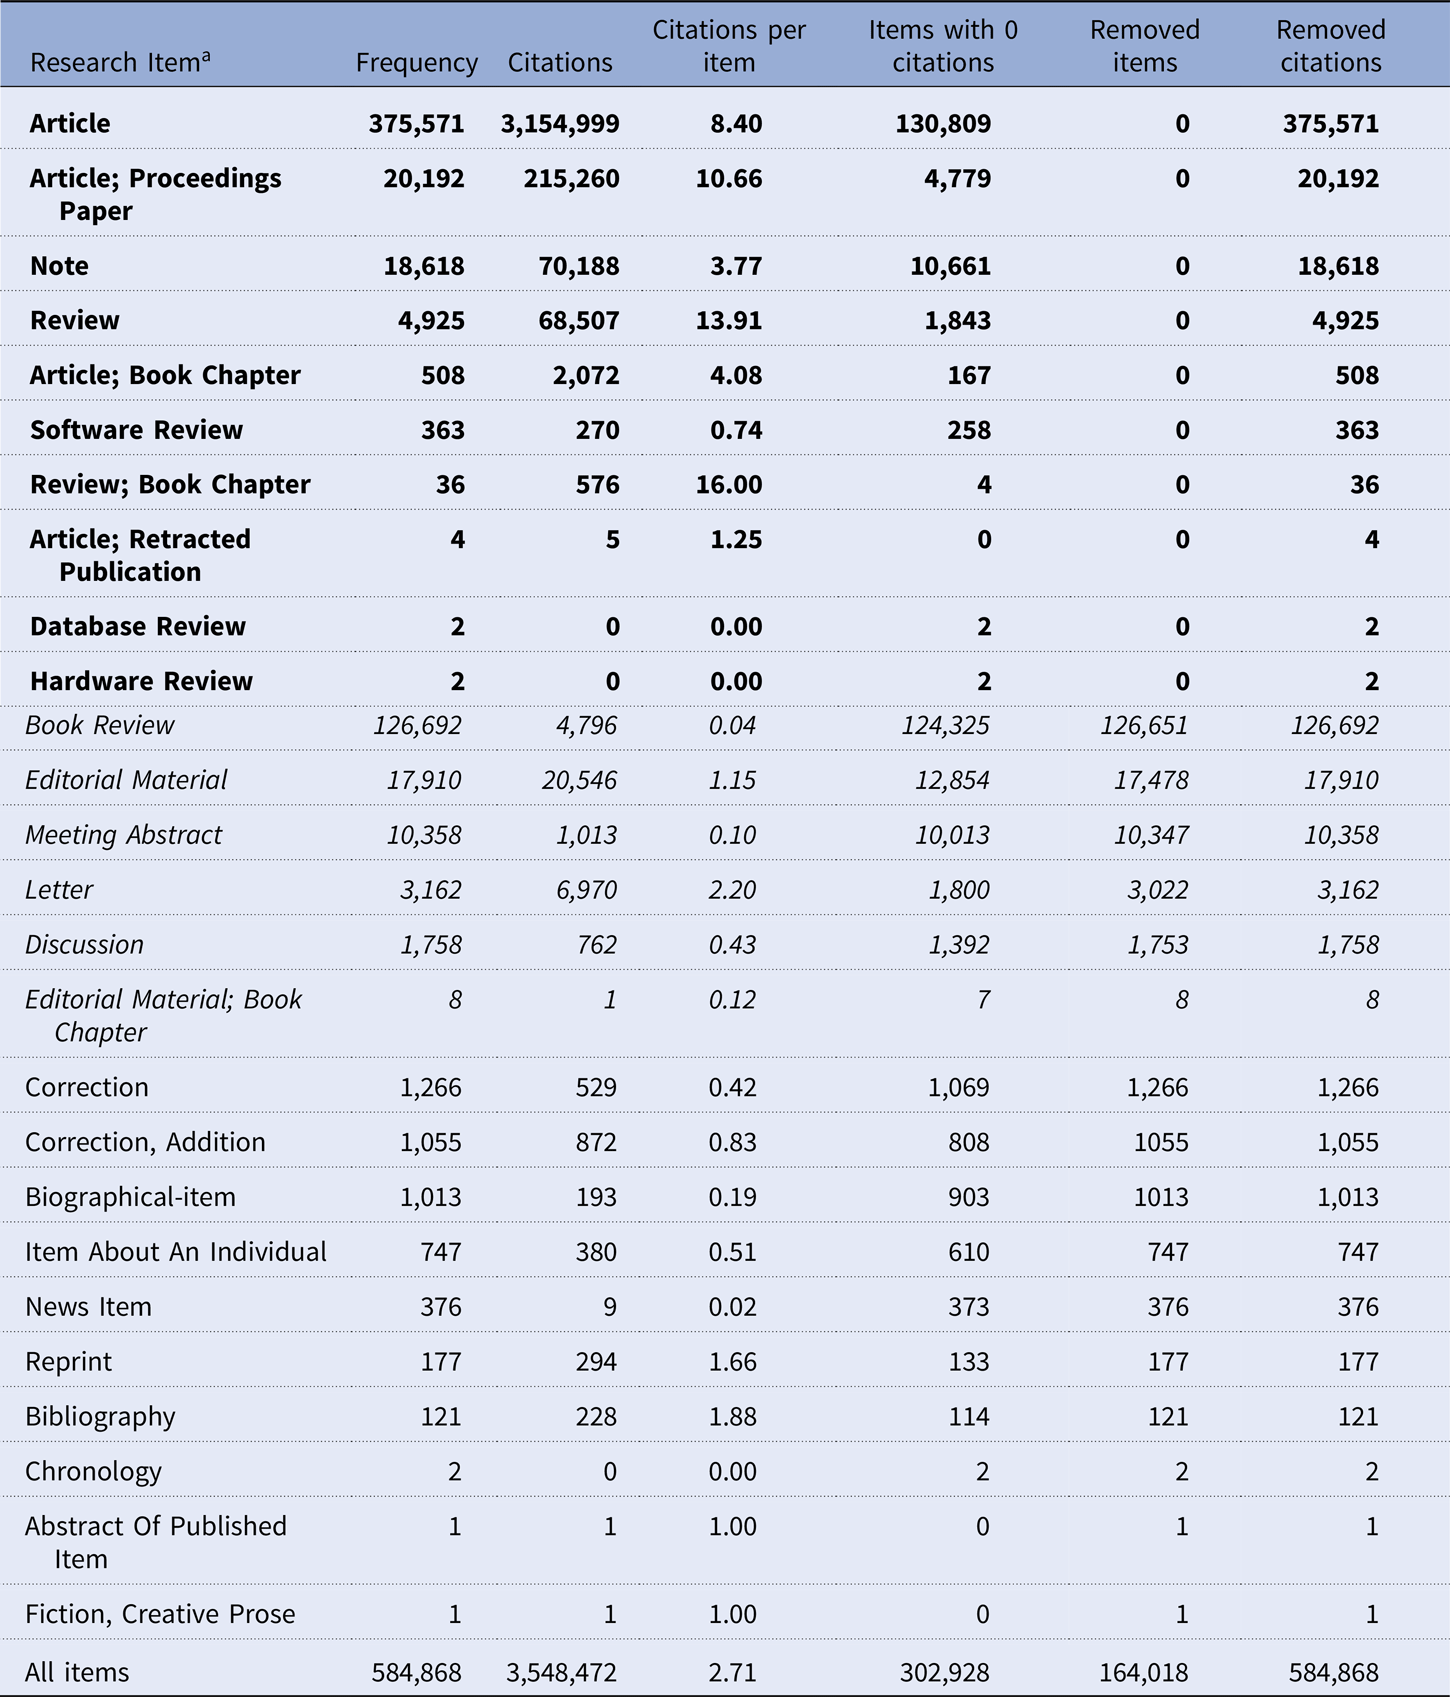
Overview on research items.

Notes.
Top 100 Authors, 1956–2016.

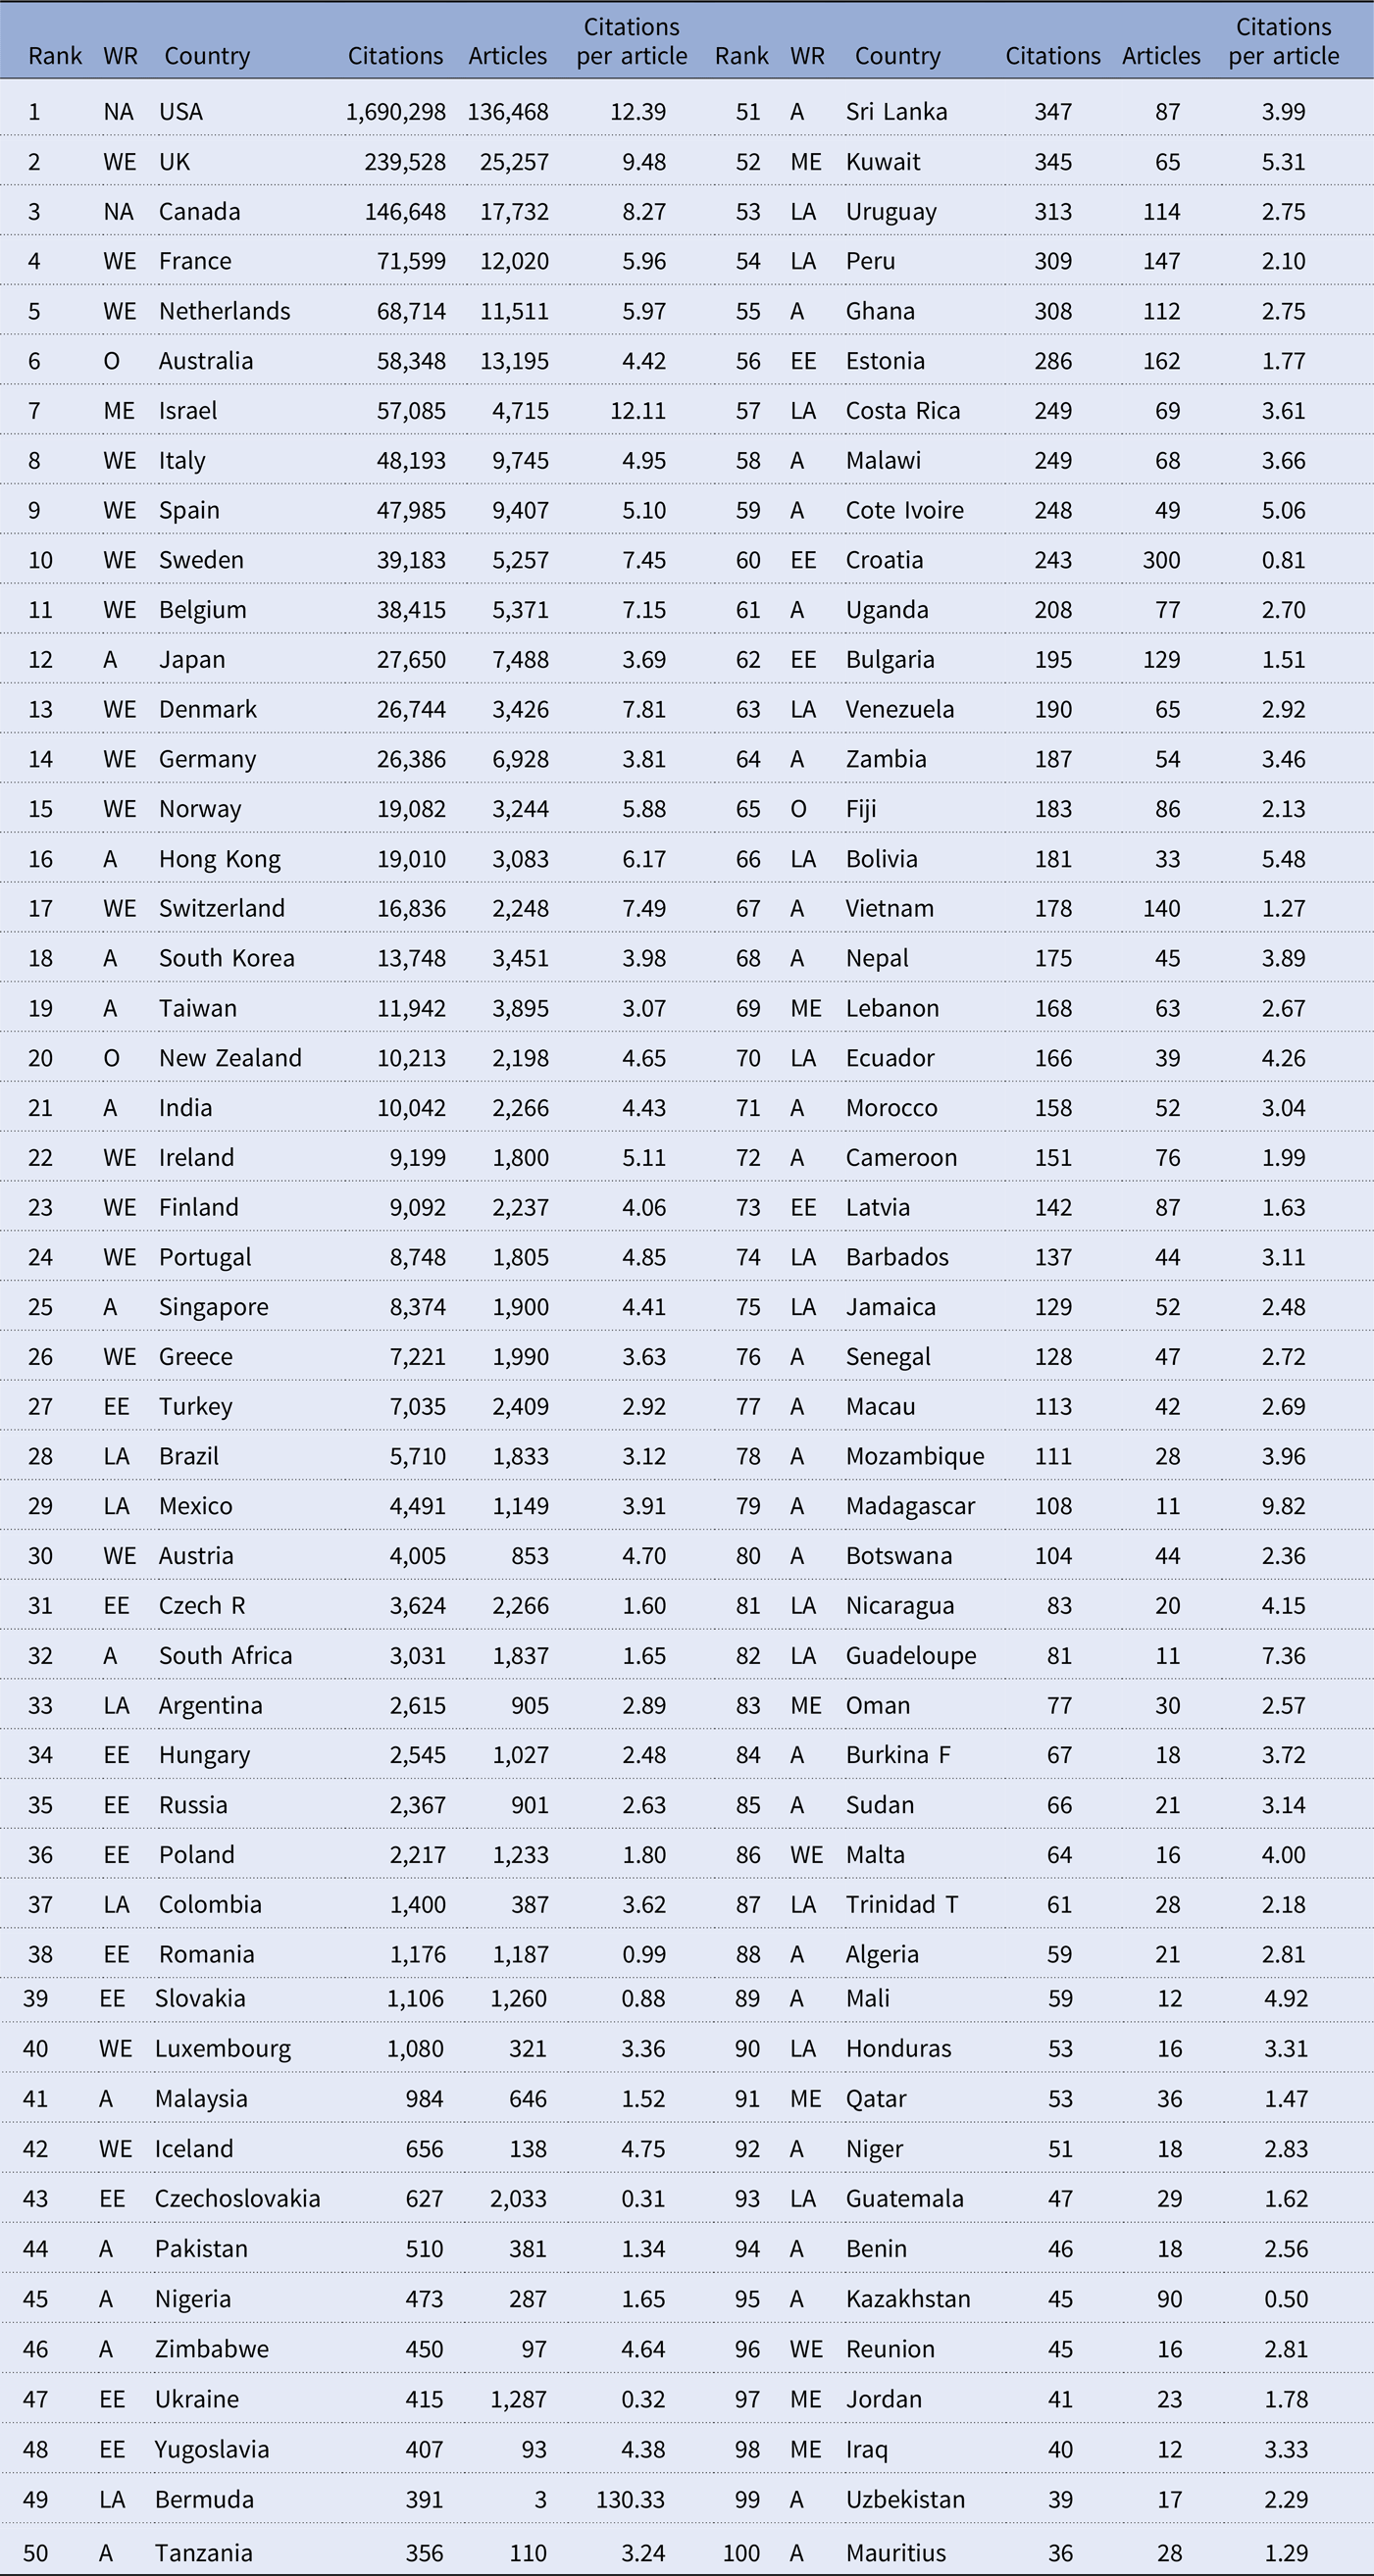
Top 100 Countries, 1980–2014.

Notes. WR: World Region, NA: North America, WE: Western Europe, O: Oceania, ME: Middle East, AS: Asia, EE: Eastern Europe, LA:Latin America, AF: Africa.
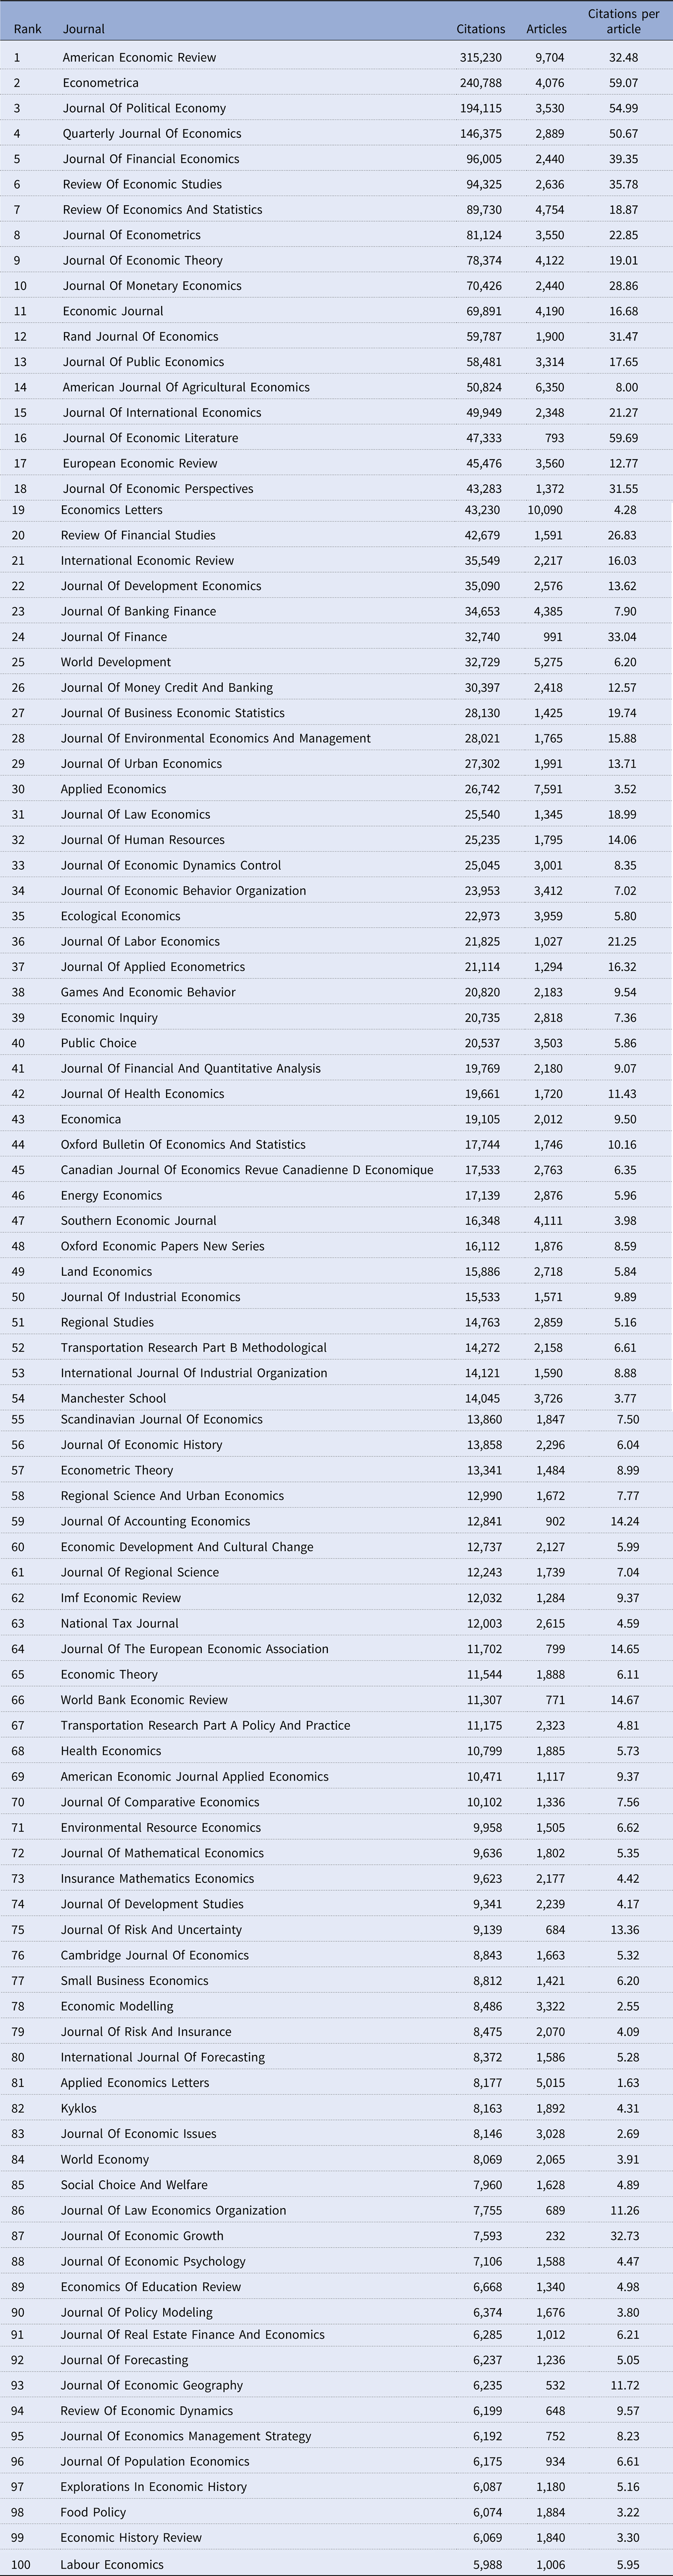
Top 100 Journals, 1956–2016.

Florentin Glötzl holds a PhD in economics and has worked as a research and teaching associate at the Department for Socioeconomics of the Vienna University of Economics and Business. His research focuses on sectoral lending and borrowing flows in Europe before and after the crisis, the role of debt and deleveraging in European economic policy as well as on bibliometric analyses of economics as a discipline.
Ernest Aigner is a PhD candidate in socioeconomics at the Institute for Ecological Economics, in the Department for Socioeconomics of the Vienna University of Economics and Business. His research focuses on the bibliometric analysis of pluralism in the economic discipline, the political economy of money, and the ecological economics of work.