



1. Introduction
Supersonic flows in curved configurations constitute a critical class of engineering flow phenomena, characterised by three dominant physical features: circumferential confinement, strong flow compressibility and centrifugal effects, which collectively result in secondary motions of multiple types (Chen et al. Reference Chen, Liang, Yang, Sun, Long, Li, Wang, Xiong and Wang2024, Reference Chen, Yang, Long, Tang, Dapeng, Wang, Sun and Yang2025a ). Such flows can be encountered in propulsion systems of high-speed vehicles (Xiong et al. Reference Xiong, Sun, Yu, Hu, Yang, Wang and Wang2022; Tang et al. Reference Tang, Sun, Yan, Wang, Yu, Huang, Wang and Zhu2024), advanced power cycles (Wei et al. Reference Wei, Yang, Yang, Wang, Shi, Song and Ma2026) and high-speed transport pipelines (Shoghl et al. Reference Shoghl, Naderifar, Farhadi and Pazuki2022), and are often laden with dispersed phase particles, such as fuel droplets in scramjet fuel systems (Zhou et al. Reference Zhou, Cai, Li, Li, Sun, Li and Wang2023) or ablative particles in rocket nozzles (Zhang et al. Reference Zhang, Wang, Wang, Lu, Yu and Tian2022). In these configurations, secondary flows, including Dean-type, Görtler-type and shear-layer vortices, etc., commonly occur due to streamline and circumferential curvature. Nevertheless, the interactions between such flows and inertial particles remain poorly understood.
Particle-laden flows in compressible wall-bounded turbulence, especially in turbulent channels and boundary layers, have recently received attention in the fluid dynamics community. The interphase interactions are similar in compressible and incompressible wall-bounded turbulence (Wang et al. Reference Wang, Zhou and Zheng2024). In the outer region away from the wall, particles with moderate inertia are thrown out of vortices due to the centrifugal effects and preferentially migrate towards regions with lower turbulent intensities (Brandt et al. Reference Brandt and Coletti2022). In the near-wall region, quasi-streamwise vortices and hairpin vortices are dominant, sweeping moderate-inertia particles towards the viscous sublayer, where they reside for a comparatively long time without being able to be lifted promptly by ejection events (McLaughlin Reference Mclaughlin1989) and form the preferential particle accumulation, known as turbophoresis. The preferential accumulation of particles is typically described by the viscous Stokes number (St +) (Sardina et al. Reference Sardina, Schlatter, Picano, Casciola, Brandt and Henningson2012; Lee et al. Reference Lee and Lee2015). The turbophoresis phenomenon is the most prominent for particles with St + = 1–10 (Bernardini Reference Bernardini2014), and diminishes for those with both smaller and larger St +. Particles with tiny St +, such as high-resolution nanoparticle-based planar laser scattering, almost fully track turbulence (Tee et al. Reference Tee, Barros and Longmire2020), while particles with very large St + are scarcely transported by local turbulent fluctuations and thus distribute more uniformly (Yu et al. Reference Yu, Zhao, Yuan and Xu2024). For compressible flows, Xiao et al. (Reference Xiao, Jin, Luo, Dai and Fan2020) found that the preferential distribution is obviously related to flow density, with large particles located in low-density regions in the inner region and high-density regions in the outer region of the turbulent boundary layer. Yu et al. (Reference Yu, Zhao, Yuan and Xu2024) found a slight reduction in particle accumulation in low-vorticity regions as the Mach number increases. Additionally, particle behaviour exhibits additional dependence on local flow properties due to the mean and fluctuating temperature variations (Yu et al. Reference Yu, Du, Wang, Dong and Yuan2025), pressure fluctuations (Bernardini Reference Bernardini2014; Buchta et al. Reference Buchta, Shallcross and Capecelatro2019), and the existence of shocklets (Dai et al. Reference Dai, Luo, Jin and Fan2017).
While compressible multiphase turbulence over flat walls has been extensively studied, research on curved-wall configurations remains limited. Current research on multiphase turbulence in curved pipes predominantly focuses on subsonic flows, where circumferential confinement and centrifugal effects trigger the well-known large-scale secondary motions, particularly Dean vortices, that dominate particle dynamics (Sivasankar et al. Reference Sivasankar, Wang, Natu, Porter, Herbertson, Craven, Guha and Das2022). For instance, Lin & Lin (Reference Lin and Lin2009) observed that larger nanoparticle diameters enhance and homogenise deposition in a circular bend pipe. Sivasankar et al. (Reference Sivasankar, Wang, Natu, Porter, Herbertson, Craven, Guha and Das2022) reported that small inertial particles tend to follow Dean vortices and accumulate near the channel centre, while larger particles migrate towards the outer wall. Meanwhile, the feedback force of particles can modulate the Dean vortices. Erraghroughi et al. (Reference Erraghroughi, Bah, El Maakoul and Abdellah2024) examined the influence of rib structures on particle transport and deposition in curved pipes, and Song et al. (Reference Song, Qiu, He, Lv, Huang and Xie2025) highlighted the role of gravity in graphite particle deposition in low-speed curved flows. Collectively, these studies indicate that particle deposition peaks on the outer wall near the centre plane and minimises on the inner wall.
In contrast, supersonic curved flows introduce strong compressibility effects, which significantly alter the flow topology through shock/expansion waves and generate additional secondary vortical structures, such as Görtler-type vortices, enhancing flow three-dimensionality (Chen et al. Reference Chen, Liang, Yang, Sun, Long, Li, Wang, Xiong and Wang2024). These compressibility-induced features are likely to substantially modify the particle transport in turbulence. However, experiments and simulations have been conducted on supersonic wall turbulence over convex surfaces (Wang et al. Reference Wang and Wang2017) and concave surfaces (Wang et al. Reference Wang, Wang and Zhao2016, Reference Wang, Wang, Sun, Yang, Zhao and Hu2019), corresponding to the inner and outer walls of a curved pipe, respectively. Yang et al. (Reference Yang, Long, Xiao, Li, Xiong, Wang, Li and Sun2025) observed that large inertial particles exhibit significantly enhanced accumulation and form pronounced particle streaks in supersonic wall turbulence over concave surfaces. Rubio et al. (Reference Rubio, Rodrigues, Qi, Patel, Gorman, Diaz Lopez, Capecelatro, Danehy and Ni2025) explained the formation of dusty streaks at lunar landing sites caused by rocket exhaust, with both Rubio (Reference Rubio, Rodrigues, Qi, Patel, Gorman, Diaz Lopez, Capecelatro, Danehy and Ni2025) and Yang et al. (Reference Yang, Long, Xiao, Li, Xiong, Wang, Li and Sun2025) attributing such streak patterns to Görtler instability. In a related category of studies, the effect of centrifugal force on supersonic multiphase flows in straight pipes has been simulated by introducing system rotation (or Coriolis forces), representing conditions such as aircraft turning with high accelerations (Yang et al. Reference Yang, Xueting, Qingyun, Huangpeng, Yan and Peijin2025a ) or rotating machinery (Gallon et al. Reference Gallon, Feraco, Marino and Pumir2025). These studies show that centrifugal forces compress turbulence towards the pressure side (analogous to the outer side of a curved pipe), aggravating particle accumulation and thermal erosion on that side (Yang et al. Reference Yang, Xueting, Qingyun, Huangpeng, Yan and Peijin2025a ). However, such rotating flow configurations cannot fully replicate the complex secondary vortices inherent to curved geometries, which are likely to substantially influence particle transport and distribution.
The previous brief literature review indicates that particle transport in supersonic curved pipe flow is significantly changed by the combined effect of circumferential confinement, strong compressibility and centrifugal effects. However, the understanding of particle transport dynamics in such flows is still lacking. To bridge this knowledge gap, this study employs Eulerian–Lagrangian direct numerical simulation to investigate inertial particle transport in compressible turbulent flow in a curved pipe at Mach 3.0. The findings provide novel insights into particle dynamics in supersonic curved geometries and offer practical implications for enhancing mixing control and fuel-supply stability in scramjet combustors (Chang et al. Reference Chang, Zhang, Bao and Yu2018; Abdulrahman et al. Reference Abdulrahman, Qasem, Imteyaz, Abdallah and Habib2023), as well as for mitigating wall thermal erosion and abrasion in high-speed propulsion components (Zhang et al. Reference Zhang, Wang, Wang, Lu, Yu and Tian2022; Yang et al. Reference Yang, Xueting, Qingyun, Huangpeng, Yan and Peijin2025a ).
The remainder of this paper is organised as follows. The physical model and numerical methods are introduced in § 2. Then, an overview of particle motions for St + = 4 and 16 is introduced and compared with instantaneous and time-averaged distributions in § 3. Section 4 further analyses and explains the particle behaviours in different sectionalised flows. The particle dynamics in supersonic curved pipe flow are summarised in § 5. Finally, concluding remarks are summarised in § 6.
2. Physical model and numerical methods
2.1. Continuous phase simulations in Eulerian framework
In the present study, we perform direct numerical simulation (DNS) studies of compressible turbulent flows with particles in a straight-to-curved pipe using the Eulerian–Lagrangian point-particle method. The computational model is constructed in accordance with the corresponding experimental parameters (Liang et al. Reference Liang, Sun, Huang, Xiong, Yu, Yang, Wang, Sun and Ma2022). The pipe geometry, as shown in figure 1, consists of a straight pipe (SP) section and a bent pipe (BP) section. The pipe radius R, the length of the straight section L = 9.09R and the length of the centreline of the curved section αR * = 7.61R, α = 0.628π. The curvature of BP is defined as R * /R = 12.12.
Sketch of the computational domain: (a) inlet plane and grid setting; (b) 3-D geometry.

Figure 1. Long description
Panel A: A cross-sectional view of the computational domain showing the inlet plane and grid setting. The cross section is divided into four quadrants labeled A, B, C, and D. Key points include the center labeled O, with radial and tangential components marked as N_r and N_theta respectively. The angles are marked in radians, with specific points at 0, π/4, π/2, 3π/4, π, −π/2, −π/4, and -3π/4. The radius is denoted as R, and the distance from the center to a point on the circumference is r. Panel B: A 3-D model of the computational domain showing the geometry. The model includes the radius R, the inner radius r, and the length L. The particle inlet is located at x/R = 6.58. The inflow conditions are marked with Ma, ρ0, and T0. The outer side, inner side, and lateral side are labeled. The coordinate axes x, y, and z are indicated, with the angle α = 0.628π and the radius R* shown.
The compressible turbulent flows in the pipe are governed by the Navier–Stokes equations for viscous perfect gases. In the Cartesian coordinate system, these equations can be written as follows:
 \begin{equation} \frac{\partial \rho }{\partial t}+\frac{\partial }{\partial x_{\textit{j}}}\big(\rho u_{\textit{j}}\big)=0, \end{equation}
 \begin{equation} \frac{\partial (\rho u_{\textit{i}})}{\partial t}+\frac{\partial }{\partial x_{\textit{j}}}\left(\rho u_{\textit{i}}u_{\textit{j}}+\delta _{\textit{ij}}p\right)=\frac{\partial \tau _{\textit{ij}}}{\partial x_{\textit{j}}}, \end{equation}
 \begin{equation} \frac{\partial (\rho E)}{\partial t}+\frac{\partial }{\partial x_{\textit{j}}}\left[\left(\rho E+p\right)u_{\textit{j}}\right]=\frac{\partial }{\partial x_{\textit{j}}}\left(\tau _{\textit{ij}}u_{\textit{i}}+k\frac{\partial T}{\partial x_{\textit{j}}}\right)\!. \end{equation}
Here, the velocity component in the x i (also x, y and z, representing the streamwise, vertical and horizontal cross-stream) direction is represented by u i (also u, v and w). The p, ρ and T denote the pressure, density and temperature, respectively, related with the total energy E as
 \begin{equation} p=\rho \textit{RT},\quad E=C_{v}T+0.5u_{\textit{i}}u_{\textit{i}} ,\end{equation}
with
 $\gamma =1.4$
being the specific heat ratio,
 $C_{p}$
and
 $C_{V}$
being the specific heat of constant pressure and volume, respectively, and R being the gas constant. The viscous stress tensor
 $\tau _{\textit{ij}}$
is associated with the strain rate tensor as
 \begin{equation} \tau _{\textit{ij}}=\mu \left(\frac{\partial u_{\textit{i}}}{\partial x_{\textit{j}}}+\frac{\partial u_{\textit{j}}}{\partial x_{\textit{i}}}\right)-\frac{2}{3}\mu \frac{\partial u_{\textit{i}}}{\partial x_{\textit{j}}}\delta _{\textit{ij}}, \end{equation}
where the dynamic viscosity is calculated by Sutherland’s law, and the thermal conductivity k is derived by dynamic viscosity μ and the Prandtl number (Pr = 0.72) as
 $k=\mu C_{p}/Pr$
.
The flow parameters are set as follows. The free stream Mach number is set to be 3.0, stagnation temperature as T
0 = 300 K and stagnation pressure as P
0 = 101.325 kPa. An improved synthetic eddy method (SEM) (Chen et al. Reference Chen, Liang, Yang, Sun, Long, Li, Wang, Xiong and Wang2024, Reference Chen, Yang, Long, Tang, Dapeng, Wang, Sun and Yang2025a
; Long et al. Reference Long, Xiong, Wang, Sun, Chen, Li and Yang2024) is used as the inlet turbulence generator. At the inlet, the nominal boundary-layer thickness at the bottom wall (δ
i
) is estimated to be δ
0 = 0.29R, with a compressible boundary-layer momentum thickness
 $\theta _{{m}}={\int }_{0}^{\delta _{{i}=0}}\rho u/\rho _{i=0}u_{i=0}(1-u/u_{i=0})\,{\rm d}y=0.02R$
. The momentum Reynolds number is estimated to be
 $\textit{Re}_{\theta }=\rho _{0}u_{0}\theta _{m}/\mu _{w}=2975$
. The Dean number, defined as
 $\textit{De}=\textit{Re}_{\theta }\sqrt{R/R^*}=824$
, characterises the intensity of the curvature-induced flow. Under such a parameter, it is sufficient to generate the Dean vortex (Chen et al. Reference Chen, Liang, Yang, Sun, Long, Li, Wang, Xiong and Wang2024). The viscous scales are defined by the wall shear stress
 $\tau _{w}=\mu _{w}(\partial \overline{u}/\partial y)_{w}$
, dynamic viscosity
 $\mu _{w}$
and density
 $\rho _{w}$
, and the friction velocity is constructed as
 $u_{\tau }=\sqrt{\tau _{w}/\rho _{w}}$
, viscous length scale as
 $\delta _{\nu }=\mu _{w}/(u_{\tau }\rho _{w})$
and time scale as
 $\tau _{\nu }=\delta _{\nu }/u_{\tau }$
. The friction Reynolds number at the inlet is estimated to be
 $\textit{Re}_{\tau }=\rho _{w}u_{\tau }\delta _{\textit{i}}/\mu _{w}=292$
. The flow quantities normalised by these viscous scales are denoted by the superscript +.
The computational domain is discretised using an O-type structured grid. The computational domain adopts a sectional division as illustrated in figure 1(a), where the pipe cross-section is partitioned into four peripheral quadrants (A, B, C, D) and a central cylindrical region (O). Grid refinement is applied in the axial (x), radial (r) and azimuthal (θ) directions. Near-wall regions are discretised with exponentially stretched grids to maintain a wall-normal resolution of
 ${\unicode[Arial]{x0394}} {r}_{w}^{+}=0.76$
at the wall. In the axial direction, the calculation domain is divided into two sections: straight pipe (SP) and bend pipe (BP) sections. BP will be further divided into the initial BP (IBP) and the downstream BP (DBP) at x
1/R ≈ 12. The mesh grids in the peripheral regions (A, B, C, D) are N
x
× N
r
× Nθ
= 1360 × 100 × 180 (corresponding to the axial, radial and circumferential directions, respectively), with a total of 140 million grids. The corresponding grid resolutions in wall units are Δx
+ ≈ 11 in the axial direction and (RΔθ)+ ≈ 8.2 in the azimuthal direction.
The direct numerical simulation is performed using an in-house GPU-accelerated code (Liu et al. Reference Liu, Sun, Wang, Li, Wang, Zhao, Yang and Xiong2023b ), which has been extensively validated in previous studies of supersonic turbulence (Xiong et al. Reference Xiong, Sun, Yu, Hu, Yang, Wang and Wang2022; Chen et al. Reference Chen, Liang, Yang, Sun, Long, Li, Wang, Xiong and Wang2024, Reference Chen, Yang, Long, Tang, Dapeng, Wang, Sun and Yang2025a ; Long et al. Reference Long, Xiong, Wang, Sun, Chen, Li and Yang2024) as well as in multiphase and reacting flows, including transverse jets (Zhou et al. Reference Zhou, Cai, Li, Li, Yang, Wang, Li, Wei, Chen and Sun2025), particle-laden wall-bounded flows (Yang et al. Reference Yang, Long, Xiao, Li, Xiong, Wang, Li and Sun2025b ), multiphase mixing layers (Yang et al. Reference Yang, Li, Mai, Liu, Li, Wang, Xiao and Sun2024b ) and liquid-kerosene combustion (Liu et al. Reference Liu, Li, Li, Wang, Sun, Wang, Yang, Xiong and Wang2023a ). For spatial discretisation, the inviscid terms are computed using a hybrid scheme that combines a fourth-order kinetic-energy-preserving scheme with a fourth-order central-upwind weighted essentially non-oscillatory (WENO-CU4) scheme. The WENO-CU4 scheme is selectively activated in regions identified by a shock sensor (Zhao et al. Reference Zhao, Sun, Mei, Li, Wang, Li, Liu, Sun and Liang2019) to capture flow discontinuities. Viscous terms are discretised with a second-order central difference scheme. Time integration is carried out using a third-order explicit Runge–Kutta method.
As a validation of the numerical methods adopted herein, we compare our DNS results with the experimental data reported by Liang et al. (Reference Liang, Sun, Huang, Xiong, Yu, Yang, Wang, Sun and Ma2022) in figure 2(b). The time-averaged velocity profiles in the SP from DNS are consistent with the experimental measurements by the particle image velocimetry (PIV) technique by Liang et al. (Reference Liang, Sun, Huang, Xiong, Yu, Yang, Wang, Sun and Ma2022). The van Driest transformed mean velocity profile in SP agrees well with the DNS studies of compressible pipe flows from Ghosh et al. (Reference Ghosh, Foysi and Friedrich2010) and Modesti & Pirozzoli (Reference Modesti and Pirozzoli2019), as displayed in figure 2(a). A discrepancy can be observed around the core flow. The likely reason for this over-prediction is the distinct flow configuration: the present case features a thin boundary layer interfacing with core flow, while the compared studies (Ghosh et al. Reference Ghosh, Foysi and Friedrich2010; Modesti et al. Reference Modesti and Pirozzoli2019) are fully developed pipe flow without such an interface. The NPLS images from Liang et al. (Reference Liang, Sun, Huang, Xiong, Yu, Yang, Wang, Sun and Ma2022) and instantaneous density contours obtained from the present DNS manifest similar flow organisations within the boundary layers and at the turbulent–non-turbulent interfaces, as shown in figure 3. Those results suggest the validity of the DNS conducted herein. Additionally, our previous study (Long et al. Reference Long, Xiong, Wang, Sun, Chen, Li and Yang2024) demonstrated, through the streamwise evolution of the friction velocity, that the turbulent generated by the SEM has become fully developed and self-sustaining before reaching the bend section.
(a) Comparison of the present DNS results with those of Ghosh et al. (Reference Ghosh, Foysi and Friedrich2010) and Modesti & Pirozzoli (Reference Modesti and Pirozzoli2019). (b) Comparison of the present DNS results with those from the experiment by Liang et al. (Reference Liang, Sun, Huang, Xiong, Yu, Yang, Wang, Sun and Ma2022).

Comparison of DNS results with those from the experiments by Liang et al.(Reference Liang, Sun, Huang, Xiong, Yu, Yang, Wang, Sun and Ma2022): (a) a slice at z = 0 in SP; (b,c) the wall-normal slices at (b) x 1/R = 13.84 and (c) x 1/R = 14.61 in BP.

To facilitate in-depth analysis of the three-dimensional complex flow structures induced by the curvature, we define two sets of geometric transformations. The first is the straightening transformation, the core idea of which is to ‘straighten’ the bent pipe along its centreline into an equivalent straight duct. This transformation preserves the path length of fluid elements along the centreline, thereby mapping the complex three-dimensional effects associated with curvature in physical space (x, y, z) onto a straightened Cartesian coordinate system (x 1, y 1, z 1). The formulae for the transformation are given as follows:
 \begin{align} x_{1}=\begin{cases} L+R^{*}\alpha & \mathrm{if}\ \alpha \gt 0,\\ x_{1}=x & \mathrm{if}\ \alpha \leq 0, \end{cases} \end{align}
 \begin{align} y_{1}=\begin{cases} \sqrt{(R-d_{\textit{min}})^{2}-z^{2}} & \mathrm{if}(R-d_{\textit{min}})^{2}\geq z^{2}\text{ and }y\gt y_{c},\\ -\sqrt{(R-d_{\textit{min}})^{2}-z^{2}} & \mathrm{if}(R-d_{\textit{min}})^{2}\geq z^{2}\text{ and }y\leq y_{c},\\ 0 & \mathrm{if}(R-d_{\textit{min}})^{2}\lt z^{2}, \end{cases} \\[10pt] \nonumber \end{align}
and z
1 = z, where
 $\alpha =\arctan ((x-L)/(R^{*}-y))$
and
 $d_{\textit{min}}$
is the minimum wall distance, calculated as
 \begin{align} d_{\textit{min}}=\begin{cases} R-\sqrt{(x-L-R^{*}\sin \alpha )^{2}+(y-R^{*}+R^{*}\cos \alpha )^{2}+z^{2}}, & x\gt L,\\ R-\sqrt{y^{2}+z^{2}}, & x\leq L. \end{cases} \end{align}
In this coordinate, the streamwise evolution of flow parameters (such as density and pressure) under the influence of curvature, particularly the generation and development of shock and expansion wave systems, can be intuitively visualised along the x
1 direction. The velocity components in this coordinate are denoted as u
1,
 ${v}$
1 and
 ${w}$
1, respectively.
The second is the unfolding transformation, which aims to ‘cut open’ the cylindrical pipe wall along the circumference and unfold it into a two-dimensional plane. This transformation establishes a ‘cut open’ coordinate system (x
2, y
2, z
2), where x
2 = x
1, y
2 = R-r directly represents the radial distance to the wall, and z
2 = rθ linearly corresponds to the azimuthal direction, where r represents the radius from any point to cross-sectional centre at (x
1, y
1, z
1). For ease of description, we will define the region where π/4 < θ < 3π/4 as the inner side, the region where −3π/4 < θ <−π/4 as the outer side, and the two sides of the pipe are the lateral side, as shown in figure 1. The velocity components in this coordinate are (
 $V_{\tau },V_{n}$
), with the subscripts τ and n representing the centripetal velocity and circumferential velocity, respectively.
2.2. Particle simulations in Lagrangian framework
The Stokes number of particles reflects particle inertia, or its ability to follow the motion of the fluid. It is a key parameter in particle-laden turbulence that characterises particle dynamics and distribution. In wall-bounded turbulence, we define the viscous Stokes number as
 $St^{\mathit{+}}=\tau _{p,w}/\tau _{\nu }$
, where
 $\tau _{p}=\rho _{p}{d}_{p}^{2}/18\mu _{\!f}$
is the relaxation time of the particle, with
 $\rho _{p} , d_{p}$
and
 $\mu _{\!f}$
being the particle density, particle diameter and the fluid dynamic viscosity seen by the particles. We consider three inertial particles with St
+ = 16, 4 and 0.9 by changing particle density. The particle densities are set to be 8421ρ
0, 2105ρ
0 and 473ρ
0, respectively, and the particle diameters as d
p
= 1.2 × 10⁻⁴
R. Notably, due to preferential accumulation, the local volume fraction for the St
+ = 16 case can approach the lower boundary of the two-way coupling regime (approximately O(10−5)) in a very small region near the outer wall. However, such concentration regions are extremely limited in spatial extent and the volume fraction remains below 1 × 10⁻⁶ throughout the vast majority of the domain. We therefore neglect particle feedback in the present study and focus on establishing the baseline particle distribution patterns. In the minimal computational cell, the ratio of the minimal grid scale and particle diameter is
 $\sqrt[3]{{\unicode[Arial]{x0394}} \mathit{x}{\unicode[Arial]{x0394}} y{\unicode[Arial]{x0394}} z}/d_{p}\approx 43$
, further confirming the appropriateness of using the point-particle assumption. Those treatments are consistent with the methodology employed in previous studies (Xiao et al. Reference Xiao, Jin, Luo, Dai and Fan2020; Zahtila et al. Reference Zahtila, Chan, Ooi and Philip2023; Wang et al. Reference Wang, Zhou and Zheng2024; Yu et al. Reference Yu, Zhao, Yuan and Xu2024).
The particles are tracked individually under the Lagrangian coordinate. The particle motions are governed by Basset Boussinesq–Oseen equations. In supersonic flows, the aerodynamic drag force is usually the most significant (Fedorov Reference Fedorov1983; Li et al. Reference Li, Wang, Sun and Wang2017; Li et al. Reference Li, Wang, Bai, Wang, Sun, Wu and Liu2019; Capecelatro Reference Capecelatro2022). Since this paper involves strong flow compressibility, the additional mass force (Capecelatro Reference Capecelatro2022; Patel et al. Reference Patel, Rubio, Shekhtman, Parziale, Rabinovitch, Ni and Capecelatro2024) and the pressure gradient force are also considered,
 \begin{equation} \frac{{\mathrm{d}}{x}_{p,i}}{{\mathrm{d}}{t}}=u_{p,i}, \end{equation}
 \begin{equation} \frac{{\mathrm{d}}{u}_{p,i}}{{\mathrm{d}}{t}_{L}}=\underset{F_{D}}{\underbrace{\frac{3}{4}\frac{\rho _{\!f}C_{d}}{\rho _{p}d_{p}}\left| u_{f,i}-u_{p,i}\right| \left(u_{f,i}-u_{p,i}\right)}}\underset{F_{p}}{\underbrace{-\frac{1}{\rho _{p}}\frac{\partial p_{\!f}}{\partial x_{\textit{i}}}}}+\underset{F_{am}}{\underbrace{V_{p}C_{M}\left(M_{p},\alpha _{p}\right)\left[\frac{\mathrm{D}(\rho u_{f,i})}{{\mathrm{D}}{t}}-\frac{\mathrm{d}\left(\rho _{p}u_{p,i}\right)}{{\mathrm{d}}{t}}\right]}}. \end{equation}
The u
p,i
is the particle’s velocity (represented by u
p
,
 ${v}$
p
,
 ${w}$
p
). The subscript f represents the fluid quantities seen by the particle at its position, which is evaluated by the inverse distance weighting averaged method (Liu et al. Reference Liu, Sun, Wang, Li, Wang, Zhao, Yang and Xiong2023b
; Yang et al. Reference Yang, Li, Liu, Sun, Yang, Wang, Wang and Li2024a
; Reference Yang, Li, Liu, Sun, Yang, Wang, Wang and Li2025). The drag coefficient C
d
is modelled as the compressibility-correlated formula proposed by Parmar et al. (Reference Parmar, Haselbacher and Balachandar2010), which is widely used in supersonic flows due to its broad feasibility regarding particle slip Mach number
 $M_{p}=| u_{f,i}-u_{p,i}| /a_{\!f}$
and Reynolds number
 $\textit{Re}_{p}=\rho _{\!f}| u_{f,i}-u_{p,i}| d_{p}/\mu _{\!f}$
. In the added-mass force, the coefficient C
M
= 0.5η
1(M
p
)η
2(Φ
p
), with η
1(M
p
) and η
2(Φ
p
) the correction coefficients based on M
p
and volume fraction correction (Capecelatro Reference Capecelatro2022; Patel et al. Reference Patel, Rubio, Shekhtman, Parziale, Rabinovitch, Ni and Capecelatro2024).
The three-step Runge–Kutta method with third-order accuracy is used for the time advancement. When particles hit the wall, a widely used particle–wall interaction model (Tsuji et al. Reference Tsuji, Morikawa, Tanaka, Nakatsukasa and Nakatani1987; Novelletto Ricardo et al. Reference Novelletto Ricardo and Sommerfeld2024; Yang et al. Reference Yang, Long, Xiao, Li, Xiong, Wang, Li and Sun2025b
), considering a part of momentum loss and rebound, is used to calculate the reflective velocity. The particles are released within the region in y
2 ≤ 1.1δ
0 at the plane of x
1/R = 6.58 into the flow field after the simulation for the fluid has been run for ten convective periods
 $T_{c}=(L+\alpha R^*)\mathit{/}u_{0}$
. The data samples are collected after another 20 convective periods and the statistics are obtained over the subsequent 10 convective periods. Each case costs approximately 480 hours on eight A100 GPUs.
3. Overview of particle motions
We commence our discussion with an instantaneous visualisation of representative cases of St + = 16 to establish a preliminary understanding of the curved-pipe flow. Figure 4 displays the three-dimensional distribution of St + = 16 particles near the transition from the straight to the curved section, and the top-left inset offers a more detailed perspective for z < 0. In the straight pipe section, low-speed particle streaks are visible near the walls, consistent with previous observations in both incompressible (Brandt et al. Reference Brandt and Coletti2022) and compressible (Wang et al. Reference Wang, Zhou and Zheng2024) particle-laden wall-bounded turbulence. Upon entering the curved section, particle streaks persist mainly along the lower wall on the outer side. Simultaneously, higher-speed particles on the inner side migrate towards the pipe core. Further downstream, particle concentration declines noticeably along the outer side wall around z = 0, while the number of particles along the inner side of the bend also decreases rapidly.
Instantaneous distribution of St + = 16 particles in a straight-to-curved pipe at (a) half-view in z < 0, and (b) 3-D view. Turbulence is shown by gas density and particles are coloured by their up /α 0.

Figure 4. Long description
Panel A: A half-view visualization of particle distribution in a curved pipe for z < 0. The inner and outer sides of the pipe are labeled. Particles are colored by their velocity. Panel B: A 3D view of the same particle distribution in the curved pipe. The inner, outer, and lateral sides are labeled. The streamwise location is marked along the x/R axis. The density and velocity of particles are indicated by color scales.
We then establish inertia-dependent contrasts in particle distribution through cases of St + = 16 and St + = 4. Figure 5 shows the distributions of fluid density and of particles with St + = 16 and St + = 4 on the central slice (z = 0). In the fluid phase, convex curvature effects result in the expansion of the flow along the inner side, generating expansion waves and reducing the local fluid density. The convex curvature effects also induce flow separation on the inner side downstream, where the density is further reduced, and the flow becomes subsonic; this region is hereafter referred to as the low-speed region. Conversely, flow along the outer side is compressed against the wall, forming compression waves and increasing the fluid density. At the interface between the resulting low-speed and high-speed regions, a pronounced shear layer can be observed. At approximately x/R ≈ 14, a compression wave impinges on this shear layer, downstream of which a series of complex wave interactions occurs along the outer wall. The initially well-defined turbulent boundary layer along the outer side of the straight section decreases substantially upon entering the curved segment and continues to become thinner downstream. A detailed discussion of these turbulent structures is provided by Chen et al. (Reference Chen, Liang, Yang, Sun, Long, Li, Wang, Xiong and Wang2024).
Instantaneous distribution of gas density at z = 0 for (a) St + = 16 and (b) St + = 4 particles within z/R = ± 0.01, particles are coloured by their up /α 0.

In the straight-pipe (SP) section, both types of inertial particles exhibit similar velocity and concentration distributions, with the particle-layer thickness remaining nearly uniform along the streamwise direction. Upon entering the curved section, the particle layer becomes thinner markedly along the outer bend for both particle populations and the particle number continues to decrease further downstream. Along the inner side, particles migrate towards the pipe core, with only a limited number retained within low-speed and separated flow regions. Beyond the location x/R ≈ 14, the particle layers of both types show a slight inward deflection towards the inner bend. Notably, however, pronounced differences emerge between the two Stokes-number populations. In the initial bend region (IBP), the concentration of St + = 16 particles decreases substantially and the corresponding particle layer thickness attenuates more rapidly. In the downstream bend region (DBP), St + = 4 particles are effectively entrained and lifted by turbulent fluctuations, leading to a higher concentration, whereas St + = 16 particles become more scarce. Moreover, in the vicinity of the inner wall within IBP, including low-speed regions, the flow separation regions and the shear layer, the concentration of St + = 4 particles significantly exceeds that of St + = 16 particles. The inward deflection of the St + = 4 particle layer is also more pronounced, further highlighting the Stokes-number-dependent transport mechanisms induced by curvature.
For further quantification of the particle distributions in the pipe, in figure 6, we present the spatial distribution of particle number fraction φp for St + = 16 and St + = 4. In the SP section, the φp exhibits an increase towards the wall, while remaining approximately uniform in both the streamwise and circumferential directions. Upon entering the BP section, this distribution varies significantly. On the inner side, particles disperse towards the pipe core, increasing φp in the central region while decreasing it within the separation zone. On the outer side, the peak φp near the wall rises slightly overall. In this region, inertial particles are transported towards the wall due to the flow compression, leading to a thinning of the particle layer and an increase in wall-adjacent φp . These near-wall φp values continue to increase downstream, reaching a local maximum at x 1/R = 13.33. Notably, however, it subsequently declines further downstream. Additionally, φp increases noticeably on both sides of the z = 0 plane and gradually decays along the streamwise direction on the outer side of the BP.
φ p distribution of (a) St + = 16 and (b) St + = 4 particles.

Figure 6. Long description
Panel A: A heat map showing the distribution of particles with a Stokes number of 16. The x-axis is labeled x/R, the y-axis is labeled y/R, and the z-axis is labeled z/R. The color scale ranges from 1.19x10^9 to 1.19x10^11, indicating particle concentration. The red arrow points to the bottom wall where particle concentration increases. The black arrow indicates a local low concentration region. Panel B: A heat map showing the distribution of particles with a Stokes number of 4. The x-axis is labeled x/R, the y-axis is labeled y/R, and the z-axis is labeled z/R. The color scale ranges from 1.19x10^9 to 1.19x10^11, indicating particle concentration. The red arrows indicate regions where particle concentration increases at the sides and decreases along the center. The black arrow points to a local high concentration region.
On the outer side, the two inertial particles exhibit distinct contrasts in particle number fraction φp . The layer of St + = 16 particles compresses more rapidly towards the wall, accompanied by a more pronounced decrease in thickness, as shown in figure 6(a). While the values of φp of St + = 4 particles near the wall exceed those of St + = 16 particles at x 1/R = 9.7, this trend reverses at downstream stations (x 1/R ≥ 10.9), with St + = 16 particles consistently maintaining higher φp thereafter.
Differences are also evident on the inner side. First, the outer edge of the St + = 16 particle layer is located closer to the pipe centre, indicating that these particles penetrate deeper into the core flow. Second, in the vicinity of the IBP section (at x/R ≈ 12), St + = 4 particles form a localised region of notably high concentration along the inner side, as observed in figure 6(b). Moreover, throughout the entire low-speed region, φp for St + = 4 particles remains significantly higher than that for St + = 16 particles.
These observed phenomena are closely associated with the three defining characteristics of supersonic curved-pipe turbulence noted earlier: three-dimensional confinement, strong compressibility and centrifugal forcing. To elucidate the underlying mechanisms, the following sections will examine each of these factors in turn.
Figure 7 presents the distributions of time-averaged slip velocities in the straightened coordinate system. On the central plane (z
1 = 0), the vertical slip velocity
 ${\unicode[Arial]{x0394}} \overline{v}_{1}=\overline{v}_{1}-\overline{v}_{p,1}$
is shown, while the spanwise relative velocity
 ${\unicode[Arial]{x0394}} \overline{w}_{1}=\overline{w}_{1}-\overline{w}_{p,1}$
is displayed at selected streamwise slices. In the SP,
 ${\unicode[Arial]{x0394}} \overline{w}_{1}$
remains nearly zero everywhere. On the inner side,
 ${\unicode[Arial]{x0394}} \overline{v}_{1}$
is negative near the wall and positive away from it, while the outer side exhibits a mirror-symmetric pattern about y
1 = 0. The behaviour of the particle in the SP is investigated in § 4.1.
Distributions of time-averaged streamwise and circumferential relative velocities
 ${\unicode[Arial]{x0394}} \overline{w}_{1}$
(different x
1 slices) and
 ${\unicode[Arial]{x0394}} \overline{v}_{1}$
(z
1 = 0 plane) for (a) St
+ = 16 and (b) St
+ = 4 in the straightened coordinate system. Regions with particle volume fraction below 1 × 10⁻⁹ are blanked. The black solid line marks the position where y
1 = 0, which divides the inner and outer sides.

Upon entering the BP section, both
 ${\unicode[Arial]{x0394}} \overline{w}_{1}$
and
 ${\unicode[Arial]{x0394}} \overline{v}_{1}$
increase significantly. Due to the geometric curvature, the flow on the inner side moves centripetally towards the centre of curvature, whereas the flow on the outer side moves centrifugally. On the inner side,
 ${\unicode[Arial]{x0394}} \overline{v}_{1}$
is predominantly positive along increasing x
1; it decreases rapidly to zero or even negative values, then rises again and gradually returns to zero. This oscillatory behaviour closely resembles the complex wave system in the bend. On the outer side, in the initial turning region, positive
 ${\unicode[Arial]{x0394}} \overline{v}_{1}$
rapidly extends from the near-wall region across the entire boundary-layer thickness, indicating that particles throughout the boundary layer are migrating towards the wall. It is a typical characteristic of the initial turning section, induced by the obvious streamwise curvature effect. Further downstream, the positive
 ${\unicode[Arial]{x0394}} \overline{v}_{1}$
gradually diminishes within the boundary layer, while the magnitude of
 ${\unicode[Arial]{x0394}} \overline{w}_{1}$
significantly increases towards the lateral sides and exhibits a mirror-symmetric distribution about z
1 = 0. This pattern implies the presence of pronounced secondary flows in the curved pipe, which is induced by the obvious circumferential curvature effect.
The above-mentioned trends are qualitatively similar for both particle populations, though the observed effects are more pronounced for the St
+ = 16 particles. Notably, within the downstream area of the inner side, the St
+ = 4 particles exhibit alternating positive and negative patterns of
 ${\unicode[Arial]{x0394}} \overline{v}_{1}$
and
 ${\unicode[Arial]{x0394}} \overline{w}_{1}$
, whereas St
+ = 16 particles are extremely scarce. This corresponds to the separation zone mentioned in figure 5. However,St
+ = 16 particles of the inner side tend to penetrate further into the pipe core, with some even reaching the outer side (y
1
< 0). On the outer side z
1 = 0 plane, the St
+ = 4 particles exhibit more negative
 ${\unicode[Arial]{x0394}} \overline{v}_{1}$
in the outer layer than their St
+ = 16 counterparts.
In summary, the low-speed region, wave-affected zones, near-wall region and curvature-induced secondary flows collectively constitute a complex flow environment in the bent pipe, arising from the combined effects of streamline curvature, wall confinement and compressibility. The most significant slip velocities and particle concentration disparities occur in regions characterised by strong streamline curvature, coherent structures and compressibility effects. While particles exhibit a distinctly inertia-dependent response to these flow features. To elucidate the underlying physical mechanisms, the following sections examine the particle dynamics in each of these partitioned flow regions in detail.
4. Particle dynamics in different sections
4.1. Straight pipe region
Particle behaviours in the straight pipe (SP) region are introduced first. Figures 8(a) and 8(c) display the instantaneous distributions of the fluid density ρ, and figures 8(b) and 8(d) show the streamwise velocity u at the wall-normal location y
2/R = 0.01 over the streamwise interval 6.8 < x
2/R < 10.5, with, superimposed upon them, the distributions of the two inertial particles within the thin layer y
2/R = 0.01 ± 0.005. Elongated streak-like structures appear in the SP section, resembling those observed in flat-plate turbulent boundary layers. Particles clearly accumulate in regions of lower fluid density as well as in regions of lower streamwise velocity, thereby forming low-speed particle streaks. These streaks correspond to particles with positive wall-normal velocity (
 ${v}_{p,n}$
> 0), consistent with the ejection events characteristic of near-wall turbulence in flat-plate boundary layers (McLaughlin Reference Mclaughlin1989). Such inertia-dependent segregation, often termed as turbophoresis, has been widely documented in both incompressible (McLaughlin Reference Mclaughlin1989; Sardina et al. Reference Sardina, Schlatter, Picano, Casciola, Brandt and Henningson2012; Lee et al. Reference Lee and Lee2015) and compressible (Xiao et al. Reference Xiao, Jin, Luo, Dai and Fan2020; Yu et al. Reference Yu, Zhao, Yuan and Xu2024) turbulence. The correlation between particle accumulation and local density variation is a recognised feature of compressible turbulent boundary layers. The present discussion emphasises the similarities between the turbulent boundary layer in a straight pipe and that over a flat plate; differences arising from curvature will be examined separately in subsequent sections. Notably, although a pronounced density increase occurs near x
1/R > 10 at z = 0 due to wall compression, this compression appears to have minimal direct effect on the organisation of the particle streaks in the SP region.
Distributions of gas density (ρ/ρ
0
), gas streamwise velocity (u/a
0) and inertial particles around y
2/R = 0.01. Panels (a) and (c) show ρ/ρ
0, and particles are coloured by up/α0. Panels (b) and (d) show the u/a
0, and particles are coloured by their centripetal velocity
 ${v}$
n
,
p
. Panels (a) and (b) are for cases of St
+ = 16 particles, (c) and (d) are for St
+ = 4. The rectangular markers in the figure denote representative particle streaks, placed at identical positions for the two Stokes numbers to highlight that low-speed particle streaks coincide with low-density regions.

Figure 8. Long description
Panel A: A visual representation showing gas density (ρ/ρ0) and particle streamwise velocity (up/a0) for particles with St+ = 16. The x-axis ranges from 7 to 10 and is labeled x2/R, while the y-axis ranges from −2 to 2 and is labeled z2/R. The gas density is depicted in grayscale, and the particles are colored based on their streamwise velocity. Panel B: A visual representation showing gas streamwise velocity (u/a0) and particle centripetal velocity (vn,p/a0) for particles with St+ = 16. The x-axis ranges from 7 to 10 and is labeled x2/R, while the y-axis ranges from −2 to 2 and is labeled z2/R. The streamwise velocity is depicted in grayscale, and the particles are colored based on their centripetal velocity. Panel C: A visual representation showing gas density (ρ/ρ0) and particle streamwise velocity (up/a0) for particles with St+ = 4. The x-axis ranges from 7 to 10 and is labeled x2/R, while the y-axis ranges from −2 to 2 and is labeled z2/R. The gas density is depicted in grayscale, and the particles are colored based on their streamwise velocity. Panel D: A visual representation showing gas streamwise velocity (u/a0) and particle centripetal velocity (vn,p/a0) for particles with St+ = 4. The x-axis ranges from 7 to 10 and is labeled x2/R, while the y-axis ranges from −2 to 2 and is labeled z2/R. The streamwise velocity is depicted in grayscale, and the particles are colored based on their centripetal velocity. Rectangular markers in each panel denote representative particle streaks, placed at identical positions for the two Stokes numbers to highlight that low-speed particle streaks coincide with low-density regions.
A comparison between the behaviour of St + = 16 and St + = 4 particles further reveals that the streaks formed by St + = 4 particles are more distinct (figures 8 b and 8 d), reflecting a stronger tendency for preferential concentration. This is consistent with the established understanding of turbophoresis. Particles with very low St +, such as fine nanoparticle tracers, closely follow turbulent fluctuations, while particles with very high St + respond weakly to local turbulent transport and thus distribute more uniformly. In turbulent boundary layers over a flat wall, the turbophoretic effect typically peaks at St + ≈ O(1)–O(10) (Bernardini Reference Bernardini2014).
To quantify the degree of particle clustering, the box-counting method was applied following Yang et al. (Reference Yang, Long, Xiao, Li, Xiong, Wang, Li and Sun2025). For St + = 16 particles within the y 2 ≤ 0.05δ 0, 20 557 grid cells were occupied, containing 24 615 particles, giving a ratio of 1.197 particles per occupied cell. In the same region, St + = 4 particles occupied 22 703 cells and contained 28 193 particles, corresponding to a higher ratio of 1.242 particles per cell. This larger ratio confirms that St + = 4 particles exhibit stronger preferential concentration than St + = 16 particles under the present flow conditions. We have verified that this ranking is insensitive to the box size by testing three additional grid resolutions (0.02R, 0.01R and 0.005R), which consistently yield the same ordering (St + = 4 > St + = 16 > St + = 0.9) for the particles-per-occupied-box ratio.
Figure 9 further presents the azimuthally averaged particle volume fraction (Φp ) as a function of wall-normal distance (y 2/δ 0) at the streamwise location x 1/R = 8.5. The averaged Φp increases markedly as it approaches the wall. It shows the highest value for St + = 4, followed by St + = 16 and the lowest for St + = 0.9, which provides independent evidence that St + = 4 particles exhibit the most pronounced near-wall accumulation in the SP section. These trends share qualitative similarities with particle-laden turbulence in subsonic curved pipes, for which the relationship between particle distribution and Stokes number has been thoroughly quantified (Zahtila et al. Reference Zahtila, Chan, Ooi and Philip2023). A key distinction in the present compressible turbulence, however, is that particle segregation exhibits additional dependence on local flow variables such as fluid density (Xiao et al. Reference Xiao, Jin, Luo, Dai and Fan2020), pressure (Buchta et al. Reference Buchta, Shallcross and Capecelatro2019) and shocklets (Dai et al. Reference Dai, Luo, Jin and Fan2017), highlighting the coupled role of compressibility and inertia in governing high-speed dispersed-phase dynamics.
Change of azimuthally averaged Φ p with y 2/δ 0 at x 1/R = 8.5.

Therefore, the particle behaviour in the straight pipe qualitatively resembles that in flat-plate compressible turbulent boundary layers (Xiao et al. Reference Xiao, Jin, Luo, Dai and Fan2020) and subsonic straight pipes (Zahtila et al. Reference Zahtila, Chan, Ooi and Philip2023). Unlike subsonic straight pipes, however, compressibility induces density fluctuations that promote additional particle accumulation in low-density regions.
4.2. Particle behaviour in near-wall region of the pipe
Subsequently, particle behaviour in the near-wall region of the pipe is analysed by wall-parallel slices. First, the phenomenon of particles hitting the wall is a representative behaviour for analysing the followability of particles close to the wall surface. Figure 10 compares the wall-collision frequency distributions of St + = 16 and St + = 4 particles within the same flow-through time.
Frequency distribution of (a) St + = 16 and (b) St + = 4 particles’ impact on the wall at views of 3-D (top) and ‘cut open’ (bottom). The leftmost edge of the figure marks the inner and outer sides as viewed from the ‘cut open’ perspective.

Figure 10. Long description
Panel A: A 3-D view and a cut-open view of particle collisions on a pipe wall at St+ = 16. The 3-D view shows uniform collisions in the straight section, collision vanishing, striped erosion, collision enhancement, and collision reduction. The cut-open view highlights these regions with annotations. Panel B: A 3-D view and a cut-open view of particle collisions on a pipe wall at St+ = 4. The 3-D view shows uniform collisions in the straight section, collision vanishing, and collision enhancement. The cut-open view highlights these regions with annotations.
For St + = 16 particles, we can identify five distinct collision regimes. In the BP section, the collision frequency is distributed uniformly in both the streamwise (x 2/R) and circumferential (z 2/R) directions. This pattern resembles the spatially uniform sweeps induced by hairpin vortices in a particle-laden flat-plate turbulent boundary layer (Yang et al. Reference Yang, Long, Xiao, Li, Xiong, Wang, Li and Sun2025b ). Along the inner side of the initial bend (IBP), particle–wall collisions decrease markedly, consistent with the sharp reduction of particle concentration in the low-speed region shown in figures 5 and 6. On the outer side of the IBP, a streaky pattern of elevated collision frequency emerges. We attribute it to the presence of boundary layer scale Görtler vortices, which is a consequence of the streamwise curvature effect that will be analysed in detail later. In the DBP, high-collision zones form symmetrically about the z = 0 plane on both sides. Conversely, along the outer side of the DBP near the z = 0 plane, wall collisions nearly disappear. The last two regimes are both governed by the developing Dean vortices of the scale of the pipe radius, whose formation stems from combined streamwise and circumferential curvature effects, as will be explained in subsequent sections.
In contrast, the particle–wall collision behaviours of St + = 4 particles differ markedly from those of St + = 16 particles. The overall collision frequency in the bend section is significantly lower, despite the stronger near-wall accumulation of St + = 4 particles. The apparent discrepancy stems from the inertia-dependent penetration of the viscous sublayer. After being swept towards the wall by hairpin vortices, low-inertia particles decelerate rapidly within the sublayer, whereas higher-inertia particles maintain sufficient momentum to reach the wall more frequently (Yang et al. Reference Yang, Long, Xiao, Li, Xiong, Wang, Li and Sun2025b ). Consequently, across most regions, the collision frequency of small-inertia particles remains slightly below that of their large-inertia counterparts. Furthermore, the streaky collision pattern observed on the outer side of the IBP for St + = 16 particles disappears for St + = 4 particles, which is also associated with the interaction with Görtler vortices, which will be analysed in detail later.
A key departure from subsonic curved pipe studies (Lin et al. Reference Lin and Lin2009; Saffar et al. Reference Saffar, Kashanj, Nobes and Sabbagh2023; Zahtila et al. Reference Zahtila, Chan, Ooi and Philip2023; Erraghroughi et al. Reference Erraghroughi, Bah, El Maakoul and Abdellah2024; Song et al. Reference Song, Qiu, He, Lv, Huang and Xie2025) lies in the spatial distribution of high-collision zones. In incompressible or low-speed flows, maximum deposition typically occurs on the outer wall near the symmetry plane (z ≈ 0), with a minimum on the inner wall. In the present supersonic curved pipe, however, streamwise-curvature-induced Görtler vortices (Sun et al. Reference Sun, Sandham and Hu2019; Wang et al. Reference Wang, Wang, Sun, Yang, Zhao and Hu2019) effectively lift particles away from the outer wall in their ejection regions, substantially reducing collisions thereof (Yang et al. Reference Yang, Long, Xiao, Li, Xiong, Wang, Li and Sun2025b ). These lifted particles are then redistributed by pipe-radius-scale Dean vortices towards both sides of the symmetry plane, ultimately producing collision hotspots along the lateral walls around z = 0. Additional flow physics, including viscous-layer and pressure-gradient effects that further suppress wall contact, will be elaborated in subsequent sections.
The Görtler number (G) serves as a key stability parameter for predicting the onset and intensity of Görtler vortices, defined as
 \begin{equation} G=\frac{u^{*}\theta ^{*}}{\nu }\sqrt{\theta ^{*}/R^{*}}, \end{equation}
where
 $u^{*}$
and
 $\theta ^{*}$
are the velocity and the length scale of flow. A larger G generally corresponds to stronger vortex intensity (Floryan Reference Floryan1991). In flows where Görtler instability dominates, the momentum thickness θ
m
is conventionally adopted as the characteristic length scale, leading to the definition of G
θ
,
 \begin{equation} G_{\theta }={Re}_{\theta }\sqrt{\theta _{{m}}/R^{*}}. \end{equation}
Figure 11 plots the streamwise evolution of the normalised momentum thickness θ
m
/R, the G
θ
, and the wall pressure p
 $_{w}$
along the outer bend. Within the initial bend section (IBP), θ
m
, G
θ
and p
 $_{w}$
increase significantly, indicating the growth of flow instability and the emergence of Görtler vortices (Floryan Reference Floryan1991; Sun et al. Reference Sun, Sandham and Hu2019; Wang et al. Reference Wang, Wang, Sun, Yang, Zhao and Hu2019). The G
θ
peaks at x
1/R ≈ 12, beyond which θm
decreases rapidly and G
θ
declines accordingly, indicating a progressive weakening of the Görtler instability. This weakening is physically correlated with the change in pressure gradient, since Görtler vortices are sustained by the combined action of an adverse pressure gradient and centrifugal forcing (Floryan Reference Floryan1991; Xu et al. Reference Xu, Ricco and Duan2024). Downstream of x
1/R ≈ 12, expansion waves emanating from the inner wall impinge on the outer wall, reducing p
 $_{w}$
and turning the pressure gradient from adverse to favourable. In incompressible flows, Görtler vortices, once generated, persist or decay only through viscous effects, without being actively modulated by wave-induced pressure changes. Thus, this pressure-gradient reversal is a distinctive feature of compressible curved-pipe flows.
 $G_{\theta }$
, θ
m
/R and p
 $_{w}$
on outer side wall at z = 0.

It should be noted that the SP section, having no curvature (or an effectively infinite radius of curvature), does not support a classical Görtler instability; the values of G θ shown there are included only to maintain continuity and to facilitate visual comparison of the streamwise trend. A local hump in both G θ and θ m /R appears near x 1/R ≈ 15.8, resulting from the impact of a separation-induced shock on the outer-side boundary layer, which will be described in the following section.
The preferential accumulation of particles is quantified here using the statistical asymmetry between ejection and sweeping events, following the methodology of Yang et al. (Reference Yang, Long, Xiao, Li, Xiong, Wang, Li and Sun2025), as shown in figure 12. The analysis employs a box-counting approach within the region defined by 10 ≤ x
2/R ≤ 13, |z
2/R| ≤ 1.5 and y
2 < 0.1δ
0. The flow domain is discretised into cubic cells (boxes) with a side length of 0.015R. For each cell, the number of particles and their average wall-normal velocity
 ${v}_{n,p}$
are computed. Particles with
 ${v}_{n,p}$
> 0 are classified as upward (ejection-dominated) and those with
 ${v}_{n,p}$
< 0 as downward (sweeping-dominated). The results reveal a clear Stokes-number dependence. Compared with St
+ = 4 particles, St
+ = 16 particles occupy significantly more cells where the local fluid wall-normal velocity (
 ${v}_{n}$
) is positive. Moreover, the distribution of
 ${v}_{n,p}$
for St
+ = 16 particles is distinctly asymmetric about
 ${v}_n$
= 0, being skewed towards the positive (ejection) side. This asymmetry highlights how larger inertia amplifies the role of ejections in organising particle concentration within the curved bend.
Statistics of gas ejection (
 ${v}_{n}$
> 0) and sweep (
 ${v}_{n}$
< 0) within the region of 10 ≤ x
2/R ≤ 13, −1.5 ≤ z
2/R ≤ 1.5, y
2 < 0.1δ
0 by the box-counting method, scatters are particle count in each box, coloured by
 ${v}$
n,p
/a
0.

Figure 12. Long description
Panel A: A heat map with the title Sr+ = 16. The x-axis is labeled ‘Particle count in box’ and ranges from 0 to 16. The y-axis is labeled ‘vn/α0’ and ranges from −0.6 to 0.6. The color scale at the top ranges from −0.5 to 0.5, indicating vn,p/α0 values. The map shows regions with vn > 0 ejection in blue and vn < 0 sweep in red. Panel B: A heat map with the title Sr+ = 4. The x-axis is labeled ‘Particle count in box’ and ranges from 0 to 16. The y-axis is labeled ‘vn/α0’ and ranges from −0.6 to 0.6. The color scale at the top ranges from −0.5 to 0.5, indicating vn,p/α0 values. The map shows regions with vn > 0 ejection in blue and vn < 0 sweep in red.
Furthermore, a notable fraction of St
+ = 16 particles exhibits negative wall-normal velocity (
 ${v}_{n,p}$
< 0, red scatters) even within fluid regions where the local fluid velocity
 ${v}_{n}$
is positive (ejection-dominated zones). This indicates that once higher-inertia particles enter an ejection region, their momentum prevents them from reversing direction promptly to follow the upward fluid motion. Instead, they retain a downward trajectory. Such inertia-induced lag is typically significant in the vicinity of the interface between high-speed and low-speed fluid zones, corresponding to the crossing of particles from a faster stream into a slower one. Particles entering a low-speed region tend to accumulate due to the reduced streamwise fluid velocity, which explains why the
 ${v}_{n}$
> 0 fluid regions contain a higher number of densely populated boxes. In contrast, within the same
 ${v}_{n}$
> 0 fluid regions, the wall-normal velocities of St
+ = 4 particles mostly remain positive (
 ${v}_{n,p}$
> 0, blue scatters). Their concentration distribution also shows better symmetry about
 ${v}_{n}$
= 0, indicating that these lower-inertia particles follow the local fluid motion more closely and are less likely to be driven into low-speed streaks where they would accumulate. Additionally, Görtler vortices thicken the boundary layer and lift particles away from the wall. As a result, the above-mentioned behaviours do not lead to a pronounced streaky collision pattern for St
+ = 4 particles, in clear contrast to that observed for the St
+ = 16 population.
Figure 13 presents an instantaneous spread planar or ‘cut open’ slice of u/a
0 at the wall-normal location y
2 = 0.01δ
0 in the (x
2, y
2, z
2) coordinate system. The particles displayed are within y
2 = 0.01δ
0 ± 0.005δ
0. It can be observed that in the SP, the St
+ = 4 particle streaks are more distinct than St
+ = 16 particle streaks, which aligns with the explanation in § 4.1. However, when particles enter the outer side of the IBP, the St
+ = 4 particle streaks weaken significantly, whereas St
+ = 16 particle streaks become more pronounced. Particles with positive
 ${v}$
n,p
(red dots) accumulate in velocity streaks with low u (black streaks), forming low-speed and ejection particle streaks. Particles with negative
 ${v}$
n,p
(blue dots) distribute on the two sides of low-speed particle streaks, forming high-speed particle streaks. This is attributed to the Görtler vortices. Our previous research (Yang et al. Reference Yang, Long, Xiao, Li, Xiong, Wang, Li and Sun2025b
) provided a detailed report on the interaction between particles and Görtler vortices.
Instantaneous ‘cut open’ slice of u/a
0
and particle streaks (PSs) at y
2 = 0.01δ0
, particles are coloured by
 ${v}$
n,p
/a
0, the leftmost edge of the figure marks the inner and outer sides.

In the outer region of the DBP, on both sides of the central plane z = 0, particles are observed to be transported towards regions with increasing |z 2|. This corresponds to the entrainment of particles by the developing Dean vortices. Specifically, Dean vortices transport particles along the wall from the outer side towards the inner side of the pipe. Consequently, near the outer side centre (around z = 0) in the DBP, the number of both particles decreases along the x because particles are carried away by the Dean vortices. The St + = 4 particles, due to their better flow-following ability, experience a more significant reduction in count. The low-speed region drives both the flow and particles at θ = 0.5π towards regions of decreasing |z 2|. Except for the SP section, as well as low-speed and flow separation regions, the overall number of St + = 16 particles is greater than that of St + = 4 particles because their greater inertia allows them to more easily penetrate the near-wall viscous sublayer.
The capacity of particles to follow the near-wall flow is characterised by the local Stokes number. Figure 14 shows the streamwise evolution of the local St + (panel a) and local St 0.99(panel b),
 \begin{equation} \textit{St}_{0.99}=\frac{\tau _{p}}{\tau _{0.99}}=\frac{\rho _{p}{d}_{p}^{2}}{18\mu }/\left(\frac{\delta _{0.99}}{\overline{U}_{\textit{bulk }}}\right) \end{equation}
for the three particle populations, together with the corresponding boundary-layer thicknesses δ v and δ
0.99, averaged over the range
 $-1\delta _{0}\lt z_{2}\lt 1\delta _{0}$
on the outer sidewall.
Streamwise evolution of the (a) local St
+ and (b) local St
0.99 for the three particle populations, together with the corresponding boundary-layer thicknesses δ
v and δ
0.99, averaged over the range
 $-1\delta _{0}\lt z_{2}\lt 1\delta _{0}$
on the outer sidewall.

Figure 14. Long description
Panel A: A line graph shows the streamwise evolution of local St+ for three particle populations with different St+ values (16, 4, 0.9). The x-axis represents the normalized streamwise position (x1/R) ranging from 6 to 16, and the y-axis on the left represents the local St+ on a logarithmic scale from 1 to 10. The y-axis on the right represents the normalized boundary-layer thickness (δv/δ0) ranging from 0 to 1.5. The graph includes three distinct lines: black squares for St+ = 16, red circles for St+ = 4, and blue triangles for St+ = 0.9. The shaded regions indicate different flow regions: SP, IBP, and DBP. Panel B: Another line graph shows the streamwise evolution of local St0.99 for the same particle populations. The x-axis is the same as in Panel A, and the y-axis on the left represents the local St0.99 on a logarithmic scale from 0.1 to 10. The y-axis on the right represents the normalized boundary-layer thickness (δ0.99/δ0) ranging from 0.81 to 0.99. The graph includes the same three lines as in Panel A. The shaded regions indicate the same flow regions: SP, IBP, and DBP.
In the SP section, the local St + remains nearly constant. Upon entering the concave section, local St + increases continuously along x, closely following the trend of 1/δ v. This variation would conventionally suggest a progressive deterioration of particle tracking ability. However, this trend contradicts the earlier analyses of figures 12 and 13, which demonstrated that the transport capacity of Görtler vortices for inertial particles is markedly enhanced compared with wall turbulence in SP. The discrepancy arises because St +, defined using the near-wall viscous scale δ v, is appropriate for characterising particle behaviour in the near-wall region of flat-plate TBLs, where the dynamics is dominated by small-scale hairpin vortices. In the concave section, however, Görtler vortices induce large-scale motions that span the entire boundary layer (Sun et al. Reference Sun, Sandham and Hu2019; Wang et al. Reference Wang, Wang, Sun, Yang, Zhao and Hu2019), rendering the viscous-scale-based St + inadequate for describing particle response to the dominant flow structures.
To better represent the particle response to the prevailing turbulent scales in the concave region, we introduce an alternative Stokes number, St 0.99, as shown in figure 15(b). Görtler vortices are typically characterised by large-scale motions that extend across the entire boundary-layer thickness; thus, these can conventionally be described using δ 0.99 (Sun et al. Reference Sun, Sandham and Hu2019; Wang et al. Reference Wang, Wang, Sun, Yang, Zhao and Hu2019). In contrast to St +, St 0.99 decreases continuously upon entering the concave section, indicating a sustained enhancement of particle tracking ability relative to the large-scale motions. This trend is consistent with the intensified large-scale turbulent motions induced by the Görtler vortices. The St + = 4 particles drop St 0.99 < 1, while the St + = 0.9 particles maintain St 0.99 ≪ 1 throughout, confirming their excellent flow-following capability with respect to the boundary-layer-scale motions.
Time averaged velocity profiles for St
+ = 16 at different x
1/R. Left axes: time-averaged
 ${v}_{n}$
/a
0 and gas-phase streamlines. Right axes: the time-averaged
 ${v}$
p,τ
/a
0 and the time-averaged particle streamline. Blue lines are isoline of Φ
p
= 1 × 10⁻⁹.

In the DBP, where Görtler vortices progressively decay, both St + and St 0.99 regain their relevance as key metrics for assessing particle-following behaviour in the near-wall region. As shown in figure 14, both local St + and St 0.99 increase with streamwise distance, reflecting the diminished capacity of particles to follow the near-wall turbulent fluctuations. This increase is particularly pronounced for the St + = 16 particles, for which both Stokes numbers exceed unity in the DBP, indicating a significant deterioration of flow-following ability. In contrast, the St + = 4 particles retain comparatively good tracking capability, with St 0.99 remaining close to unity. This contrast elucidates why, in the central-plane view of figure 5, the St + = 4 particles appear more numerous than their St + = 16 counterparts: the higher-inertia particles are largely confined to the near-wall region and are thus less visible in the core flow. Overall, larger St + particles exhibit higher local St + and St 0.99, which will be shown in the subsequent analysis to lead to enhanced near-wall particle accumulation on the outer side.
Notably, the streamwise evolution of both St + and St 0.99 deviates from the trends established in the IBP, a transition that is primarily attributed to the pressure-gradient reversal induced by expansion waves emanating from the inner wall (Chen et al. Reference Chen, Liang, Yang, Sun, Long, Li, Wang, Xiong and Wang2024) as shown in figure 11. It may therefore be inferred that these expansion waves elevate the local Stokes numbers, implying a reduction in the turbulent transport capacity for particles. Such a mechanism is unique to supersonic curved-pipe flows and has no analogue in subsonic regimes.
4.3. Large-scale circumferential movement
The motions of flow and particle are further explained by wall-normal slices. Figures 15 and 16 present the time-averaged centripetal velocity (
 ${v}_{n}$
/a
0, left axes), the time-averaged particle circumferential velocity (
 ${v}$
p,τ
/a
0, right axes) and the time-averaged streamline distributions for the St
+ = 16 and St
+ = 4 cases, respectively.
Time-averaged velocity profiles for St
+ = 4 at different x
1/R. Left axes: time-averaged
 ${v}_{n}$
/a
0 and gas-phase streamlines. Right axes: the time-averaged
 ${v}$
p,τ
/a
0 and the time-averaged particle streamline. Blue lines are isolines of Φ
p
= 1 × 10⁻⁹.

Figure 16. Long description
Panel A: A contour plot with overlaid streamlines. The horizontal axis is labeled x1/R = 10 and ranges from −1.0 to 1.0. The vertical axis ranges from −1.0 to 1.0. The contour plot shows isolines of p = 1 109 in blue. The streamlines indicate the gas-phase flow. Panel B: A contour plot with overlaid streamlines. The horizontal axis is labeled x1/R = 11 and ranges from −1.0 to 1.0. The vertical axis ranges from −1.0 to 1.0. The contour plot shows isolines of p = 1 109 in blue. The streamlines indicate the gas-phase flow. Panel C: A contour plot with overlaid streamlines. The horizontal axis is labeled x1/R = 13 and ranges from −1.0 to 1.0. The vertical axis ranges from −1.0 to 1.0. The contour plot shows isolines of p = 1 109 in blue. The streamlines indicate the gas-phase flow. Panel D: A contour plot with overlaid streamlines. The horizontal axis is labeled x1/R = 14 and ranges from −1.0 to 1.0. The vertical axis ranges from −1.0 to 1.0. The contour plot shows isolines of p = 1 109 in blue. The streamlines indicate the gas-phase flow. Panel E: A contour plot with overlaid streamlines. The horizontal axis is labeled x1/R = 15 and ranges from −1.0 to 1.0. The vertical axis ranges from −1.0 to 1.0. The contour plot shows isolines of p = 1 109 in blue. The streamlines indicate the gas-phase flow. Panel F: A contour plot with overlaid streamlines. The horizontal axis is labeled x1/R = 16 and ranges from −1.0 to 1.0. The vertical axis ranges from −1.0 to 1.0. The contour plot shows isolines of p = 1 109 in blue. The streamlines indicate the gas-phase flow.
We first consider the structures of the fluid flows. From the time-averaged streamlines (left axes), the centrifugal effect due to streamwise curvature drives fluid towards the outer wall. Upon impinging on the wall, the flow is redirected circumferentially towards both lateral sides. Constrained by the sidewalls, an initial Dean-type vortex begins to form beyond x 1/R > 10, which then develops streamwise while migrating inward. A distinctive feature compared with subsonic curved-pipe flows emerges around x 1/R = 14–15: the Dean vortex shifts abruptly towards the inner side, while a secondary vortex appears within the near-wall low-speed layer. This behaviour originates from a flow-separation bubble with negative streamwise velocity that forms near x 1/R ≈ 12. The high shear between this bubble and the main flow generates a shear-induced secondary vortex. As the shear weakens downstream, the secondary vortex gradually dissipates and vanishes after x 1/R > 15, allowing the Dean vortex to return to its characteristic position in the pipe centre. Additionally, the low-speed region encroaches upon the space, which significantly differs from the single Dean-vortex structure typical of subsonic curved-pipe flows.
The particle motions, however, differ markedly for these two particle populations. In both cases, the particle-blank region (Φp <1 × 10⁻⁹) near the pipe centre shifts progressively outward with increasing x. This outward migration is more significant for the St + = 16 particles because the concave wall compresses their layer against the outer side more intensely than it does for the St + = 4 particles. Furthermore, the compression wave that impinges on the outer wall near x 1/R ≈ 14 deflects the interface between the low-speed region and the core flow inward, which in turn drives the particle layer inward. Owing to their higher inertia, St + = 16 particles cannot adjust promptly to this deflection and tend to preserve their outward-directed motion. In contrast, St + = 4 particles follow the deflected interface closely. As a result, the particle-blank region in the St + = 4 case remains located closer to the pipe centre. This inertia-dependent response to a wave-induced flow deflection represents a characteristic feature that distinguishes supersonic from subsonic curved-pipe flows, where such compressive waves are absent. The mechanism is consistent with earlier findings (Yang et al. Reference Yang, Li, Mai, Liu, Li, Wang, Xiao and Sun2024b ). When a pressure imbalance exists across a mixing layer, the layer itself shifts along the pressure gradient, but particle motion lags, thereby altering the relative distribution between the particles and the carrier phase.
Transient circumferential motion of St
+ = 16 particles; particles are shown by their velocity vector and turbulence is shown by
 ${v}_{n}$
/a
0. The blue curve surrounding the slice represents the normalised particle count within each π/180 rad interval and within y
2/δ
0 ≤ 1. Local enlarged views are Görtler vortices.

Additionally, the streamlines of St + = 4 particles exhibit a near-symmetry feature about the z = 0 plane and align closely with the streamlines of the fluid flow, proving their excellent flow-following ability. This capability is further evidenced by their presence even within the secondary vortex that develops in the near-wall low-speed layer. In contrast, St + = 16 particles scarcely follow the Dean-vortex motion, appear only sparingly in the low-speed layer and are entirely absent from the secondary vortex structure. Along the lateral walls in the region 13 ≤ x 1/R ≤ 16, the streamlines of St + = 16 particles impinge directly on the wall. After impact, their velocity drops abruptly, leading to local accumulation and the high-frequency collisions previously documented in figure 10. Consequently, the streamline distribution of St + = 16 particles shows poor symmetry about the z= 0 plane, highlighting their limited ability to adjust to the organised vortical motions in the bend.
Figure 17 displays the wall-normal velocity (
 ${v}_{n}$
) and streamlines at several streamwise stations, together with the spatial and circumferential distribution of St
+ = 16 particles within a thin slice (x
1 ± 0.01R) extending up to y
2/δ
0 ≤ 1. At x
1/R= 9, ejection and sweep events are distributed nearly uniformly in the circumferential direction, resulting in approximately uniform fluctuations in particle count and particle-layer thickness. The mean wall-normal particle velocity (
 ${v}_{n}$
,
p
) remains close to zero, resembling the behaviour typical of a flat-plate turbulent boundary layer. Beyond x
1/R ≥ 10, centrifugal forcing induced by the streamwise wall curvature deflects the streamlines outward. Specifically, in the upper half (z > 0), the gas exhibits a centripetal motion (
 ${v}_{n}$
> 0), while in the lower half (z < 0), the motion is centrifugal (
 ${v}_{n}$
< 0). From x
1/R ≥ 11 onward, a pair of larger-scale Dean vortices emerges on either side of the pipe. These vortices grow and intensify downstream, continuously transporting particles towards the outer wall. Consequently, the particle concentration on the inner side gradually diminishes, while it increases on the outer side, which is a clear signature of curvature-driven particle redistribution by organised secondary flows.
Beyond x
1
/R ≥ 13, however, the particle concentration on the outer side (θ = −π/2) begins to decline again with streamwise distance. This occurs because the now fully developed Dean vortices advect particles near the outer wall towards both lateral sides of the pipe. Due to their large inertia, St
+ = 16 particles cannot follow the Dean-vortex motion continuously along the wall towards the inner side. Instead, they accumulate against the lateral walls (approximately at θ = −3π/4 and −π/4). Consequently, the particle number peaks at these lateral locations. Meanwhile, a pipe-radius-scale region with
 ${v}_{n}$
> 0 persists on the inner side, corresponding to the low-speed zone that contains very few particles, which will be explained later.
On the concave outer wall, Görtler vortices develop near the bottom. The ‘mushroom-shaped’ structures highlighted by dashed boxes in figure 17 are a classic signature of such vortices (Sun et al. Reference Sun, Sandham and Hu2019; Wang et al. Reference Wang, Wang, Sun, Yang, Zhao and Hu2019). These vortices lift low-speed fluid away from the wall while sweeping high-speed fluid towards it. When the high-speed fluid approaches the low-speed region, its trajectory is sharply deflected, forming the characteristic mushroom shape. If particle inertia is sufficiently high, particles carried by the high-speed fluid cannot adjust promptly to this deflection and are consequently ejected into the uplifted low-speed fluid, forming local accumulations. In this way, Görtler vortices effectively lift particles and enlarge the interface between high- and low-speed fluid regions, thereby enhancing the entrainment of particles into the low-speed zone (Yang et al. Reference Yang, Long, Xiao, Li, Xiong, Wang, Li and Sun2025b
). This mechanism explains the pronounced peak in particle count within
 ${v}_{n}$
> 0 regions on the outer side in the interval 10 < x
1/R < 13.
Figure 18 shows the instantaneous wall-normal velocity (
 ${v}_{n}$
) fields at selected streamwise stations for St
+ = 4 particles. Under the influence of curvature, the overall transport pattern of these particles shares basic similarities with that of the St
+ = 16 case. Nevertheless, several distinct differences emerge, as outlined in the following. Near the outer wall, Görtler vortices do not induce pronounced particle accumulation for St
+ = 4 particles. At every streamwise location in the curved section, the concentration of St
+ = 4 particles near the inner upper wall is markedly higher than that of St
+ = 16 particles. A clear peak in particle count appears at x
1/R = 13, which coincides with the flow-separation zone identified in figure 6. A large number of particles reside within this low-speed region, having been advected from the outer side primarily by Dean vortices. Moreover, within the cores of the Dean vortices (x
1/R = 15 and 16), the population of St
+ = 4 particles substantially exceeds that of St
+ = 16 particles. In sharp contrast, at the lateral positions θ = −3π/4 and −π/4, local accumulation of St
+ = 4 particles is significantly weaker, resulting in a much lower particle count compared with the St
+ = 16 case. These distributional contrasts stem primarily from the superior flow-tracking ability of the St
+ = 4 particles, which enables them to follow organised secondary motions, such as Dean vortices and separation-zone recirculation, more closely than their higher-inertia counterparts.
Transient circumferential motion of St
+ = 4 particles; turbulence is shown by
 ${v}_{n}$
/a
0, particles are by their velocity vector, the blue curve surrounding the slice represents the normalised particle count within each π/180 rad interval and within y
2/δ
0 ≤ 1.

Instantaneous u/a 0 and particle distribution, and time-averaged u/a 0 and particle streamlines at z = 0. Panels (a) and (b) are for the St + = 16 and St + = 4 cases, respectively, shown by their velocity vector. Panel (c) is time-averaged u/a 0, green and black lines are St + = 16 and St + = 4 particle streamlines, respectively.

Figure 19. Long description
Panel A: A scatter plot shows particle distribution and velocity vectors for St+ = 16. The horizontal axis is labeled x/R and the vertical axis is labeled y/R. The plot features regions labeled as low-speed region, shear layer, expansion waves, compression waves, and areas where particles accumulate in the wall. Panel B: A scatter plot shows particle distribution and velocity vectors for St+ = 4. The horizontal axis is labeled x/R and the vertical axis is labeled y/R. The plot features regions labeled as flow-separated region, shear layer, expansion waves, compression waves, and areas where particles are raised. Panel C: A line graph shows time-averaged u/a0 with particle streamlines for St+ = 16 and St+ = 4. The horizontal axis is labeled x1/R and the vertical axis is labeled y1/R. The graph includes labels for flow-separated point, flow reattachment point, shear layer, expansion waves, compression waves, separated wave, external edge of particle flows, and reflected wave.
4.4. Particle motions on the inner side
Finally, the flow organisation and particle distribution on the convex side (inner side) are discussed separately. Figures 19(a) and 19(b) respectively display contours of normalised streamwise velocity (u/a 0) and the corresponding particle positions, while panel (c) presents the time-averaged u/a 0 field in the (x 1,y 1,z 1) coordinate system together with particle streamlines on the symmetry plane z = 0. The gas-phase flow is essentially identical in both particle-laden cases. On the inner (convex) side, wall curvature causes flow expansion, leading to a separation bubble followed by a low-speed region. Within the bubble, u/a 0 becomes negative; flow reattachment occurs further downstream and velocities in the low-speed zone remain below 1.0. The velocity difference between this low-speed region and the high-speed core flow establishes a well-defined shear layer. The major wave structures – compression waves, expansion waves, and shock waves – are schematically indicated by dashed lines, as identified from the density gradient field. Similar wave patterns are also observed by Chen et al. (Reference Chen, Liang, Yang, Sun, Long, Li, Wang, Xiong and Wang2024). The wave structures further shape the flow structures. On the outer (concave) side, wall compression generates compression waves that impinge on the shear layer, reflect and cause the entire shear layer to deflect inward. The separation bubble also induces a separation shock that propagates upstream and strikes the outer wall near x 1/R ≈ 15. Meanwhile, flow expansion gives rise to a train of expansion waves that interact with the outer wall.
The initial location of the shear layer plays a critical role in particle entrainment. As visible in figure 19(a), the higher inertia of St + = 16 particles allows them to penetrate further downstream, largely bypassing the initial shear layer. In contrast, St + = 4 particles are readily entrained into this layer and subsequently trapped within the flow-separation zone, where streamwise velocities are very low or even negative. This explains the elevated particle number fraction of St + = 4 particles in the incipient separation region, as previously noted in figure 6(b). When compression waves impinge on the shear layer and deflect it inward, the particle layer follows a similar deflection. Owing to their superior flow tracking ability, St + = 4 particles exhibit a more pronounced inward shift. On the outer side, St + = 16 particles show a stronger tendency to compress against the wall and accumulate there, while St + = 4 particles are more susceptible to being lifted by near-wall turbulent motions, resulting in a generally thicker particle layer for the lower-inertia population. These inertia-driven differences in particle transport are further visualised by the time-averaged particle streamlines presented in figure 19(c), which distinctly illustrate how particle trajectories respond to curvature-induced flow features in the supersonic bent pipe. These complex wave-induced modifications to particle distribution and turbulent behaviour are certainly absent in incompressible flows.
Figure 20 visualises the motions and distributions of St
+ = 16 and St
+ = 4 particles near the flow-separation and low-speed regions, using an isosurface of u/a
0 = 1 coloured by the local centripetal velocity
 ${v}_{n}$
/a
0. The isosurface shows that near the symmetry plane (z = 0, θ = 0.5π),
 ${v}_{n}$
is predominantly positive, whereas on both sides, it is mainly negative. This pattern confirms that fluid from the outer side primarily enters the low-speed and separation zones through their lateral flanks, driven by Dean vortices. Consistent with the description in figure 19, a substantial number of St
+ = 4 particles are present within the initial shear layer (10 < x
1/R < 12). Moreover, a distinct concentration of particles is observed along both sides of the low-speed and separation regions. These particles are almost entirely advected into these zones, especially in the St
+ = 4 case. At the z = 0 symmetry plane, the particles exhibit predominantly positive
 ${v}_{n}$
, indicating that they are filling towards the pipe core. These findings reveal that particles within the low-speed regions originate from two distinct pathways: (i) direct entrainment at the upstream edge of the developing shear layer; and (ii) lateral transport by Dean vortices along the sides of these zones, which is particularly effective for lower-inertia particles.
Instantaneous behaviour of (a) St
+ = 16 and (b) St
+ = 4 particles near the iso-surface of u/a
0 = 1. The iso-surface is coloured by
 ${v}_{n}$
/a
0. Particles are shown by their velocity vector and coloured by
 ${v}$
n,p
/a
0. Note that this is a perspective that looks from the outside towards the inside.

In fact, these behaviours stem from the coupled action of streamwise curvature, circumferential confinement and compressibility in the bent pipe. The particle transport in the supersonic curved pipe follows a multi-stage pathway fundamentally different from the subsonic paradigm. The streamwise curvature drives centrifugal flow towards the outer wall, while the circumferential confinement redirects the flow into Dean vortices in both flow regimes. However, the high-speed flow in the supersonic case additionally triggers a pronounced flow separation, which significantly modifies the spatial organisation of both Dean vortices and particles. As a result, particles are advected circumferentially by Dean vortices, and are either trapped or carried further inward as they encounter the low-speed region. In a subsonic bend pipe, particles are merely conveyed circumferentially by Dean vortices without the additional modulation by strong separation and secondary vortices (Saffar et al. Reference Saffar, Kashanj, Nobes and Sabbagh2023; Zahtila et al. Reference Zahtila, Chan, Ooi and Philip2023; Erraghroughi et al. Reference Erraghroughi, Bah, El Maakoul and Abdellah2024). This distinct pathway highlights the essential role of compressibility effects in establishing the unique particle transport characteristics of supersonic curved-pipe flows.
5. Summaries of particle behaviours in curved pipes
5.1. Influence of st + on the particle dispersion
Figure 21 presents the integrated particle number fraction
 $\varphi _{p,\textit{int}}={\int }_{0}^{\delta _{0}}\varphi _{p}\,{\rm d}y_{2}$
as a function of azimuthal angle θ at six streamwise locations for St
+ = 0.9, 4 and 16. In the straight section, φ
p,int
is uniformly distributed along the azimuthal direction, with St
+ = 4 exhibiting the strongest near-wall accumulation according to § 4.1. Upon entering the concave bend, the outer-side φ
p,int
for all three populations increases downstream and then declines, with St
+ = 16 and 4 peaking at
 $x_{1}/R=13.33$
, slightly later than St
+ = 0.9. According to the analysis in § 4.2, the wall blockage on the concave surface facilitates particle penetration from the outer edge of the boundary layer into the near-wall region, while simultaneously inducing Görtler vortices. Both mechanisms promote particle accumulation on the outer wall and their effects intensify with increasing St
+, leading to larger φ
p,int
for higher-inertia particles. However, for St
+ = 0.9, the outer side shows little variation with streamwise direction for
 $x_{1}/R\leq 13.33$
because these particles closely follow the Görtler vortices and are not selectively accumulated by the vortex motions.
Variation of φ p,int along θ near the wall at different streamwise locations x 1.

Figure 21. Long description
Panel A: A line graph shows the variation of a parameter along the wall at a streamwise location x1/R = 9.7. The x-axis represents the angle θ/π ranging from −0.4 to 0.4, and the y-axis represents the parameter φp ranging from 1 x 10^11 to 1 x 10^12. Three data series are plotted: one with black squares, one with red circles, and one with blue triangles. Panel B: A line graph shows the variation of a parameter along the wall at a streamwise location x1/R = 10.9. The x-axis represents the angle θ/π ranging from −0.4 to 0.4, and the y-axis represents the parameter φp ranging from 1 x 10^11 to 1 x 10^12. Three data series are plotted: one with black squares, one with red circles, and one with blue triangles. Panel C: A line graph shows the variation of a parameter along the wall at a streamwise location x1/R = 12.1. The x-axis represents the angle θ/π ranging from −0.4 to 0.4, and the y-axis represents the parameter φp ranging from 1 x 10^11 to 1 x 10^12. Three data series are plotted: one with black squares, one with red circles, and one with blue triangles. Panel D: A line graph shows the variation of a parameter along the wall at a streamwise location x1/R = 13.3. The x-axis represents the angle θ/π ranging from −0.4 to 0.4, and the y-axis represents the parameter φp ranging from 1 x 10^11 to 1 x 10^12. Three data series are plotted: one with black squares, one with red circles, and one with blue triangles. Panel E: A line graph shows the variation of a parameter along the wall at a streamwise location x1/R = 14.5. The x-axis represents the angle θ/π ranging from −0.4 to 0.4, and the y-axis represents the parameter φp ranging from 1 x 10^11 to 1 x 10^12. Three data series are plotted: one with black squares, one with red circles, and one with blue triangles. Panel F: A line graph shows the variation of a parameter along the wall at a streamwise location x1/R = 15.8. The x-axis represents the angle θ/π ranging from −0.4 to 0.4, and the y-axis represents the parameter φp ranging from 1 x 10^11 to 1 x 10^12. Three data series are plotted: one with black squares, one with red circles, and one with blue triangles.
As discussed in § 4.4, particles on the inner side tend to fill towards the pipe core and escape from the boundary layer, leading to an initial decrease in φ p, int , especially for larger St +. Subsequently, as discussed in § 4.3, the streamwise-developing Dean vortices continuously transport particles from the outer side toward the inner side, causing φ p, int to increase once again on the inner side, while reducing the outer-side population. This transport is more effective for smaller St + particles, which are more readily entrained by the Dean vortices, resulting in higher inner-side particle concentrations for lower St + populations. The non-monotonic behaviour of the φp, int thus reflects the competition between Görtler and Dean vortices: Görtler vortices preferentially accumulate large particles on the outer wall, while the progressively intensifying Dean vortices increasingly sweep particles towards the inner side, reducing the outer-side population beyond the peak. As the Dean vortices become fully established, the inner–outer concentration difference gradually diminishes. Nonetheless, residual inertia-dependent segregation persists: smaller particles (St + = 0.9 and 4) preferentially reside in the inner low-speed region, whereas larger particles (St + = 16) tend to accumulate near the lateral walls.
Figure 22 compares the azimuthally averaged wall-collision frequency per Tc
, and the particle volume flux (Ψp
) for St
+ = 16, 4 and 0.9 particles within y
2/δ
0 = 0.01, at different streamwise locations. Here, Ψp
, defined as
 ${\unicode[Arial]{x03A8}} _{p}=\overline{v_{n,p}}{\Phi} _{p}$
, quantifies the ability of the particle-laden flow to penetrate the viscous sublayer and directly reflects the impact frequency on the wall.
Comparison of particle volume flux Ψp (left axes) and wall-collision frequency per T c (right axes) for three particles along the azimuthal direction at selected streamwise locations.

Upon entering the bend region, the collision frequency and Ψp
peak at the two lateral sidewalls of the pipe, with the peak position shifting towards larger θ as St
+ decreases, which is consistent with the instantaneous results shown in § 4.2. Meanwhile, the collision frequency on the inner wall remains nearly zero. Across the entire concave surface, the larger-inertia particles exhibit higher collision frequencies and larger Ψp
. Furthermore, for large particles, Ψp
is almost consistently negative and aligns with
 $\overline{v_{n,p}}$
, indicating that particles in the very near-wall region are predominantly centrifugally oriented – that is, they persistently move towards the wall. This behaviour arises because larger particles transported by sweep events retain sufficient momentum to traverse the viscous sublayer with less deceleration, thereby reaching the wall more frequently. In addition, large particles tend to escape from the confinement of Dean vortices, which further promotes wall impingement.
In contrast, the St + = 0.9 particles consistently maintain relatively low collision frequency and Ψp (nearly zero) in overall θ. For St + = 16 and 4 particle populations, the collision frequency and Ψp increase with streamwise distance in the initial bend. Beyond x 1/R≈ 13, however, the collision frequency declines for all particle types. This decrease is primarily attributed to a reduction in Ψp , caused by a decrease in the near-wall particle number fraction, as discussed in figure 21. This further suggests that reducing particle mass mitigates wall erosion on the vehicle surfaces.
5.2. Force acting on particles
Figure 23 presents the streamwise evolution of the instantaneous acceleration ratios (i.e. the ratio of drag force
 $| F_{D}| /(| F_{D}| +| F_{am}| +| F_{P}| )$
) for the three forces, sampled along the inner side (y
1 > 0) on the central slice (z = 0). The results clearly show that the
 $| F_{D}|$
dominates the particle dynamics throughout most of the domain. This dominance is followed by the
 $| F_{am}|$
, with the
 $| F_{P}|$
being the smallest among the three. The
 $| F_{D}|$
decreases appreciably after x
1/R = 13, where the particles experience strong compression waves; in this region, the
 $| F_{am}|$
increases rapidly, particularly for the St
+ = 16 particles. Further downstream, as the wave system gradually weakens, the
 $| F_{am}|$
diminishes and the drag force regains its dominance. It is also observed that the
 $| F_{am}|$
increases with particle inertia, with larger contributions for the St
+ = 16 particles. The
 $| F_{P}|$
, although exhibiting a noticeable increase in the initial turning region where the pressure gradient is enhanced, consistently remains below 10 % of the total force; moreover, its contribution decreases with increasing Stokes number. In summary, the Stokes drag remains the primary force governing particle motion in the supersonic curved pipe, while the added-mass force becomes non-negligible locally in the vicinity of compression waves.
Streamwise evolution of instantaneous acceleration ratios for the
 $| F_{D}| , | F_{am}|$
and
 $| F_{P}|$
along the inner side of the central slice (z = 0).

Figures 24 and 25 present the streamwise evolution of the time-averaged streamwise velocity-squared difference,
 $-{\unicode[Arial]{x0394}} {\overline{u}^{2}}_{1}=-({\overline{u}^{2}}_{f,1}-{\overline{u}^{2}}_{p,1})/{u^{2}}_{\tau }$
, and the corresponding aerodynamic drag force,
 $\overline{F_{D,{x}}}R/{\alpha }_{0}^{2}$
, for three particle populations at y
2 < 0.01δ
0 along different θ. Here,
 $\overline{F_{D,{x}}}=0.75\rho _{seen}C_{d}| \overline{U_{s,1}}| \overline{U_{s,1}}/\rho _{p}d_{p}$
, where the overbar denotes time averaging, and
 $\overline{U_{s,1}}=\overline{u_{1}}-\overline{u_{p,1}}$
is the streamwise slip velocity in the straightened coordinate system (x
1, y
1, z
1). The drag force (or particle acceleration) is governed by the local
 $\overline{U_{s,1}}$
: smaller
 $\overline{U_{s,1}}$
indicates better flow-following, while larger
 $\overline{U_{s,1}}$
reflects stronger interphase momentum transfer. The trends of
 $\overline{U_{s,1}}$
and
 $\overline{F_{D,{x}}}$
are correlated, confirming
 $\overline{U_{s,1}}$
as a direct measure of interphase momentum transfer in the curved supersonic flow (Wang et al. Reference Wang, Zhou and Zheng2024).
Streamwise variation of the
 $-{\unicode[Arial]{x0394}} {\overline{u}^{2}}_{1}$
within y
2< 0.01δ
0
along different
 $\theta$
. The inset in panel (a) provides a
 ${\unicode[Arial]{x0394}} {\overline{u}^{2}}_{1}$
due to logarithmic scale.

Figure 24. Long description
The image contains five line graphs stacked vertically, each representing different angles (θ) and showing the streamwise variation of a parameter. The x-axis is labeled x1/R, and the y-axis is labeled −(u2f − u2p)/uτ^2. Each graph includes three data series: black squares, red circles, and blue triangles, corresponding to different St+ values (16, 4, and 0.9, respectively). The angles θ for each graph are 0.46π, 0.3π, −0.02π, −0.34π, and −0.5π. The inset in the top graph provides a zoomed-in view of the data due to the logarithmic scale. The graphs show variations in the parameter across different streamwise positions and angles, with distinct trends for each St+ value.
Streamwise variation of the
 $\overline{F_{D,{x}}}R/{\alpha }_{0}^{2}$
within y
2 < 0.01δ
0 along different
 $\theta$
.

Figure 24 shows that, in most near-wall regions, u p,1 > u f,1. This is because near-wall inertial particles are less constrained by the no-slip condition and tend to retain their original velocity, yielding a positive slip (Yu et al. Reference Yu, Zhao, Yuan and Xu2024). Moreover, most near-wall particles originate from outer-layer turbulent sweeps, carrying velocities higher than the near-wall fluid. However, at θ = 0.46π within 8 < x 1/R < 12 (the initial inner-side turning region), u p,1 < u f,1. This corresponds to the expansion-wave-accelerated flow, to which particles exhibit a delayed response that increases with St +, as shown by the positive velocity-squared difference in the inset of figure 24(a). The velocity-squared difference develops downstream, most prominently on both lateral sides (figure 24 c), where Dean vortices continuously transport high-momentum particles towards the wall (§ 4.3). At all θ, St + = 0.9 particles exhibit negligible velocity differences, confirming excellent flow-following ability. The velocity-squared difference increases with St +, being largest on the lateral sides (figure 24 c), corresponding to the interface between inner and outer sides. Furthermore, downstream of figure 24(a,b), the velocity-squared differences for all three populations increase, corresponding to the low-speed separation zone: particles entering this zone from the supersonic mainstream retain high velocities, even for St + = 0.9, as discussed in § 4.4.
Correspondingly,
 $\overline{F_{D,{x}}}$
is negative in most near-wall regions, indicating flow deceleration of particles. Positive
 $\overline{F_{D,{x}}}$
occurs predominantly for St
+ = 0.9, indicating flow acceleration of these particles. In several regions, a large slip velocity is accompanied by a relatively small drag force – e.g. in the expansion-acceleration zone 8 < x
1/R < 12, where the expanding flow accelerates all three populations, and in the separation zone downstream of θ = 0.46, where the low-speed separated flow decelerates them. However, due to the extremely small mass of St
+ = 0.9 particles, their drag force is significantly larger than for the other two populations. Similar to figure 24, θ = 0.02π. (the lateral sides, i.e. the interface of inner–outer side) in the downstream bend, significant drag forces are also observed, increasing with St
+, due to the much larger relative velocity of high-St
+ particles there.
The
 $-{\unicode[Arial]{x0394}} {\overline{u}^{2}}_{1}$
also implies the streamwise centripetal acceleration difference between the fluid,
 $\overline{{u}_{f,1}^{2}}/R^{*}$
, and the particles,
 $\overline{{u}_{p,1}^{2}}/R^{*}$
. A larger difference indicates a greater tendency for particles to escape from the flow and undergo centrifugal motion. Evidently, in the downstream bend, especially on the lateral sides, particles exhibit a strong centrifugal tendency. Therefore, even though the flow provides a larger aerodynamic drag force in this region, it remains insufficient to prevent particles from undergoing centrifugal motion, particularly for the high-inertia particles. These observations demonstrate that the lateral sidewalls impose the strongest streamwise curvature effect on particles, manifested as the largest velocity-squared difference and the most significant aerodynamic drag force, both intensifying with increasing St
+.
Figure 26 plots the circumferentially centripetal slip velocities
 ${\unicode[Arial]{x0394}} \overline{V_{n}}=\overline{v_{n}}-\overline{v_{n,p}}$
(left axes) and
 $\overline{{V}_{n,f}^{2}}-\overline{{V}_{n,p}^{2}}$
(right axes) along the θ at different streamwise direction. Recall figures 17 and 18, where Dean vortices advect the fluid inward towards the pipe centre. Nevertheless, the slip velocity remains positive over almost the entire domain, indicating that particles retain a net centrifugal bias relative to the fluid. In other words, they tend to escape the organising influence of the Dean vortices and move to the wall. This overall tendency is consistent with the slip-velocity behaviour shown in figure 24. A more pronounced jump occurs at θ ≈ 0 on the inner side (θ < 0) for x
1/R > 11, corresponding to the azimuthal transition from concave to convex curvature. Here, wall confinement is strongest and the tendency of particles to separate from the gas phase becomes most evident. A slight jump in the velocity difference appears in the regions of θ > 0.25 on outer side (θ > 0), where particles are transported and trapped into the low-speed separation region. The
 $\overline{{V}_{n,f}^{2}}-\overline{{V}_{n,p}^{2}}$
also implies the circumferential centripetal acceleration difference between the fluid and the particle. This indicates that the position near
 $\theta =0$
slightly towards the outer side experiences the strongest circumferential centrifugal effects. Consequently, this region exhibits high particle accumulation, significant slip velocities and elevated wall collision rates, as summarized in §§ 3, 4.2, 4.3 and 5.1. These findings are of particular relevance to the study of supersonic particle-laden flows in curved geometries.
Centripetal streamwise slip velocity
 ${\unicode[Arial]{x0394}} \overline{V_{{n}}}$
(left axes) and centripetal force (right axes) along with θwithin y
2 = 0.001δ
0 at different x/R.

Figure 26. Long description
Six line graphs illustrate the centripetal streamwise slip velocity and centripetal force at various positions. Panel A shows data for x1/R = 9.7, Panel B for x1/R = 10.9, Panel C for x1/R = 12.1, Panel D for x1/R = 13.3, Panel E for x1/R = 14.5, and Panel F for x1/R = 15.8. Each graph has two y-axes: the left y-axis represents the centripetal streamwise slip velocity (ΔV–n = V–nf − V–np), and the right y-axis represents the centripetal force ((V–nf^2 − V–np^2)R/ut^2R). The x-axis represents the angle θ/π. Different symbols and colors represent different Stokes numbers (St+): squares for St+ = 16, circles for St+ = 4, and triangles for St+ = 0.9. The graphs show how these values change with the angle θ/π for each position x1/R.
5.3. Mean particle trajectories
Several representative particle trajectories are extracted to summarise the inertia-dependent particle dynamics. Figure 27 visualises selected turbulent features of the fluid phase using isosurfaces of the time-averaged density gradient
 $| \boldsymbol{\nabla }\overline{\rho }| \delta _{0}/\rho _{0}$
and velocity
 $\overline{u}/a_{0}$
. Figure 28 provides a direct comparison between mean fluid streamlines and mean particle trajectories to illustrate the organisation of turbulent structures and particle responses in the supersonic straight-to-curved pipe. As given in figure 28, seven initial points (A–G) are placed and marked in the SP. Their downstream evolution is tracked separately. The corresponding fluid streamlines terminate at points A′–G′, and the particle trajectories at points A″–G″. Fluid streamlines are coloured by their spanwise position z
1/R, while particle trajectories are coloured by the normalised particle spanwise velocity
 $\overline{w}_{p}$
/a
0.
Turbulence near the wall in a pipe. The separated flow is shown by an iso-surface of
 $\overline{u}/a_{0}$
= 0, the turbulence boundary layer is shown by an iso-surface of
 $0.99u_{0}$
, the secondary vortex in the low-speed layer is shown by an iso-surface of
 $\overline{u}/a_{0}$
= 1.5. The waves are shown by an iso-surface of
 $\ | \boldsymbol{\nabla }\overline{\rho }| \delta _{0}/\rho _{0}$
= 5.

Time-averaged turbulence and St
+ = 16 particles behaviours. Seven initial points A–G at SP connect seven A′–G′ points and A′′–G′′ points in the pipe, representing gas streamlines and particle streamlines, respectively. Gas streamlines are coloured by spanwise location z
1/R. Four wall-normal slices are shown by Φp
. The z = 0 plane shows the time-averaged
 $\overline{u}/a_{0}$
. Points F, E, D, C and A are at y
2 = 0.005δ
0
with θ = −0.5π, −0.25π, 0π, 0.25π and 0.5π, respectively; B and G are at y
2 = 0.72δ
0 with θ = −0.5π and 0.5π.

Figure 28. Long description
A diagram of particle behavior in a fluid flow within a curved pipe. The diagram shows the distribution and movement of particles along the pipe, with various labeled points indicating specific locations and behaviors. The pipe is divided into sections with labels such as SP, IBP, and DBP, indicating different regions of particle behavior. Points A to G mark initial positions of particles, and their streamlines are shown in different colors to represent their spanwise location z1/R. The diagram includes annotations explaining particle movement, such as ‘Particles almost follow with gas in SP section’ and ‘Particles accumulate in the bottom wall and controlled by Götler vortex’. The flow separation and low-speed region are also highlighted, showing how particles are transported by Dean vortex and move toward the base wall before impacting the side wall.
In the supersonic curved pipe, the combined effects of circumferential confinement, strong flow compressibility and centrifugal forcing generate multiple interacting flow structures. The underlying flow organisation can be summarised as follows. Streamwise centrifugal action and compressibility result in the outer-side (concave-wall) flow to compress and decelerate, forming compression waves, while the inner-side (convex-wall) flow expands and accelerates, producing expansion waves, as exemplified by fluid streamline BB′, which migrates towards the pipe core due to expansion. The inner-side expansion induces a separation bubble followed by a low-speed region. This bubble corresponds to the negative-velocity zone near the central plane z = 0, with the low-speed region located downstream (figure 27). Flow separation occurs near the bubble, followed by gradual reattachment. The large velocity difference between the separation and reattachment points triggers a secondary vortex (discussed in § 4.3), as shown by the iso-surface of
 $\overline{u}/a_{0}=1.5$
in figure 27. The velocity shear between the low-speed region and the core flow establishes a mixing layer, which deflects inward when impacted by the compression wave, as seen in fluid streamline AA′ (recall § 4.4). The compression wave then reflects and merges with the separation shock, forming a complex wave system along the outer side in the DBP, illustrated in figure 27. Additionally, on the outer bottom wall in the IBP, the concave curvature provides a streamwise centrifugal effect that compresses the flow against the wall (e.g. streamline GG′) and can excite Görtler vortices (recall § 4.2). Circumferential confinement also promotes the development of Dean vortices on both lateral sides within the IBP. In the DBP, the fully developed Dean vortices, with a scale comparable to the pipe diameter, transport outer-side fluid along the wall towards the inner side and inner-side fluid along the symmetry plane (z = 0) towards the outer side (recall § 4.3). This motion causes gas streamlines CC′, DD′, EE′ and FF′ to converge along the wall into the inner low-speed region.
The combined influences of wall confinement, compressibility and centrifugal forcing result in distinct, inertia-dependent transport behaviour of the particles. Considering St + = 16 as an example, their trajectories in the SP closely follow the streamlines of the fluid. After entering the BP, however, particles on the inner side deviate earlier from the fluid flow due to their higher inertia, penetrating further towards the pipe core. When interacting with compression waves from the outer side, their trajectories are deflected further inward (see streamlines AA″ and BB″). Particles located in the inner circumferential sector (0.5π < θ < π) separate early from the local fluid flow, but are still carried by Dean vortices into the low-speed region (streamline CC″). By contrast, particles in the outer sector (−π < θ < −0.5π) strike the wall soon after separating and accumulate there; under the combined constraint of circumferential and axial curvature, they cannot be effectively swept inward by Dean vortices (streamlines DD″ and EE″). Similarly, particles near the outer-side symmetry plane (z ≈ 0) are compressed against the wall faster than the gas and are subsequently redirected laterally by Dean vortices (streamlines GG″ and FF″). These mechanisms collectively enhance the Φp in the outer region −0.5π < θ < −0.75π, demonstrating how curvature-induced secondary flows selectively redistribute particles according to inertia.
It should be noted that this schematic omits detailed trajectories for low-inertia particles. These smaller inertia particles follow the fluid motion more closely. Consequently, wall accumulation at locations such as GG″, DD″, EE″ and FF″ is substantially reduced with decreasing inertia. Significant accumulation occurs primarily in regions with a large slip-velocity difference, especially around θ = ±π, where the combined wall constraint from circumferential and axial curvature is strongest. As noted in § 4.3, these zones generate considerable centrifugal forces. Most low-inertia particles are transported inward by Dean vortices along with the fluid flow and enter the inner low-speed layer. Only a small fraction accumulates temporarily at the side walls near θ = ±π; the remainder continues moving inward along the wall until entrained into the inner low-speed region. As a result, the Φp in the low-speed layer increases with decreasing inertia, which is consistent with the quantitative trends presented in § 3 and § 5.1. In contrast, near θ ≈ −0.5π, Görtler vortices produce a pronounced streaky distribution of large-inertia particles, as detailed in § 4.2.
To further clarify how particles respond selectively in different flow regions, we examine three particle behaviours along the representative fluid streamlines AA′–GG′ marked in figure 28. Figure 29 presents the distribution of the local Stokes number (St
t
) based on the large-eddy turnover time scale along these streamlines, defined as the ratio of the particle relaxation time
 $\tau _{p}$
to the local turbulent time scale
 $\tau _{\!f}$
,
 \begin{equation} \textit{St}_{t}=\frac{\tau _{p}}{\tau _{\!f}}=\frac{\tau _{p}}{k/\varepsilon },\quad k=\frac{1}{2}\overline{u'_{\textit{i}}u'_{\textit{i}}},\quad \varepsilon =2\nu \overline{s'_{\textit{ij}}s'_{\textit{ij}}}, \end{equation}
where the large-eddy turnover time is obtained from the turbulent kinetic energy k and dissipation rate ε. The results show that along the outer-side streamlines (FF′, EE′, GG′), starting from x/R ≈ 9, the local St t increases slightly with streamwise distance, with the most marked rise occurring along GG′, implying decreased following ability. Herein, particles tend to preserve their forward momentum, detach from the decelerating gas and drift towards the wall, as reflected in the GG″ trajectory in figure 28. This trend stems from the decelerated gas and increased density due to the compression of the concave outer wall. Then, St t decreases again with increasing x due to the larger scale and developing Dean vortex, until the boundary layer of the outer side is affected by the reflected waves from the inner side. Conversely, along the inner side streamlines (AA′, BB′, CC′), flow expansion and acceleration caused by the convex-wall curvature enhance the gas-phase transport capacity, leading to a gradual decrease in local St t with increasing x. These streamlines are carried by Dean vortices into the expanding, accelerating environment on the inner side.
(a–d) Local St t along different gas streamlines AA′ to GG′; (e–g) the starting point on the inner side (red) and on the outer side (blue).

The St + = 0.9 particles exhibit St t < 1 in most regions, confirming their good flow-following capability, similar to tracer particles. However, the higher inertia particles with St t > 1 leads them to maintain their initial momentum, causing an early departure from airflow control and allowing deeper penetration into the pipe core, as observed in trajectories AA″ and BB″ in figure 28. Increasing St + causes an earlier departure. This inertial preference enables the particles to bypass the strong entrainment of the initial mixing layer at x/R ≈ 12 on the inner side. Upon entering the inner low-speed region, the local St t increases sharply because the surrounding flow is significantly decelerated, which extends the particle residence time within the mixing layer.
Figure 30 further presents the variation of
 ${\unicode[Arial]{x0394}} \overline{u}^{2}={\overline{u}}_{\!f}^{2}-{\overline{u}}_{p}^{2}$
along the representative fluid-phase streamlines AA′–GG′, which reflects the kinetic energy difference between the two phases. In supersonic flow, as demonstrated in figure 23, the drag force dominates particle motion. Therefore, particles can be reasonably approximated as moving along a circular path of assumptive radius R
a
, with the centripetal force primarily provided by the aerodynamic drag. Thus,
 ${\unicode[Arial]{x0394}} \overline{u}^{2}$
can also serve as a measure of the relative disparity between the centripetal acceleration of the gas,
 ${\overline{u}}_{\!f}^{2}$
/R, and that of the particle,
 ${\overline{u}}_{p}^{2}$
/R.
(a–d)
 ${\unicode[Arial]{x0394}} \overline{u}^{2}$
along different gas streamlines AA′ to GG′; (e–g)the starting point on the inner side (red) and on the outer side (blue).

Figure 30. Long description
Panel A: Line graph showing particle motion data along gas streamline FF’. The y-axis represents the normalized particle velocity squared difference, and the x-axis represents the normalized distance. Panel B: Line graph showing particle motion data along gas streamline GG’. The y-axis represents the normalized particle velocity squared difference, and the x-axis represents the normalized distance. Panel C: Line graph showing particle motion data along gas streamline EE’. The y-axis represents the normalized particle velocity squared difference, and the x-axis represents the normalized distance. Panel D: Line graph showing particle motion data along gas streamline DD’. The y-axis represents the normalized particle velocity squared difference, and the x-axis represents the normalized distance. Panel E: Line graph showing particle motion data along gas streamline AA’. The y-axis represents the normalized particle velocity squared difference, and the x-axis represents the normalized distance. Panel F: Line graph showing particle motion data along gas streamline BB’. The y-axis represents the normalized particle velocity squared difference, and the x-axis represents the normalized distance. Panel G: Line graph showing particle motion data along gas streamline CC’. The y-axis represents the normalized particle velocity squared difference, and the x-axis represents the normalized distance.
In the SP section,
 ${\unicode[Arial]{x0394}} \overline{u}^{2}$
remains nearly zero for all three particle populations due to the absence of streamline curvature. Upon entering the curved section, the flow follows a circumferential trajectory around the centre of curvature and deflects inward towards the inner side of the pipe. The excellent flow-following ability of small-inertia particles keeps
 ${\unicode[Arial]{x0394}} \overline{u}^{2}$
near zero throughout most of the bend, particularly for the St
+ = 0.9 case, indicating that the gas and particles experience comparable centripetal motion, or equivalently, that the flow provides sufficient centripetal force to the particles. The
 ${\unicode[Arial]{x0394}} \overline{u}^{2}$
of the St
+ = 16 particles becomes comparable to that of the smaller-particle populations over much of the domain. However, pronounced slip velocities emerge for the larger particles in regions dominated by Görtler vortices and near the low-speed zone. Along the GG′ streamline, for example,
 ${\unicode[Arial]{x0394}} \overline{u}^{2}$
< 0 between x/R = 10 and 12, indicating that the particles fail to decelerate in time with the outer-side flow and consequently accumulate near the wall. As the outer-side streamlines transport particles towards the inner side,
 ${\unicode[Arial]{x0394}} \overline{u}^{2}$
for both St
+ = 4 and 16 becomes positive for x/R >12, reflecting a delayed response or lag in particle adjustment to flow. Moreover, on the inner side near the low-speed region along AA′, BB′ and CC′ for x/R = 10–14, the higher inertia of St
+ = 16 particles prevents them from accelerating promptly in response to the expansion-wave-induced flow, so they retain a relatively high particle velocity. The resulting larger slip velocity leads to substantially greater
 ${\unicode[Arial]{x0394}} \overline{u}^{2}$
for St
+ = 16 particles in this zone. Collectively, these disparities demonstrate that the observed inertia-dependent behaviour across different flow regions originates from the relatively insufficient centripetal force available to redirect the high-inertia particles in the presence of strong streamline curvature and compressible wave effects.
In short, the transport of particles in supersonic curved pipes is governed by a combined effect of circumferential confinement, strong compressibility and centrifugal forces, which are absent in previous subsonic curved flows or compressible flat-wall turbulence. Our results reveal that this interplay sections the flow into distinct structures (expansion, compression, upstream Görtler vortices, downstream Dean-vortex dominance, wave system, mixing layer, low-speed region, etc.). Crucially, particles exhibit a clear inertia-dependent response to these structures. Based on the observed trends, we may further speculate on the limiting behaviours: if St + were further decreased towards zero, particles would essentially behave as ideal tracers, the particle-phase response would be indistinguishable from the fluid and particle inertia would play a negligible role. If St + were further increased, particles would become ballistic, dominated by their own momentum, and largely decoupled from turbulent and vortical motions. In that regime, particle behaviour would be governed almost entirely by initial conditions and inertia, with little dependence on local flow structures. While physically meaningful, these two limiting scenarios lie beyond the scope of the present study and remain to be explored in future work. The elucidated mechanisms establish a new understanding for predicting and controlling supersonic particulate flows, with direct implications for particle image velocimetry in experiments, fuel mixing optimisation in scramjets, and erosion protection in rockets and turbines.
The secondary vortical and wave-driven structures identified here are not exclusive to circular pipes, but are prevalent in diverse natural and engineering flows with curvature effects. Specifically, the inertial particle transport in the straight pipe (§ 4.1) shares fundamental similarities with flat-plate turbulent boundary layers, offering direct insights for industrial processes like aerodynamic conveying (Shoghl et al. Reference Shoghl, Naderifar, Farhadi and Pazuki2022; Wei et al. Reference Wei, Yang, Yang, Wang, Shi, Song and Ma2026), supersonic separators (Chen et al. Reference Chen, Han, Li, Xi and Huang2025b ) and combustion systems (Xiong et al. Reference Xiong, Sun, Yu, Hu, Yang, Wang and Wang2022; Tang et al. Reference Tang, Sun, Yan, Wang, Yu, Huang, Wang and Zhu2024). The particle distribution governed by Görtler vortices under the effect of concave curvature (§ 4.2) is widespread in both natural and engineering applications, as Görtler vortices can occur in moon landing sites (Rubio et al. Reference Rubio, Rodrigues, Qi, Patel, Gorman, Diaz Lopez, Capecelatro, Danehy and Ni2025), tandem expansion-compression corners (Fang et al. Reference Fang, Yao, Zheltovodov, Li and Lu2015) and the transitions of supersonic laminar flow (Ren et al. Reference Ren and Fu2015). Furthermore, the large-scale particle movement driven by coupled circumferential and streamwise curvature (§ 4.3) likely extends to any system dominated by centrifugal effects, such as aircraft high-G turn (Yang et al. Reference Yang, Xueting, Qingyun, Huangpeng, Yan and Peijin2025a ) or rotating machinery (Gallon et al. Reference Gallon, Feraco, Marino and Pumir2025). Similarly, the phenomenon seen in § 4.4, that is, the delayed response of particles to changes in the mixing layer alters their mixing effectiveness, is frequently observed in high-speed vehicle systems, such as rocket-based combined cycle engines (Yao et al. Reference Yao2024; Yang et al. Reference Yang, Li, Mai, Liu, Li, Wang, Xiao and Sun2024b ), rocket nozzles (Patel et al. Reference Patel, Rubio, Shekhtman, Parziale, Rabinovitch, Ni and Capecelatro2024) and cavity shear layers (Dai et al. Reference Dai, Jin, Luo, Xiao and Fan2021).
6. Conclusions
This study employs an Euler–Lagrange point-particle direct numerical simulation to systematically investigate the transport of three inertial particle populations (St + = 0.9, 4 and 16) in a compressible flow in a straight-to-curved pipe at a Mach number of 3.0. It is found that the particle transport in a supersonic curved pipe is governed by a unique combination of circumferential confinement, flow compressibility and centrifugal forcing, which is distinct from subsonic curved flows or compressible flat-wall turbulence. These combined effects induce multiple types of organised and interacting structures, including an expansion-induced separation zone on the inner (convex) wall, shock-wave compression and boundary-layer-scale Görtler vortices on the outer (concave) wall, and pipe-scale Dean vortices. Dean vortices dominate the region downstream of the curved pipe and are coupled with a complex system of compression/expansion waves. Crucially, particles exhibit a clear inertia-dependent segmentation in their response to these different flow structures.
The small St + particles act almost as sensitive tracers in turbulence. In the straight pipe, their behaviour resembles that in a compressible flat-plate boundary layer, forming pronounced low-speed streaks and accumulation near the wall, with St + = 4 exhibiting the strongest accumulation due to turbophoresis, followed by St + = 16 and the lowest for St + = 0.9. In the bend region, their comparatively strong flow-tracking ability allows them to be readily entrained by the initial shear layer into the inner low-speed zone, to follow Görtler vortices and to be effectively advected inward by Dean vortices into the inner mixing region. Consequently, their concentration in the inner low-speed layer is markedly higher. Only near the lateral sides, where combined circumferential and streamwise curvature is greatest, does their inertia suffice to form minor local accumulations that contribute to wall-collision events.
As particle inertia increases, however, more significant inertial effects manifest, resulting in their motions decoupling earlier from organised vortices. Their higher inertia causes a more significant departure from the fluid phase. In the initial bend, Görtler vortices enhance the prominence of the organised streaky structures. During Dean-vortex transport, they detach earlier from the vortex core due to insufficient centripetal force provided by the flow in the streamwise and circumferential directions, which further compresses the particle layer towards the wall. The strongest centrifugal effect occurs in the areas on both sides of the pipeline (curvature-transition zones). Consequently, they accumulate substantially at the lateral sidewalls, where collision frequency is the highest and notable slip velocity is observed, while largely avoiding entrainment into the inner low-speed region. The complex compression/expansion wave system further modulates their distribution and probability of colliding with the wall.
This work systematically elucidates the inertial-dependent transport mechanisms under the coupled action of secondary vortices and compression/expansion wave systems unique to supersonic curved pipes. The conclusions provide new physical insights for predicting particle-laden turbulence in practical high-speed curved configurations, such as scramjet combustors and solid-rocket nozzles.
Funding
The research work is financially supported by the National Natural Science Foundation of China (No. 12525202, 12502302) and Innovation Research Foundation of National University of Defense Technology (No. zk24-33).
Declaration of Interests
The authors report no conflict of interest.

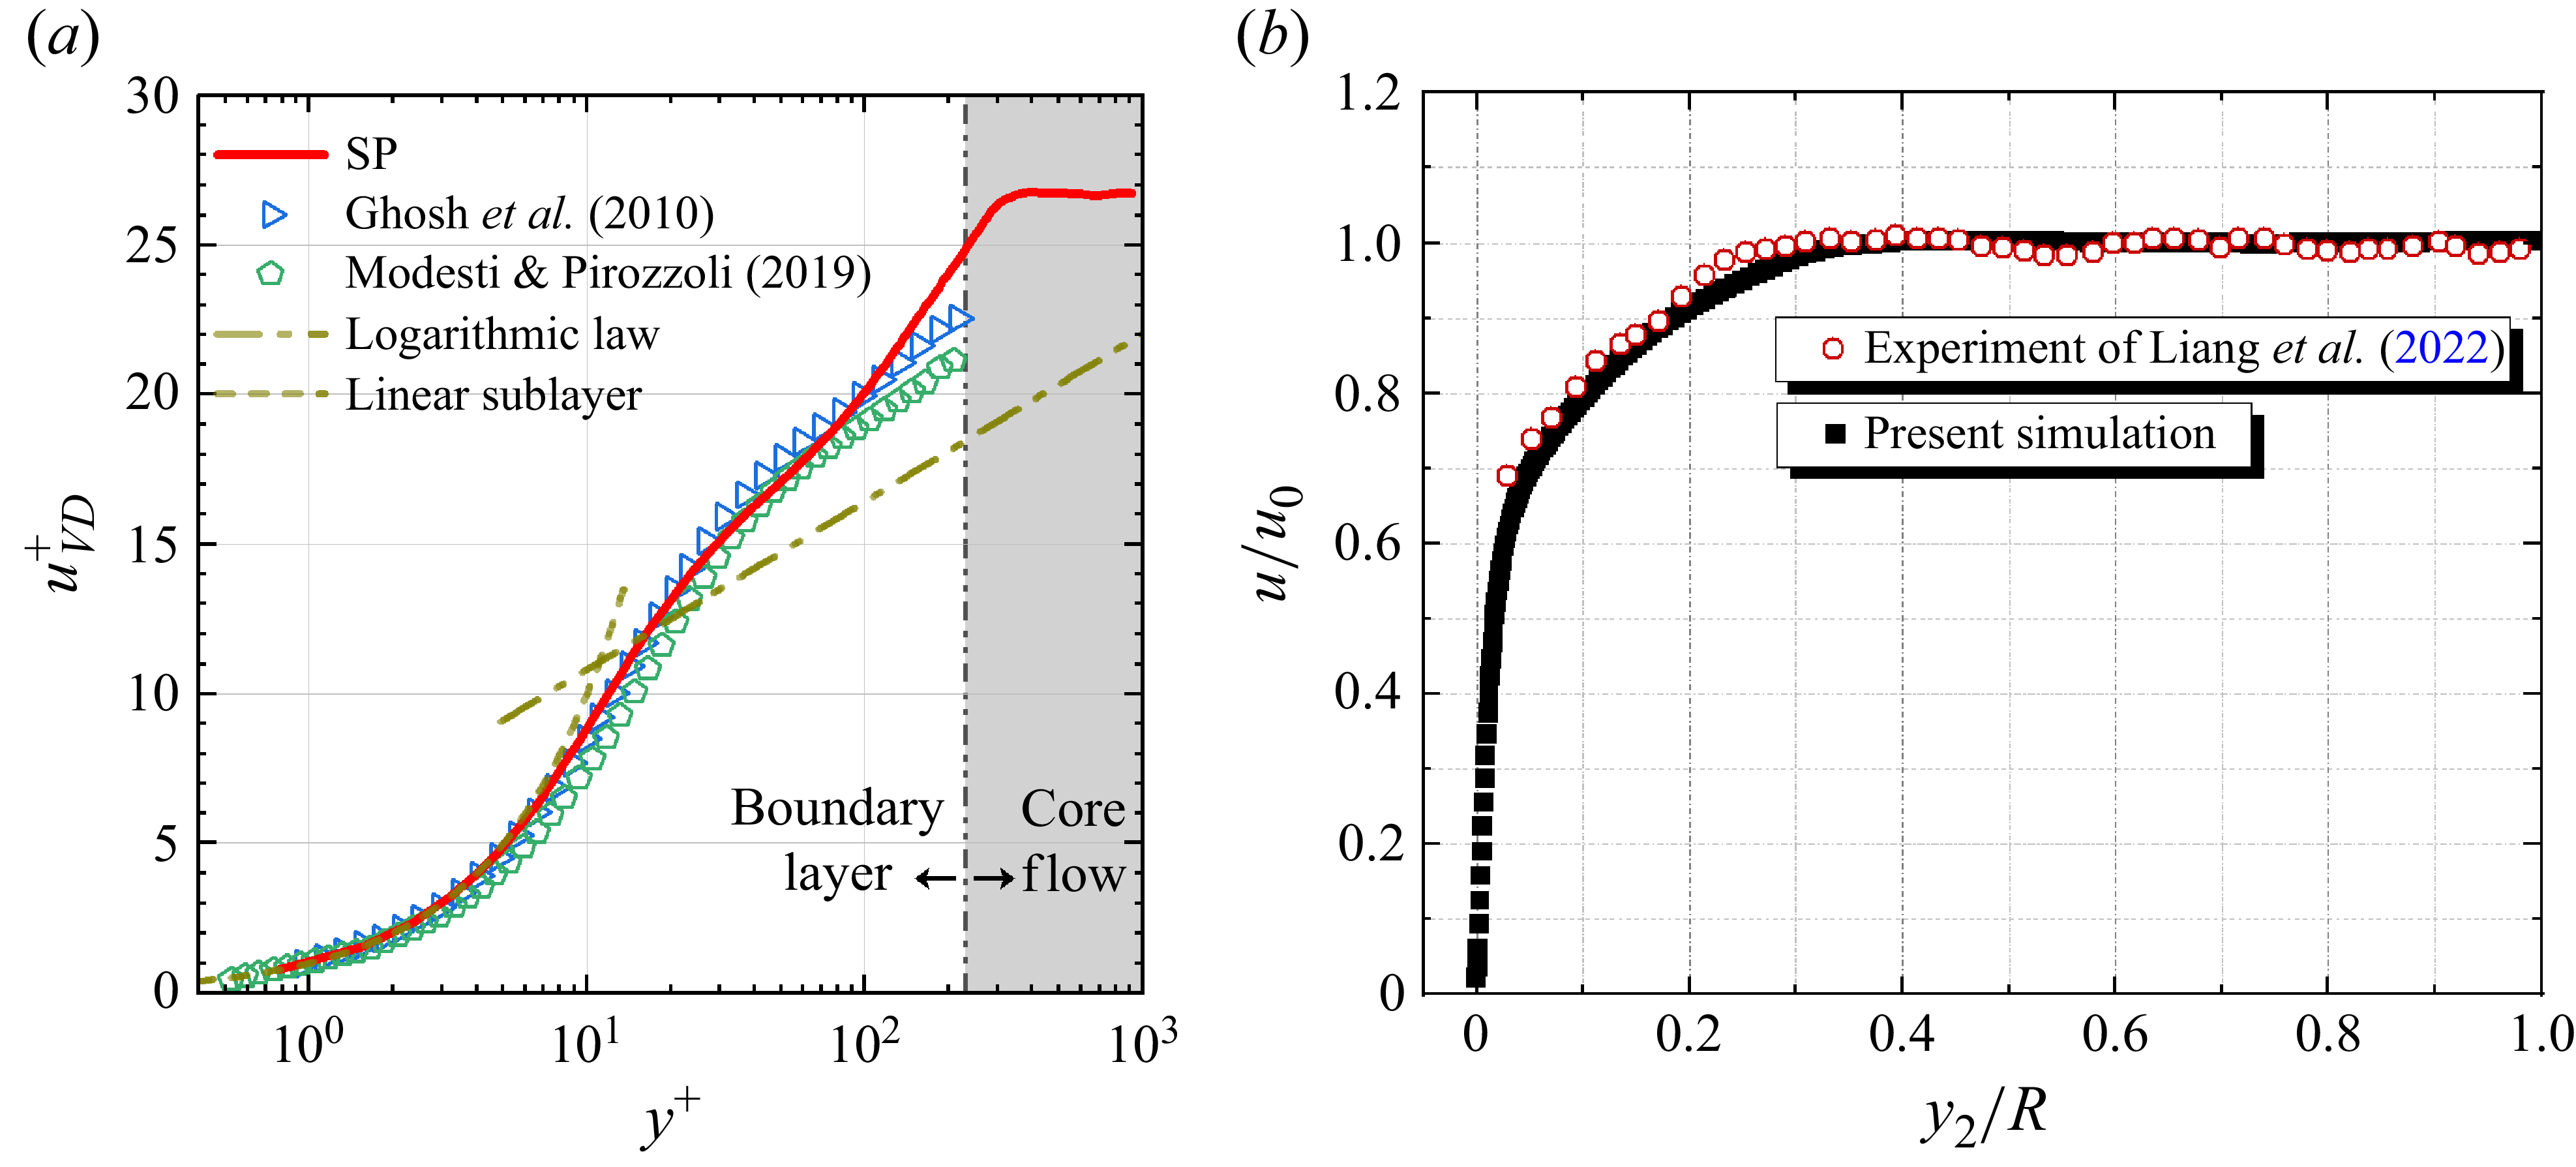


 Δw¯1
 Δv¯1

 v


 Gθ
 w

 vn
 vn
 v

 v

 −1δ0

 vn
 v

 vn
 v

 vn

 vn


 vn
 v


 |FD|,|Fam|
 |FP|

 −Δu¯21
 θ
 Δu¯21

 FD,x¯R/α02
 θ

 ΔVn¯

 u¯/a0
 0.99u0
 u¯/a0
 |∇ρ¯|δ0/ρ0

 u¯/a0


 Δu¯2


