Speech sound disorder (SSD) is a developmental disorder characterized by delays in the production of intelligible speech (Shriberg, Reference Shriberg2003). In the past, SSD has been referred to as articulation disorder and, more recently, phonological disorder. The term SSD is currently preferred because it recognizes that this disability may have antecedents in both articulatory (sensorimotor) and phonological (cognitive–linguistic) domains. This term has been used recently in the classification of speech–language disorders from a genetic standpoint in the Online Mendelian Inheritance in Man database (OMIM 608445).
SSD is a fairly common developmental disorder. In two large epidemiological samples, 15.6% of 3-year-old children and 3.8% of 6-year-old children were classified as meeting criteria for the disorder (Campbell et al., Reference Campbell, Dollaghan, Rockette, Paradise, Feldman and Shriberg2003; Shriberg, Tomblin, & McSweeny, Reference Shriberg, Tomblin and McSweeny1999). As these numbers indicate, a substantial proportion of children with SSD have normalized by the time they reach school age because of development and/or because of treatment. However, the fact that most children with SSD normalize should not diminish concern for its significance because SSD is associated with increased risk of comorbid specific language impairment (SLI) and later reading disability (RD), which are more persistent language-related problems (Bishop & Adams, Reference Bishop and Adams1990; Raitano, Pennington, Tunick, Boada, & Shriberg, Reference Raitano, Pennington, Tunick, Boada and Shriberg2004).
Each of these disorders (SSD, RD, and SLI) has genetic and environmental risk factors (Bartlett et al., Reference Bartlett, Flax, Logue, Vieland, Bassett and Tallal2002; Bishop, Reference Bishop1997a; Campbell et al., Reference Campbell, Dollaghan, Rockette, Paradise, Feldman and Shriberg2003; Fisher & DeFries, Reference Fisher and DeFries2002; Phillips & Lonigan, Reference Phillips, Lonigan, Snowling and Hulme2005; SLI Consortium, 2002, 2004; Smith, Pennington, Boada, & Shriberg, Reference Smith, Pennington, Boada and Shriberg2005; Stein et al., Reference Stein, Schick, Gerry Taylor, Shriberg, Millard and Kundtz-Kluge2004), yet the question of whether gene × environment interactions (G × E) may be important in the etiology of these disorders has been relatively neglected (for one exception see Kremen et al., Reference Kremen, Jacobson, Xian, Eisen, Waterman and Toomey2005). We first discuss the evidence for a genetic component to the etiology of SSD. Then, we discuss the evidence for environmental risk factors in speech, language, and reading development. Finally, we discuss the theoretical models for G × E.
Genetics of SSD
There is convergence across different genetic methodologies that speech and language disorders are familial (Felsenfeld, McGue, & Broen, Reference Felsenfeld, McGue and Broen1995) and heritable (Lewis & Thompson, Reference Lewis and Thompson1992; Tomblin & Buckwalter, Reference Tomblin and Buckwalter1998; for a review, see Lewis et al., Reference Lewis, Shriberg, Freebairn, Hansen, Stein and Taylorin press). The early familial and behavioral genetic studies utilized broadly defined speech–language disordered groups, which included, but were not limited to, children with SSD. More recent molecular genetic studies have specifically focused on children with SSD. Molecular genetic studies of SSD have investigated whether SSD is linked to known RD risk loci (Miscimarra et al., Reference Miscimarra, Stein, Millard, Kluge, Cartier and Freebairnin press; Smith et al., Reference Smith, Pennington, Boada and Shriberg2005; Stein et al., Reference Stein, Schick, Gerry Taylor, Shriberg, Millard and Kundtz-Kluge2004, Reference Stein, Millard, Kluge, Miscimarra, Cartier and Freebairn2006). This initial strategy has been employed because of the high rates of comorbidity between the two disorders and the relatively advanced state of molecular genetic research in RD.
Before discussing the results of the linkage studies in SSD, we will briefly describe the rationale behind linkage analysis. The goal of linkage analysis is to find regions in the genome that are likely to contain alleles that influence the phenotype of interest. Genetic markers are used to identify a genetic neighborhood of interest because genes that are located close together do not tend to recombine during meiosis; thus, regions that are close together in the genome are more likely to be transmitted together to offspring. If a marker in a specific region of the genome tends to be associated with SSD, then it is likely that a particular gene involved in SSD is located in the neighborhood of that marker. Linkage analysis only identifies a genetic neighborhood; it does not identify a gene (Plomin, DeFries, McClearn, & Rutter, Reference Plomin, DeFries, McClearn and Rutter1997). This is in contrast to candidate gene/association analysis, which attempts to identify a gene that is causally related to the phenotype. (For a more comprehensive explanation of these methods, see Faraone, Tsuang, & Tsuang, Reference Faraone, Tsuang and Tsuang1999; Pennington, Reference Pennington2002; Plomin et al., Reference Plomin, DeFries, McClearn and Rutter1997.)
Pairs of siblings are one sample of interest in linkage analyses. The degree of genetic similarity between two siblings for each marker can be quantified by an identity by descent value (ibd), which indicates the proportion of transmitted alleles that the siblings share (i.e., ibd = number of alleles ibd/2). At each marker, siblings can share both alleles (ibd = 1), half their alleles (ibd = 0.5), or none of their alleles (ibd = 0), meaning they received the same alleles from their mother and father, they share one parental allele, or they share no parental alleles, respectively. Thus, at a particular marker, siblings can be like identical twins (ibd = 1), fraternal twins or full siblings (ibd = 0.5), or two unrelated individuals (ibd = 0). The goal of linkage analysis is to determine if the ibd status of siblings at a marker is predictive of their phenotypic similarity. If so, the results suggest that there is a gene for the phenotype near the marker (Plomin et al., Reference Plomin, DeFries, McClearn and Rutter1997).
Turning back to the specific results of the SSD linkage studies, Smith et al. (Reference Smith, Pennington, Boada and Shriberg2005) tested for linkage in 86 sib pairs of children from 65 families in which at least one sibling had been diagnosed with SSD. Their analyses focused on three regions previously linked to reading disability, 1p36, 6p22, and 15q21 (for a review, see Fisher & DeFries, Reference Fisher and DeFries2002). The investigators used several phenotypes to test for linkage, each of which assessed speech production, phonological processing skills, or phonological memory (PM). Results supported linkage to 6p22 and 15q21 and marginally significant linkage to 1p36 (Smith et al., Reference Smith, Pennington, Boada and Shriberg2005).
Recent attempts to replicate these linkage results in an independent SSD sample have been partially successful. There is preliminary evidence of replication of the 6p22 locus (S. Iyengar, personal communication, September 8, 2006) and the 1p36 locus (Miscimarra et al., Reference Miscimarra, Stein, Millard, Kluge, Cartier and Freebairnin press). On chromosome 15, there is evidence for a linkage peak near 15q21, although it is located in the 15q14 region closer to genes associated with autism and Prader–Willi/Angelman syndrome than the linkage region associated with dyslexia/SSD (Stein et al., Reference Stein, Millard, Kluge, Miscimarra, Cartier and Freebairn2006). At this point, it is unclear whether the linkage peaks on chromosome 15 identified by Smith et al. (Reference Smith, Pennington, Boada and Shriberg2005) and Stein et al. (Reference Stein, Millard, Kluge, Miscimarra, Cartier and Freebairn2006) are related to the same or different loci for SSD.
Stein et al. (Reference Stein, Schick, Gerry Taylor, Shriberg, Millard and Kundtz-Kluge2004) also conducted a linkage study focusing on a region of chromosome 3 (3p12–q13) that was identified as a risk factor for RD by Nopola-Hemmi et al. (Reference Nopola-Hemmi, Myllyluoma, Haltia, Taipale, Ollikainen and Ahonen2001). Seventy-seven sib pairs were recruited into the study. They investigated several phenotypes associated with SSD and RD. Results showed evidence of linkage to the chromosome 3 locus (Stein et al., Reference Stein, Schick, Gerry Taylor, Shriberg, Millard and Kundtz-Kluge2004). Thus, in a separate sample, another RD risk locus was found to be associated with SSD.
Environmental Risk Factors for Speech, Language, and Literacy Development
Despite mounting evidence for a genetic etiology of SSD, it is clear that the heritability of the disorder will not be 100%, a fact that points to the importance of environmental variables. SSD is also accompanied, to various extents, by language and reading delays that are also associated with environmental risk factors. Many of these environmental risk factors are overlapping. The environmental risk factors most closely associated with SSD will be discussed first followed by a discussion of the risk factors more closely associated with language and reading delays.
One environmental variable that has been widely studied over the past few decades in relation to speech–language disorders is otitis media with effusion (OME). OME is a common pediatric illness involving an infection in the middle ear that causes an accumulation of fluid that may result in a transient hearing loss (Feldman et al., Reference Feldman, Dollaghan, Campbell, Colborn, Janosky and Kurs-Lasky2003). Holme and Kunze (Reference Holm and Kunze1969) were the first to suggest that OME may be a risk factor for delayed speech and language development. Since this report, a large body of research has produced mixed findings regarding the role of OME in speech and language delays (Feldman et al., Reference Feldman, Dollaghan, Campbell, Colborn, Janosky and Kurs-Lasky2003; Roberts et al., Reference Roberts, Hunter, Gravel, Rosenfeld, Berman and Haggard2004; Shriberg, Flipsen et al., Reference Shriberg, Flipsen, Thielke, Kwiatkowski, Kertoy and Katcher2000; Shriberg, Friel-Patti, Flipsen, & Brown, Reference Shriberg, Friel-Patti, Flipsen and Brown2000). Of most relevance, a recent study of risk factors for SSD in an epidemiological sample did not identify OME as a significant risk factor (Campbell et al., Reference Campbell, Dollaghan, Rockette, Paradise, Feldman and Shriberg2003). Several authors have noted that methodological variability and potential confounds are a significant problem in this literature and may be responsible for the mixed results (Bishop, Reference Bishop1997b; Feldman et al., Reference Feldman, Dollaghan, Campbell, Colborn, Janosky and Kurs-Lasky2003; Paradise et al., Reference Paradise, Rockette, Colborn, Bernard, Smith and Kurs-Lasky1997). To guide future research, Shriberg and colleagues (Shriberg, Flipsen et al., Reference Shriberg, Flipsen, Thielke, Kwiatkowski, Kertoy and Katcher2000; Shriberg, Friel-Patti et al., Reference Shriberg, Friel-Patti, Flipsen and Brown2000) proposed a multifactorial model in which child and environmental factors moderate or mediate relationships among OME, hearing loss, and speech–language development.
Another variable that has been highlighted as an environmental risk factor for speech and language development, as well as literacy development, is maternal education (Campbell et al., Reference Campbell, Dollaghan, Rockette, Paradise, Feldman and Shriberg2003; Hart & Risley, Reference Hart and Risley1992; Phillips & Lonigan, Reference Phillips, Lonigan, Snowling and Hulme2005). In a recent study of risk factors for SSD, maternal education emerged as the strongest risk factor in a large, diverse sample of children (Campbell et al., Reference Campbell, Dollaghan, Rockette, Paradise, Feldman and Shriberg2003). It is important to note that maternal education cannot be considered a purely environmental variable because it may also reflect the genetic endowment of the mother. The issue of such gene–environment (G−E) correlations will be discussed further below.
In the domains of language and literacy development, the effect of the language and literacy environment in the home has been studied more directly (Hart & Risley, Reference Hart and Risley1992; Phillips & Lonigan, Reference Phillips, Lonigan, Snowling and Hulme2005; Thorpe, Rutter, & Greenwood, Reference Thorpe, Rutter and Greenwood2003). In one of the best designed studies to date, Thorpe et al. (Reference Thorpe, Rutter and Greenwood2003) used twins as a natural experiment to study language development. It is well documented that twins are delayed relative to singletons in their language development, but the causes of this delay are unknown. One plausible explanation is that parents of twins cannot dedicate as much interaction time to each child as parents of singletons, and so the richness of the twins' language environment is reduced. Thorpe et al. (Reference Thorpe, Rutter and Greenwood2003) compared the parent–child interactions of families with twins to interactions in families with two singletons born close together (within 30 months). The results were consistent with parent–child interactions as a causal variable that explained observed language differences between twins and singletons. These results demonstrate that even subtle differences in language environments that are within the normal range of variation can have measurable effects on language development.
It is not surprising that environmental variables identified as important for speech and language development have also been identified as important for the development of preliteracy and literacy skills: socioeconomic status (SES), family beliefs, and values about education and achievement, home language stimulation, and home literacy environment (for a review, see Phillips & Lonigan, Reference Phillips, Lonigan, Snowling and Hulme2005). Of course, these variables are highly correlated and mutually influential. Interestingly, there has been a debate in the literature regarding the magnitude of the impact of the home literacy environment, specifically shared reading activities between parents and children, on the growth of literacy and language skills (Bus, van IJzendoorn, & Pellegrini, Reference Bus, van IJzendoorn and Pellegrini1995; Dunning, Mason, & Stewart, Reference Dunning, Mason and Stewart1994; Lonigan, Reference Lonigan1994; Scarborough & Dobrich, Reference Scarborough and Dobrich1994a, Reference Scarborough and Dobrich1994b).
In summary, as with most complex disorders, environmental and genetic factors contribute to the etiology of SSD. SSD is also associated with language and reading delays that likely involve partially overlapping and partially unique genetic and environmental risk factors.
The Complication of G−E Correlations
The distinction between G−E correlations and G × E is sometimes a difficult one, especially because both mechanisms are likely to be operating in development. The term G−E correlation refers to the fact that environments are often partially genetically determined. There are several mechanisms through which environments can be responsive to genetics (e.g., passive, active, evocative G−E correlations; Rutter, Moffitt, & Caspi, Reference Rutter, Moffitt and Caspi2006; Scarr & McCartney, Reference Scarr and McCartney1983). The term G × E refers to the fact that environments can modify the expression of an individual's genetic background, either strengthening or weakening the effects of genes on phenotypes (Rutter et al., Reference Rutter, Moffitt and Caspi2006).
G−E correlations complicate the study of G × E because it is difficult to determine the extent to which a measured environment may be genetically determined (Rutter et al., Reference Rutter, Dunn, Plomin, Simonoff, Pickles and Maughan1997, Reference Rutter, Moffitt and Caspi2006; Scarr & McCartney, Reference Scarr and McCartney1983). Indeed, G−E correlations have been shown to be influential in the development of children's language abilities (Gilger, Ho, Whipple, & Spitz, Reference Gilger, Ho, Whipple and Spitz2001), and such correlations are also likely to play a role in speech and literacy development. Fortunately, behavior genetic simulations have shown that G−E correlations do not substantially impact detection of G × E (Purcell, Reference Purcell2002). In most studies, the strategy for dealing with G−E correlations while testing for G × E has been to test for the correlations directly. The current study will also adopt this strategy.
G × E
As more is learned about both the genetics of SSD and its associated disorders, and environmental influences affecting speech, language, and literacy development, a question to address is whether G × E plays a role in the etiology of SSD. As previously discussed, G × E has been relatively neglected in speech, language, and reading disorders. The study of G × E in these developmental disorders is relevant not only to these disorders directly but also to developmental psychopathology more generally as reading and language disorders are associated with increased risk for both internalizing and externalizing psychopathologies (Beitchman, Nair, Clegg, Ferguson, & Patel, Reference Beitchman, Nair, Clegg, Ferguson and Patel1986; Willcutt & Pennington, Reference Willcutt and Pennington2000) and the etiologic pathways found in one disorder are potentially relevant for others.
G × E is a complex topic (Grigorenko, Reference Grigorenko2005), and various forms of interaction are just beginning to be explored (e.g., Kendler & Eaves, Reference Kendler and Eaves1986; Rutter, Reference Rutter, Magnusson and Allen1983; Shanahan & Hofer, Reference Shanahan and Hofer2005). The current G × E models can be distilled to two theoretical models that make opposite predictions about the direction of the interaction. The diathesis–stress model predicts that a diathesis (genetic vulnerability) coupled with an environmental stress, will increase the likelihood of disordered behavior (Rende & Plomin, Reference Rende and Plomin1992). In genetic terms, this model predicts that the heritability of the trait or the risk locus will be higher for individuals in risk environments (Rutter et al., Reference Rutter, Moffitt and Caspi2006). In contrast, the bioecological model predicts that enriched environments will enable underlying genetic differences to be actualized, whereas risk environments will mask the genetic differences (Bronfenbrenner & Ceci, Reference Bronfenbrenner and Ceci1994; Gottesman, Reference Gottesman and Ellis1963; Scarr, Reference Scarr1992). In genetic terms, this model predicts that the heritability of the trait or the risk locus will be higher in enriched environments (Rutter et al., Reference Rutter, Moffitt and Caspi2006).
Diathesis–stress models are a “cornerstone” of the conceptualization of how psychopathologies develop (O'Connor, Caspi, Defries, & Plomin, Reference O'Connor, Caspi, Defries and Plomin2003, p. 849). The explanatory power of G × E in the etiology of disordered behavior has been demonstrated in the conduct disorder (CD) literature (Cadoret, Yates, Troughton, Woodworth, & Stewart, Reference Cadoret, Yates, Troughton, Woodworth and Stewart1995; Caspi et al., Reference Caspi, McClay, Moffitt, Mill, Martin and Craig2002; Rutter et al., Reference Rutter, Moffitt and Caspi2006) and the depression literature (Caspi et al., Reference Caspi, Sugden, Moffitt, Taylor, Craig and Harrington2003; Eley et al., Reference Eley, Sugden, Corsico, Gregory, Sham and McGuffin2004; Silberg, Rutter, Neale, & Eaves, Reference Silberg, Rutter, Neale and Eaves2001). In both cases, an environmental stress (e.g., maltreatment in CD, stressful life events, especially loss, in depression) coupled with a genetic risk results in more disordered behavior than would be expected by either factor alone or in additive combination. It is important that these findings cannot be explained by G−E correlations because, in many of the samples studied, individuals with risk alleles have not been exposed to more environmental stress (Caspi et al., Reference Caspi, McClay, Moffitt, Mill, Martin and Craig2002, Reference Caspi, Sugden, Moffitt, Taylor, Craig and Harrington2003).
Although research investigating G × E in psychopathologies has tended to find the diathesis–stress type of G × E, research investigating G × E in academic and cognitive traits has tended to find the bioecological form of G × E (Kremen et al., Reference Kremen, Jacobson, Xian, Eisen, Waterman and Toomey2005; Rowe, Jacobson, & Van den Oord, Reference Rowe, Jacobson and Van den Oord1999; Turkheimer, Haley, Waldron, D'Onofrio, & Gottesman, Reference Turkheimer, Haley, Waldron, D'Onofrio and Gottesman2003), although there are occasional exceptions (Asbury, Wachs, & Plomin, Reference Asbury, Wachs and Plomin2005; van den Oord & Rowe, Reference van den Oord and Rowe1998). The logic of the bioecological interaction was discussed by Lewontin (Reference Lewontin1970) using the analogy of genetically variable seeds that are planted in two different fields (cited in Neisser et al., Reference Neisser, Boodoo, Bouchard, Boykin, Brody and Ceci1996). In this analogy, one field is rich in nutrients and the other is deprived. In the deprived field, all of the plants will be short because of the environmental adversity. However, in the nutrient-filled field, there will be considerably variability in plant height that is primarily determined by the genetic endowment of the plant. Thus, the environment in which the seed was planted determines how the genetic liability of the plant is expressed, a bioecological G × E.
The only study that has investigated G × E in reading ability found a bioecological interaction (Kremen et al., Reference Kremen, Jacobson, Xian, Eisen, Waterman and Toomey2005). In this study, parent education moderated the heritability of word recognition skills in a middle-aged sample of twins. Results showed that the heritability of word recognition in twins with highly educated parents was higher (h 2 = .69) than the heritability in twins with less-educated parents (h 2 = .21).
One weakness in the behavioral genetic approach to G × E is that it tests for interactions with unmeasured genetic influences, but the mechanisms underlying the interaction are likely to involve specific genes. As such, molecular genetic methods are preferable for testing G × E (Rutter et al., Reference Rutter, Moffitt and Caspi2006). Ideally, tests of G × E would involve specific risk alleles (e.g. Caspi et al., Reference Caspi, McClay, Moffitt, Mill, Martin and Craig2002, Reference Caspi, Sugden, Moffitt, Taylor, Craig and Harrington2003), but in the case of RD and SSD, these have not yet been determined. Fortunately, in the absence of identified risk alleles, G × E can still be tested using an extended linkage equation. The current study will test for G × E at two reported SSD/RD linkage peaks on chromosomes 6 and 15 (Smith et al., Reference Smith, Pennington, Boada and Shriberg2005) using a sib-pair linkage design and continuous measures of SES, home language/literacy environment, and number of ear infections. The interactions will be tested using composite speech, language, and preliteracy phenotypes. To our knowledge, this is the first study to use molecular genetic methods to test for G × E in SSD or RD. We hypothesize that there will be bioecological G × E for some of the speech, language, and preliteracy phenotypes. This prediction is based on previous research showing that G × E for academic and cognitive traits tends to be in the bioecological direction.
Method
Participants
This study is part of an ongoing longitudinal study investigating the relationship between SSD and RD (Raitano et al., Reference Raitano, Pennington, Tunick, Boada and Shriberg2004; Smith et al., Reference Smith, Pennington, Boada and Shriberg2005). The sample used in this study is substantively the same as the sample used by Smith et al. (Reference Smith, Pennington, Boada and Shriberg2005). Probands with SSD (n = 109) between the ages of 5 and 7 years old were recruited through public and private schools in metropolitan Denver and through radio and newspaper advertisements. Children recruited through the schools were first identified by special education personnel or through mass mailings to parents of all kindergarten children in four cooperating school districts. As a first gate to participation, all probands were required to have current or previous SSD, as defined by prior testing by a speech–language pathologist and/or significant intelligibility problems at 3–4 years of age according to parent report. As a second gate to participation, probands were required to be receiving or to have received speech–language therapy and/or to score below the 30th percentile on the Goldman Fristoe Test of Articulation (GF; Goldman & Fristoe, Reference Goldman and Fristoe1986). Full siblings of the probands were recruited for inclusion if they were between 5 and 9 years old. The sibling's speech status was free to vary. However, if both the proband and siblings had received speech–language therapy, the child with the more extreme articulation deficit on the GF was designated as the proband. Families with children participating in the study were required to be monolingual English speaking. Hence, children exposed to foreign languages were excluded, but not children of different ethnic or racial groups whose sole linguistic exposure had been English. Other exclusionary criteria for the study included: (a) known genetic disorders or syndromes, (b) mental retardation (e.g., nonverbal IQ < 70), (c) pervasive developmental disorder, (d) significant birth complications, (e) acquired brain injury, (f) peripheral hearing loss, and (g) structural or functional speech mechanism impairments (e.g., cleft palate).
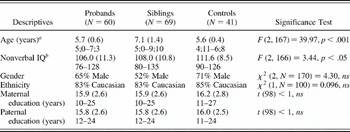
Of the 109 probands, 2 probands were excluded because they were consistent outliers on the tasks administered. From the remaining 107 families with probands, 69 families had an eligible sibling. However, 9 of these families did not have an adequate genetic sample to obtain ibd information. Thus, a total of 60 families were included in the genetic linkage analysis. Of these families, 52 had one eligible sibling (besides the proband), 7 had two siblings, and 1 had 3 siblings, resulting in a total of 79 sib pairs in the sample. Descriptives for probands and siblings are displayed in Table 1.
Mean (standard deviation) and range of descriptives for probands, siblings, and controls

Note: Because probands and siblings come from the same families, ethnicity, mother's education, and father's education is the same for both the proband and the sibling.
aTukey post hoc tests: proband = control < sibling.
bTukey post hoc tests: proband < control, proband = sibling, sibling = control.
A sample of control participants (n = 41) was recruited to be similar in age, gender, ethnicity, and SES to the SSD probands. The sample was intended as a reference sample for the phenotypic scores of the probands and siblings. Control participants could not have a history of speech or language difficulties or speech–language therapy and they were required to have developmentally appropriate articulation at the time of testing (e.g., GF > 30th percentile). Descriptives for the control sample are given in Table 1.
Procedure
Parents provided consent for their child to participate in the behavioral and genetic components of this study, and children provided assent. Probands and siblings were tested on a battery of speech, language, and preliteracy measures over the course of three 2-hr sessions. Parents completed questionnaires that included information about their SES and home language/literacy environment.
Measures
Speech, language, preliteracy, and reading variables
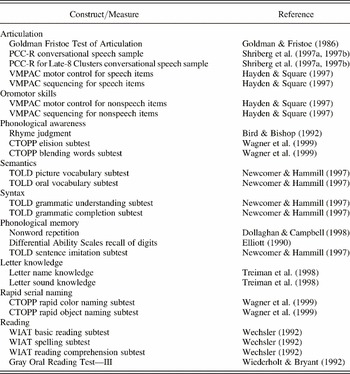
For organizational and conceptual purposes, measures of the speech, language, and preliteracy battery are listed in Table 2 under eight broad constructs that represent the results of a confirmatory factor analysis. At the end of this list is a description of several reading measures that were administered to probands at the second time point of this longitudinal project. These reading measures were used along with measures of articulation and language to select environmental variables that influenced the child's phenotype, but they could not be used for the linkage analyses because they were not administered to the proband's siblings.
Measures from the speech, language, and literacy battery grouped into constructs according to the results of a confirmatory factor analysis

Note: PCC-R, Percentage of Consonants Correct—Revised; VMPAC, Verbal Motor Production Assessment for Children; CTOPP, Comprehensive Test of Phonological Processing; TOLD, Test of Language Development; WIAT, Wechsler Individual Achievement Test.
Environmental variables
Several variables that are potentially related to the language and literacy environment provided in the home were collected. We gathered maternal and paternal educational level via self-report, and means and standard deviations are reported in Table 1.
Parents also completed two surveys to assess their exposure to children's books and adult authors,Footnote 1 the Title Recognition Test (TRT; Allen, Cipielewski, & Stanovich, Reference Allen, Cipielewski and Stanovich1992) and the Author Recognition Test (ART; Stanovich & West, Reference Stanovich and West1989). These surveys consisted of a list of popular children's books (TRT) and popular adult authors (ART) intermingled with false lures. Parents were instructed to identify the books and authors that were “true” authors and were informed that “fake” books and authors were also included. The goal of these surveys was to assess parents' exposure to print in a format that is less susceptible to socially desirable responses than typical questionnaires (Stanovich & West, Reference Stanovich and West1989). The reliability of the number of correct items checked was high for both the TRT (Cronbach α = .83) and the ART (Cronbach α = .89). Scores for the ART and TRT were calculated by subtracting the proportion of false alarms on the foil items from the proportion of correctly identified items (TRT, mean = 0.46, SD = 0.20, range = 0.11–0.83; ART, mean = 0.44, SD = 0.18), range = 0.07–0.90).
Parents also filled out a Home Literacy Environment Questionnaire.1 Questions were asked about the number of books in the house, how often family members purchase books or go to the library, how often parents read to their children, and so forth. Most questions were rated on a Likert scale (1–5), with 5 reflecting the most enriched environment. This questionnaire was developed for use in our lab, so its psychometric properties were undetermined. We conducted an exploratory factor analysis (EFA) with principal axis factoring and varimax rotation. Results revealed a five-factor solution according to the scree plot and an eigenvalue cutoff of 1. A loading score cutoff of .4 was set for interpretation of variables. The five factors were readily interpretable and given the following labels: letters and library, enjoyment of books, newspaper reading, child's independent reading, and oral reading to child. None of the factors were correlated at r > .3 with the exception of the library and letters and oral reading factors at r = .32, so the simpler Varimax rotation method was chosen (Tabachnick & Fidell, Reference Tabachnick and Fidell2001). The relevant items from each factor were standardized and averaged to form the five composites.
Finally, parents filled out a hearing history questionnaire that asked whether their child had a history of ear infections, and if so, asked them to describe the frequency, onset and offset, and duration of the infections. The dependent variable used in this study was the number of parent reported ear infections in the child's lifetime (mean = 4.0, SD = 4.2, range = 0–20).
Data cleaning and reduction
Phenotypic variables
A confirmatory factor analysis (CFA) of the phenotypic variables described above was performed using AMOS 5. The goal of this CFA was to identify the smallest number of composites that were still theoretically meaningful.
All children tested on the phenotypic measures (N = 233) were included in the CFA to provide a sufficiently large sample and maximize generalizability of the factors. Because we included both members of the sib pairs in the CFA, we tested whether the assumption of independent observations was empirically violated for each phenotype by testing for a significant difference between within-family variance and between-family variance for families with two or more siblings in the study (Kashy, Kenny, Reis, & Judd, Reference Kashy, Kenny, Reis, Judd and Reis2000). Of the 21 measures that were included in the CFA, 6 violated the independence assumption according to the liberal p value (p < .2) suggested by Kashy et al. (Reference Kashy, Kenny, Reis, Judd and Reis2000). Because of these violations, we tested the final CFA model in a sample of unrelated individuals to ensure that the model fit was also adequate in a sample of unrelated children.
The phenotypic variables were inspected for normality, univariate outliers, linearity, and multicollinearity (Kline, Reference Kline2005). In all cases, raw scores from the measures were used. Outliers that exceeded 3 SD from the sample mean were winsorized to 3 SD. Twenty-three children had missing data (10%) for one or more of the variables; missing variables were imputed by AMOS before running the CFA. For all models, we allowed errors of the subtests from the same test to correlate in order to allow for test-specific measurement error.
We arrived at our final model through seven steps.
1. We tested our initial theoretical model, which consisted of six factors: articulation (including the The Verbal Motor Production Assessment for Children [VMPAC; Hayden & Square, 1993] nonspeech variables), semantics/syntax (composed of the four TOLD subtests), phonological awareness (PA), PM, letter knowledge (LK), and rapid serial naming (RSN).
2. Because the fit of the initial theoretical model was unsatisfactory, we conducted an EFA with principal axis factoring and oblimin rotation to guide future models.
3. We modified the original model by splitting the articulation factor into an articulation and oromotor factor and we combined the semantics/syntax and PA factors into one oral language factor.
4. We ran the revised model and obtained a better fit than the original model, χ2 (157, N = 233) = 390.072, p < .001, χ 2/df = 2.49, comparative fit index (CFI) = .940, root mean square error of approximation (RMSEA) = .080 (90% confidence interval [CI] = .070–.090).
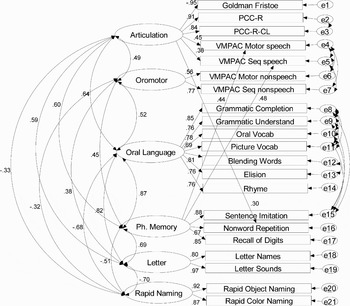
5. We added three theoretically predictable cross-loadings from the nonword repetition task to the articulation factor and the two VMPAC speech variables to the PM factor because these three subtests each required articulation and PM skills. Each cross-loading significantly improved the model fit according to the chi-square difference test for nested models. The resulting model fit statistics were: χ2 (154, N = 233) = 282.885, p < .001, χ2/df = 1.84, CFI = .967, RMSEA = .060 (90% CI = .049–.071; see Figure 1).
6. We tested several more parsimonious models by setting the correlation between latent factors to 1, but all of the alternatives resulted in significant degradations to the model fit as assessed by the chi-square difference test: (a) collapsing the articulation and oromotor factors, (b) collapsing the articulation and PM factors, and (c) collapsing the oral language and PM factors.
7. Finally, we tested this final model in a subsample of unrelated individuals (N = 150) to check that the model fit was not artificially improved by including sib pairs in the sample. Results showed that this was not likely to be the case, χ2 (154, N = 150) = 262.690, p < .001, χ2/df = 1.706, CFI = .956, RMSEA = .069 (90% CI = .054–.083).
The modified six-factor model used to make composites.

The model shown in Figure 1 was used to create phenotypic composites for linkage. Although the semantics, syntax, and PA variables loaded together onto one oral language factor, we created both an oral language composite as well as separate semantics, syntax, and PA composites based on theoretical distinctions among the cognitive domains measured by these tasks. A similar procedure was employed by Samuelsson et al. (Reference Samuelsson, Byrne, Quain, Wadsworth, Corley and DeFries2005), who found that heritabilities differed substantially for separate skill categories within a heterogeneous “general verbal ability” factor that emerged from an EFA in their twin sample. These results showed that the nonshared variance between phenotypic variables could be important for detecting differential genetic etiologies.
When creating the composites, we excluded the cross-loading VMPAC variables because they loaded almost equally on the PM and articulation factors. The nonword repetition task was assigned to the PM factor because it loaded more strongly on PM (.67) than on the articulation factor (.30). To create the composites, the variables of each construct were reflected when necessary, standardized, and averaged together. The distributions of the composites were inspected for outliers and normality. We performed transformations on four variables to improve the normality of the distributions and minimize outliers. The articulation, oromotor, and LK factors were inverse transformed and the RSN factor was log transformed following recommendations by Tabachnick and Fidell (Reference Tabachnick and Fidell2001). Next, the composites were age regressed, with age and age2 as the independent variables. Finally, in preparation for the DeFries–Fulker (DF) linkage analysis, the sib-pair scores were standardized relative to the control mean and standard deviation (SD). For the DF linkage analysis, we used an extremity selection of 1 SD below the control mean.
Environmental variables
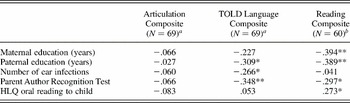
The environmental variables were inspected for normality and univariate outliers. Outliers that exceeded 3 SDs from the sample mean were winsorized to 3 SD. The environmental variables were then screened for their impact on speech, language, and literacy skills via correlations. We used the following phenotypes in the screening, the articulation composite score, the TOLD total language standard score (an average of the scaled scores from the subtests of the TOLD), and the reading composite score (an average of the standard scores from each of the reading measures). Negative correlations were expected because the environmental variables were reflected so that high values represented high environmental risk, whereas the composite scores were reflected so that high values represented good performance. The five environmental variables (of the 12 environmental variables tested) that showed significant correlations with one or more of the composite phenotypes are displayed in Table 3. Only these environmental variables were used in subsequent tests of G × E.
Correlations of the environmental variables with speech, language, and literacy measures

aRandomly selected sibling from each family.
bProbands only.
*p < .05. **p < .01.
Notably, the oral reading correlation with the reading composite was in the opposite direction from predicted, possibly indicating that parents of children with low reading scores were trying to compensate by reading more often to their children and/or that children who were good readers tended to read by themselves rather than with their parents. Despite the directionality of this correlation, we decided to include the oral reading variable in further analyses because it was of theoretical interest (Phillips & Lonigan, Reference Phillips, Lonigan, Snowling and Hulme2005). Families that prioritized reading to their child with reading difficulties may have been providing a richer literacy environment overall.
The pairwise correlations among the five selected environmental variables suggested that the variables were not simply redundant. The highest correlations were between maternal and paternal years of education r (69) = .49, p < .01, and maternal and paternal years of education with ART, r (69) = .49, p < .01, r (69) = .42, p < .01, respectively. This reduced set of five variables was correlated with the genetic risk indices derived from the DF regression equation to exclude those variables showing significant G−E correlations (see G−E correlation in the Results section).
Genotyping and ibd estimation
DNA was extracted from buccal brushes obtained from all participating children and their available biological parents. Markers from dyslexia candidate regions on chromosomes 1p36, 6p22, and 15q21 were typed using fluorescently labeled primers on an automated ABI 3700 DNA sequencer (Applied Biosystems, Foster City, CA). The order of markers was determined from the published genome map NCBI MapViewer and genetic distances were based on the deCode map, both of which are available at the NCBI website (http://www.ncbi.nlm.nih.gov/mapview/). This map was selected over the Marshfield map, because it is based on more meioses, but if a marker was not placed on the deCode map, the position was extrapolated based on the physical distance and the relative distances between flanking markers on the Marshfield map. The markers and their positions have been published by Smith et al. (Reference Smith, Pennington, Boada and Shriberg2005). Throughout this study, centimorgan (cM) designations are referenced to the first marker typed on each chromosome (e.g., the most telomeric marker on chromosome 1, D1S199, is designated 0 cM).
Allele calling was done by ABI Genotyper v. 3.7 software, and inheritance checking was done with the Genetic Analysis System version 2 software (Young, Reference Young1995). In our genetics lab, the initial genotype error rate detected by the Genetic Analysis System is approximately 3.2%. When errors were detected by the Genetic Analysis System, the allele calls were double-checked by the technologists. Following this procedure, the count recs feature in GENEHUNTER 2.1_r5b (Kruglyak, Daly, Reeve-Daly, & Lander, Reference Kruglyak, Daly, Reeve-Daly and Lander1996) and the error feature in MERLIN (Abecasis, Cherny, Cookson, & Cardon, Reference Abecasis, Cherny, Cookson and Cardon2002) were also used to detect errors in map placement or genotyping. The Graphical Relationship Representation (www.sph.umich.edu/csg/abecasis/GRR) was also used to visually inspect the genetic data from parents and siblings to insure that all siblings were full biological siblings and all parents were full biological parents. After all detectable errors were corrected or deleted, it was estimated that the genotype error rate was less than 1%. Multipoint ibd estimations were calculated using the ibd feature of Merlin (Abecasis et al., Reference Abecasis, Cherny, Cookson and Cardon2002).
Linkage analysis and genetic risk
This study employed two regression-based linkage methods that can be used with severity selected samples: the DF method (DeFries & Fulker, Reference DeFries and Fulker1985, Reference DeFries and Fulker1988; Fulker et al., Reference Fulker, Cardon, DeFries, Kimberling, Pennington and Smith1991) and the Merlin-regress method (Sham, Purcell, Cherny, & Abecasis, Reference Sham, Purcell, Cherny and Abecasis2002). One limitation of the Merlin-regress method is that the population mean, variance, and heritability of the phenotype must be known. Decreases in power result if these parameters are misspecified. As a result, we chose the DF method as our primary linkage analysis because it can flexibly incorporate tests of G × E and it does not require accurate specification of the population statistics, which are unknown in this selected sample.
The DF method takes advantage of the phenomenon of regression to the mean. In this method, at least one member of each sib pair (the proband) is selected to be extreme on a phenotype. The logic is that, given a risk locus that affects a phenotype, a co-sib who carries the same alleles as the proband will not regress as far to the population mean as a co-sib who does not share the same genotype. In other words, if the ibd status of the sib pair at the locus being tested is a significant predictor of the co-sib's score, then there is evidence for linkage (e.g., if the B2 term is significant; see the Results section for the DF equation; DeFries & Fulker, Reference DeFries and Fulker1985, Reference DeFries and Fulker1988; Fulker et al., Reference Fulker, Cardon, DeFries, Kimberling, Pennington and Smith1991; Plomin et al., Reference Plomin, DeFries, McClearn and Rutter1997).
Multipoint DF analyses (every 0.5 cM) were conducted with regressions in SPSS 13.0 using an extremity selection of 1 SD below the control mean. Because the sample was truncate selected, sib pairs in which both members met the extreme selection criteria were double entered (DeFries & Gillis, Reference DeFries, Gillis, Obrzut and Hynd1991). In other words, although we explicitly recruited SSD probands and their siblings, the designation of “proband” for the purposes of the DF analysis was empirically determined for each analysis by assessing whether one or both members of a sibling pair met the extreme selection criteria. The standard errors of the regression coefficients were corrected for the number of double-entered pairs using the procedures documented in Stevenson, Pennington, Gilger, DeFries and Gillis (Reference Stevenson, Pennington, Gilger, DeFries and Gillis1993). This correction procedure is conservative, exceeding a 30% overestimate in some cases (Kohler & Rodgers, Reference Kohler and Rodgers2001; Rodgers & Kohler, Reference Rodgers and Kohler2005). As a result, we loosened the p < .01 criteria proposed by Lander and Kruglyak (Reference Lander and Kruglyak1995) for replicating a linkage result to p < .05 (one tailed). A one-tailed test of the ibd value (B2) is customarily used because the direction of regression is nearly certain (e.g., DeFries, Fulker, & LaBuda, Reference DeFries, Fulker and LaBuda1987). We did not apply a correction for multiple tests because a Bonferroni correction is too conservative in this scenario where the phenotypes are highly correlated and the markers are tightly linked. In fact, an appropriate correction does not exist for this case (e.g., Francks et al., Reference Francks, Paracchini, Smith, Richardson, Scerri and Cardon2004).
To conduct G−E correlations, we derived a measure of genetic risk from the DF basic equation, using the influence statistic, standardized DF beta, provided by SPSS Regression. DF beta is the change in the regression coefficient that results from the exclusion of a particular case. In this case, the change in the B2 regression coefficient when a particular sib pair is deleted is an estimate of the contribution of the sib pair to the linkage result. In this study, standardized DF beta calculations were obtained for every significant linkage peak. Because linkage peaks are obtained at different markers with different phenotypes and with different sib pairs included in each analysis, different linkage analyses can provide conflicting information. As a simplification, we derived two categorical genetic risk definitions. For Definition 1, a sib pair was considered to possess the risk allele at a chromosomal location if the pair contributed to linkage at one or more linkage peaks. For Definition 2, a sib pair was considered to possess the risk allele at a chromosomal location if the pair contributed to linkage at two or more linkage peaks. These two estimations of risk allele status were used to group families into those likely to possess the risk allele and those unlikely to possess the risk allele. Then, in order to test for G−E correlations, t tests were run on these groups to determine if environments differed by genetic risk status.
Another regression-based linkage method that is appropriate for selected samples is the Merlin regress (Sham, Purcell, Cherney, & Abecasis, Reference Sham, Purcell, Cherny and Abecasis2002). In contrast to the DF method, which predicts the co-sibs' phenotype from ibd status, controlling for the proband's phenotype, the Merlin-regress method exchanges the independent variable and the dependent variable, predicting ibd from the phenotypic relation between sibs. The logic is that if the relationship between the phenotypes of siblings can be used to predict their ibd status, then linkage is established. This method is not affected by sample selection because biased regression coefficients only result from selection on the dependent variable, not the independent variable (Sham et al., Reference Sham, Purcell, Cherny and Abecasis2002). Because studies almost always select via trait values and not ibd sharing, the method is robust to selection.
As a secondary linkage method, we ran Merlin regress with multipoint estimations every 0.5 cM. The Merlin 1.0 alpha release was used for the analyses (Abecasis & Wigginton, Reference Abecasis and Wigginton2005). The Merlin-regress method requires estimations of the mean, variance, and heritability of the phenotypes in the unselected population. Misspecification of these values, especially the mean, can result in a loss of power (Sham et al., Reference Sham, Purcell, Cherny and Abecasis2002). As a result, we set a liberal p < .05 (one-tailed) value for interpreting the results of the Merlin regress because we did not possess ideal population estimates. Because of the potential loss of power because of misspecification, we attempted to estimate the population mean and variance for our phenotypes using Shriberg et al.'s (Reference Shriberg, Tomblin and McSweeny1999) calculation that 3.8% of 6-year-old children in an epidemiological sample qualify for a speech delay diagnosis. We tried to mimic a population sample by forming a composite sample from our control sample and SSD sample. We included all of our children who met criteria for a “persistent” speech problem (n = 31) and then weighted the control sample so that these persistent children would compose 3.8% of the sample. Then, we calculated the mean and variance of the composite sample. For estimating the heritability of the phenotypes, we relied on two population-based twin studies that have collected measures in children aged 4–6 years old that are similar to those included in the current study, the Twins' Early Development Study study (Colledge et al., Reference Colledge, Bishop, Koeppen-Schomerus, Price, Happe and Eley2002; Kovas et al., Reference Kovas, Hayiou-Thomas, Oliver, Dale, Bishop and Plomin2005) and the Longitudinal Twins Study (Byrne et al., Reference Byrne, Delaland, Fielding-Barnsley, Quain, Samuelsson and Hoien2002, Reference Byrne, Wadsworth, Corley, Samuelsson, Quain and DeFries2005; Samuelsson et al., Reference Samuelsson, Byrne, Quain, Wadsworth, Corley and DeFries2005).
Results
The results focus on three primary issues: (a) localizing linkage peaks on chromosome 1, 6, and 15 with an expanded set of speech, language, and preliteracy phenotypes; (b) testing for G−E correlations; and (c) testing for G × E.
Linkage analyses
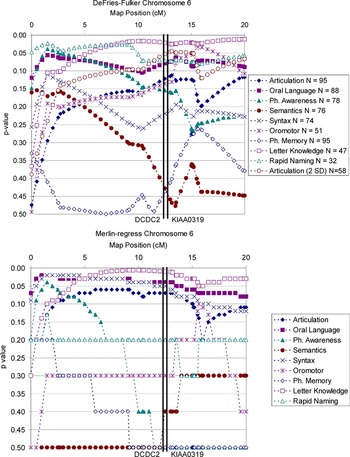
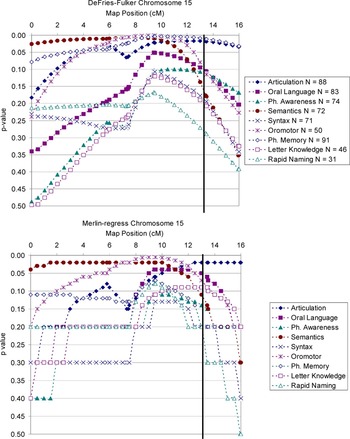
The purpose of these analyses was to localize the linkage peaks on chromosome 1, 6, and 15 with an expanded set of phenotypes following after the analyses of Smith et al. (Reference Smith, Pennington, Boada and Shriberg2005). Localization of the linkage peaks with the expanded set of composite phenotypes was necessary to conduct tests of G × E at these peaks. Results for the DF basic equation and Merlin regress for chromosomes 6 and 15 are depicted in Figures 2 and 3, respectively. Sample sizes are provided for the DF analysis because they change with each linkage analysis because different numbers of sib pairs qualify for the 1 SD severity selection depending on the phenotype. The lines are dotted to signify that they represent interpolations between the 0.5-cM multipoint estimations. In the case of the DF analysis, the p value is obtained by the test of significance of the beta weight (B2) term in the basic equation

where C represents the co-sib's phenotypic score, P represents the proband's phenotypic score, and π^ is the sib pair's estimated ibd value at a particular marker.
The linkage of chromosome 6 markers and speech, language, and preliteracy phenotypes using the DeFries–Fulker and Merlin-regress linkage methods. The significance of the linkage (p value) is graphed against the chromosomal position of the markers on 6p22, with the p terminus to the left and the centromere to the right. The approximate locations of the two proposed reading disability candidate genes, DCDC2 and KIAA0319, are also indicated. [A color version of this figure can be viewed online at www.journals.cambridge.org]

The linkage of chromosome 15 markers and speech, language, and preliteracy phenotypes using the DeFries–Fulker and Merlin-regress linkage methods. The significance of the linkage (p value) is graphed against the chromosomal position of the markers on 15q21, with the q terminus to the right and the centromere to the left. The approximate location of a proposed reading disability candidate gene, DYX1C1, is also indicated by the vertical line. [A color version of this figure can be viewed online at www.journals.cambridge.org]

Consistent with the results of Smith et al. (Reference Smith, Pennington, Boada and Shriberg2005), the weakest evidence for linkage was obtained on chromosome 1. There was no significant evidence for linkage with the DF method and only the Semantics composite reached the p < .05 cut-off with the Merlin-regress method. In addition, similar to the results of Smith et al. (Reference Smith, Pennington, Boada and Shriberg2005) that showed marginally significant linkage with an articulation measure on chromosome 1, the articulation composite in the current study approached trend-level significance (p = .11) with the Merlin-regress method. Because there was not consistent evidence of linkage at this 1p36 locus, we did not conduct G × E analyses using this locus.
The chromosome 6 graphs showed a complicated pattern with possible evidence for two separate linkage peaks at ∼2 and ∼12–16 cM. The PA and LK phenotypes showed converging evidence for linkage across methods. With the DF method, there was also evidence for linkage of the oromotor and RSN phenotypes, whereas these phenotypes approached a trend-level significance with the Merlin regress (p = .10 and .13, respectively).
Turning more specifically to the results of the DF linkage, it can be seen in Figure 2 that the articulation phenotype came close to a trend (p = .11) in the analysis of 6p22. The fact that our articulation phenotype did not reach significance was surprising because a related phenotype had reached significance in the DF augmented analysis conducted by Smith et al. (Reference Smith, Pennington, Boada and Shriberg2005). Nevertheless, there is a precedent in the literature that more severe selection is needed to identify linkage peaks at this risk locus (Deffenbacher et al., Reference Deffenbacher, Kenyon, Hoover, Olson, Pennington and DeFries2004). As such, we also conducted a DF regression with the articulation phenotype using more severe selection criteria, 2 SD below the control mean. With this more severe selection, the articulation phenotype did reach the p < .05 cutoff for linkage.
On chromosome 15, the articulation, semantics, and oromotor phenotypes showed linkage with both methods at the same markers. The PM phenotype showed evidence for linkage using the DF method and a trend-level significance with the Merlin-regress method (p = .07).
In summary, these linkage analyses allowed us to localize the linkage peaks associated with speech, language, and preliteracy phenotypes on 6p22 and 15q21. There was generally good correspondence between the two linkage methods in terms of morphology of the graphs and phenotypes showing linkage. The markers nearest the identified linkage peaks were used to explore G−E correlations and G × E.
G−E correlations
The set of five environmental variables determined to have an impact on speech, language, and/or literacy skills was screened for G−E correlations because we wanted to exclude the possibility that G−E correlations were responsible for any G × E that we detected. We took a categorical approach to this analysis, using genetic risk Definitions 1 and 2 at the chromosome 6 and 15 loci derived from the DF beta statistics. Within each family, if more than one sib pair from the same family was included in a linkage analysis (because of double-entry or multiple sibships), we selected the DF beta value that represented the largest contribution to linkage. Using this within-family DF beta, we derived the categorical genetic risk variables. We split the sample into families at high risk for possessing the risk allele and those at low risk at the chromosome 6 and 15 locations according to Definitions 1 and 2. We conducted t tests (one tailed) to examine whether increased genetic risk at a chromosomal location was associated with a poorer environment. For maternal education, results showed that mothers from families that were at risk for possessing the risk allele on chromosome 15 had fewer years of education according to Definition 2, t (57) = 2.21, p < .05, but not Definition 1. None of the other environmental variables showed a significant group difference. As such, we excluded the maternal education variable from G × E analyses on chromosome 15. It is important to note that, to the best of our ability, we excluded environmental variables that were significantly associated with genetic risk at the loci of interest in this study. However, this does not preclude the possibility that other genes in the genome influenced these environmental variables. We turn now to the G × E analyses conducted at the previously determined linkage peaks on 6p22 and 15q21 using the DF analysis.
G × E
For these analyses, the extended DF model was used to test for G × E (Fulker et al., Reference Fulker, Cardon, DeFries, Kimberling, Pennington and Smith1991). The extended equation is

where E is an environmental measure and the beta weight of interest is B5, which estimates the significance of the G × E. The extended model was run with the five qualifying environmental variables and five significant linkage phenotypes on chromosome 6 and with the four qualifying environmental variables (maternal education excluded) and four significant linkage phenotypes on chromosome 15. Each of the environmental variables was a shared environment between siblings with the exception of the number of ear infections. In this case, the co-sib's number of ear infections was entered as the environmental variable in the model because the question for the analysis was whether the ear infections of the co-sib interacted with his/her genetic background to predict his/her phenotypic score. As before, the standard errors of the B weights were corrected for double entry. Because considerable power is necessary to detect interactions and because the double-entry correction is known to be conservative, we noted nonsignificant trends of p < .1 (two tailed) for the G × E terms.
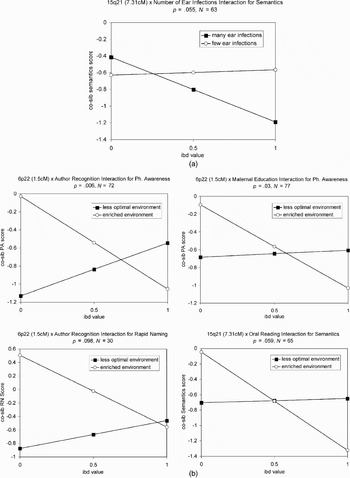
We predicted bioecological G × E between the genetic risk loci and the environmental variables. Four of the five interactions followed this pattern, but one of the interactions between the chromosome 15 locus and the number of ear infections was in the diathesis–stress direction. Figure 4 plots these continuous interactions according to recommendations by Aiken and West (Reference Aiken and West1991). We plotted the lines for the case where the proband's score is at the mean for the proband group (e.g., −1) and 0 represents the control mean. The environmental variable is either 1 SD above or below the mean, corresponding to the labels of “enriched” and “less optimal” environment, respectively. The one diathesis–stress G × E is plotted in Figure 4a, followed by the four bioecological G × E in Figure 4b. As is shown in Figure 4b, the two G × E with author recognition as the environmental variable appear to have a positive slope for the less optimal environment line. To test if the slopes of these lines were significantly different from 0, we conducted a simple slopes analysis according to the recommendations of Aiken and West (Reference Aiken and West1991). For the Gene × Author Recognition interaction for PA, the slope of the enriched environment line was significantly different from 0 (p < .01), but the slope of the less optimal environment line was not significantly different from 0 (p = .16). Similarly for the Gene × Author Recognition Trend interaction for RSN, the slope of the enriched environment line trended toward being significantly different from 0 (p = .06), but the slope of the less optimal environment line was not significantly different from 0 (p = .52). Thus, for the four bioecological interactions, the slope of the less optimal environment was not significantly different from 0, whereas the enriched environments showed a significantly negative slope. Consistent with the bioecological model, the direction of these slopes indicated that genetic factors exerted more influence on the phenotype in the enriched environment than in the less optimal environment.
Gene × Environment interaction plots of (a) the diathesis–stress interaction with the 15q21 locus and number of ear infections for the semantics phenotype and (b) the four bioecological interactions.

Figure 4 also shows that there were two trends for G × E in predicting the semantics phenotype, but these interactions were in opposite directions (one interaction was in the bioecological direction and the other was in the diathesis–stress direction). We correlated the two environmental variables from the G × E, oral reading, and number of ear infections, to ensure that this was not a spurious finding, such that, in this sample, children who had many ear infections happened to have parents who read to them often, and vice versa. The result showed that a spurious correlation was not the likely cause of the different directionalities of the interactions, r (59) = −.17, p = .19.
The fact that only one of the G × E was in the diathesis–stress direction led us to conduct follow-up analyses to explore whether this finding may be spurious. We conducted the G × E ear infection analysis with three phenotypes that showed nonsignificant trend-level linkage (p < .15), at the 15q21 locus, syntax, PA, and LK. Although none of the G × E tests reached significance (p = .25–.35), they were all in the diathesis–stress direction. Thus, the validity of this G × E remains an open question.
In summary, we had expected to find bioecological G × E such that children's genetic background would be manifested in their phenotypic scores in enriched environments, but their genetic background would be masked in poorer environments. Four of the five significant and trend-level G × E were in this direction. Each of these interactions involved shared environmental variables between siblings (maternal education, parent author recognition, and shared oral reading). The only G × E in the diathesis–stress direction was with an environment unique to the siblings and of a qualitatively different nature–number of ear infections.
Discussion
Smith et al. (Reference Smith, Pennington, Boada and Shriberg2005), using substantively the same sample as the current study, reported linkage of speech phenotypes to known RD loci on 6p22 and 15q21 as well as suggestive linkage to 1p36. The aim of the current study was to extend these findings by examining G × E. We reran the linkage analyses using an expanded set of speech, language, and preliteracy phenotypes to identify linkage peaks for the purpose of conducting G × E analyses. We found evidence for bioecological type G × E at both the 6p22 and 15q21 loci with several different phenotypes and home environmental variables. We also found evidence for one diathesis–stress type G × E with the 15q21 locus and number of ear infections predicting the semantics phenotype.
One constraint on these findings is that the linkage results obtained by Smith et al. (Reference Smith, Pennington, Boada and Shriberg2005) and the current study are still preliminary because the sample size is small. In addition, both Smith et al. (Reference Smith, Pennington, Boada and Shriberg2005) and the current study employed more liberal significance tests than is typical in linkage studies because there was a strong hypothesis about the predicted linkage locations in previously identified RD regions. However, despite these limitations, there are encouraging findings emerging from attempted replications of these linkage results in an independent SSD sample. There is preliminary support for replication of the 1p36 and 6p22 locus (S. Iyengar, personal communication, September 8, 2006; Miscimarra et al., Reference Miscimarra, Stein, Millard, Kluge, Cartier and Freebairnin press) and there is evidence for a possible replication of the 15q21 locus, although these results are ambiguous because the linkage peak is closer to genes associated with autism and Prader–Willi/Angelman syndrome than the region associated with dyslexia and SSD (Stein et al., Reference Stein, Millard, Kluge, Miscimarra, Cartier and Freebairn2006). These constraints notwithstanding, there are several novel aspects of the current study. This study tested for G × E in the prediction of speech, language, and preliteracy skills, which are domains in which G × E has been relatively neglected. In addition, the current study utilized molecular genetic methods to test for G × E, which is preferable to behavioral genetic studies because more specific genetic influences are measured (Rutter et al., Reference Rutter, Moffitt and Caspi2006). Turning to the specific results of the current study, we will first discuss the linkage results followed by a discussion of G × E. Finally, we will discuss the limitations of the study and future directions for research.
Linkage results
This discussion will focus on the 6p22 and the 15q21 loci, which showed the strongest evidence of linkage in both the current study and Smith et al. (Reference Smith, Pennington, Boada and Shriberg2005). On chromosome 6, we found converging evidence of linkage from the DF basic and Merlin-regress methods for the PA and LK phenotypes in the 6p22 region. Both of these phenotypes are considered preliteracy skills that are predictive of later reading abilities (Raitano et al., Reference Raitano, Pennington, Tunick, Boada and Shriberg2004; Scarborough, Reference Scarborough1990). A third preliteracy skill, RSN, showed evidence of linkage using the DF method and a trend with the Merlin-regress method. The fact that these preliteracy skills showed evidence of significant linkage to 6p22 is consistent with previous linkage and association studies reporting an RD risk locus in this region (for a review, see Fisher & DeFries, Reference Fisher and DeFries2002; Fisher & Francks, Reference Fisher and Francks2006; McGrath, Smith, & Pennington, Reference McGrath, Smith and Pennington2006). The oromotor phenotype also showed linkage to the 6p22 region. This linkage was somewhat unexpected because this phenotype is arguably the least related to RD among those tested in this study. However, Lewis and colleagues (Lewis et al., Reference Lewis, Shriberg, Freebairn, Hansen, Stein and Taylorin press; Stein et al., Reference Stein, Schick, Gerry Taylor, Shriberg, Millard and Kundtz-Kluge2004) also found that an oromotor variable in their SSD sample was linked to a previously identified RD locus on chromosome 3. It is of interest that we also found that our oromotor phenotype linked to the 15q21 region, which, together with the Lewis results, argues against a spurious finding.
Two candidate genes for RD in the 6p22 region have recently been proposed: DCDC2 (6p22.1; Deffenbacher et al., Reference Deffenbacher, Kenyon, Hoover, Olson, Pennington and DeFries2004; Meng, Smith, et al., Reference Meng, Smith, Hager, Held, Liu and Olson2005; Schumacher et al., Reference Schumacher, Anthoni, Dahdouh, Konig, Hillmer and Kluck2006) and KIAA0319 (6p22.3–6p22.2; Cope, Harold, et al., Reference Cope, Harold, Hill, Moskvina, Stevenson and Holmans2005; Francks et al., Reference Francks, Paracchini, Smith, Richardson, Scerri and Cardon2004; Paracchini et al., Reference Paracchini, Thomas, Castro, Lai, Paramasivam and Wang2006). Both genes are expressed in the brain and play a role in neural migration (Meng, Smith, et al., Reference Meng, Smith, Hager, Held, Liu and Olson2005; Paracchini et al., Reference Paracchini, Thomas, Castro, Lai, Paramasivam and Wang2006). Of the markers used in this study, the D6S1554 (13.16 cM) marker is closest to the DCDC2 and KIAA0319 genes (see Figure 2 for a visual depiction of the approximate location of these candidate genes relative to the chromosome 6 linkage peaks).
Given the location of these candidate genes near D6S1554, it is not surprising that many of the phenotypes (LK, oromotor, articulation) that showed linkage to the 6p22 region showed peaks near this marker. However, two of the phenotypes, RSN and PA, showed peaks in a more telomeric direction in the 6p22.3 region at 1.5 cM (D6S274). Although this linkage peak is more telomeric than is typically reported in linkage studies of the 6p22 region, Grigorenko et al. (Reference Grigorenko, Wood, Meyer, Hart, Speed and Shuster1997) did report significant linkage to a nearby marker, D6S109, for a PA phenotype. The D6S109 marker is about 4 cM in the centromeric direction from the D6S274 marker (Kong et al., Reference Kong, Murphy, Raj, He, White and Matise2004). Given the relative imprecision of linkage studies in resolving genetic neighborhoods, it is possible that our peak at D6S274 and Grigorenko et al.'s peak at D6S109 are detecting the same locus near the proposed candidate genes, with the variability in linkage peaks attributable to the informativeness of the markers. However, further studies will be needed in order to determine if this more distal linkage peak is (a) related to the candidate genes discussed above, (b) a false positive, or (c) associated with another yet to be identified gene in this region.
On chromosome 15, we found converging evidence from both linkage methods for the semantics, oromotor, and articulation phenotypes. The PM reached significance in the DF analysis and trend-level significance with the Merlin-regress method. Notably missing among these phenotypes showing linkage were the preliteracy variables, considering that the 15q21 region has been identified as an RD locus. Smith et al. (Reference Smith, Pennington, Boada and Shriberg2005) also noted that speech and language phenotypes showed stronger linkage than the preliteracy phenotypes, suggesting that the 15q21 region might be more salient for speech and language disorders. However, it is difficult to make an argument for differential linkage when the phenotypes are correlated (Pennington, Reference Pennington1997). Nevertheless, these results suggest that this locus may also be related to SLI phenotypes. Semantic deficits are a hallmark of SLI and PM deficits have been proposed as the core cognitive deficit in SLI (Gathercole & Baddeley, Reference Gathercole and Baddeley1990). To date, this region has not emerged in genome-wide scans of SLI (Bartlett et al., Reference Bartlett, Flax, Logue, Vieland, Bassett and Tallal2002; SLI Consortium, 2002, 2004), but the nature of the linkage peaks in the 15q21 region suggest that it may be worth further investigation.
The linkage peaks in the 15q21 region were remarkably consistent, spanning the 9.43–13.43 cM region (markers D15S1017–D15S1029). A candidate gene in this region for dyslexia has also been proposed: DYX1C1 (15q21.3, also known as EKN1; Taipale et al., Reference Taipale, Kaminen, Nopola-Hemmi, Haltia, Myllyluoma and Lyytinen2003), although attempted replications have produced mixed findings and none of the studies to date have replicated the proposed risk allele (Bellini et al., Reference Bellini, Bravaccio, Calamoneri, Donatella Cocuzza, Fiorillo and Gagliano2005; Cope, Hill, et al., Reference Cope, Hill, van den Bree, Harold, Moskvina and Green2005; Marino et al., Reference Marino, Giorda, Luisa Lorusso, Vanzin, Salandi and Nobile2005; Meng, Hager, et al., Reference Meng, Hager, Held, Page, Olson and Pennington2005; Scerri et al., Reference Scerri, Fisher, Francks, MacPhie, Paracchini and Richardson2004; Wigg et al., Reference Wigg, Couto, Feng, Anderson, Cate-Carter and Macciardi2004). This gene is expressed in the brain and plays a role in neural migration (Taipale et al., Reference Taipale, Kaminen, Nopola-Hemmi, Haltia, Myllyluoma and Lyytinen2003; Wang et al., Reference Wang, Paramasivam, Thomas, Bai, Kaminen-Ahola and Kere2006). The nearest marker to DYX1C1 from this study is D15S1029 (13.43 cM). Unfortunately, 73% of the individuals (parents and co-sibs) were missing information for the D15S1029 marker in this sample, so it turned out to be a less informative marker than the nearby marker D15S1017, at 9.43 cM. The missing data may explain why the linkage peaks were closer to the D15S1017 marker (9.43 cM) than the D15S1029 marker (13.43 cM; see Figure 3 for a visual depiction of the location of this candidate gene relative to the chromosome 15 linkage peaks). Nevertheless, the obtained linkage peaks for our phenotypes are consistent with the location of the candidate gene.
Overall, these linkage findings are consistent in showing linkage of speech, language, and preliteracy phenotypes to the previously identified RD risk loci on 6p22 and 15q21. The most parsimonious explanation of these findings is that a single gene in these regions is pleiotropic for the different phenotypes (see Willcutt et al., Reference Willcutt, Pennington, Smith, Cardon, Gayan and Knopik2002, for a similar argument for RD and attention-deficit/hyperactivity disorder). However, these findings do not rule out the possibility that there are two or more genes in close proximity in these regions that are separately responsible for the linkage of speech, language, and reading phenotypes.
G × E
We hypothesized that there would be bioecological G × E, such that optimal environments would allow genetic effects to be manifested, whereas poorer environments would mask those genetic effects (Bronfenbrenner & Ceci, Reference Bronfenbrenner and Ceci1994). Four of the five significant and trend G × E were in this direction. All of these interactions involved variables related to the home language/literacy environment: maternal education, parent author recognition, and shared oral reading, in predicting preliteracy or language skills. The phenotypes that showed the strongest evidence for G × E (PA and semantics) were also phenotypes that showed convergence from both the DF and Merlin-regress methods for significant linkage. In terms of the DF analysis, the bioecological G × E emerged because ibd status was more strongly related to the phenotype in enriched environments than in less optimal environments, presumably because poorer performance in the less optimal environments was multidetermined. One implication from these results is that the children from less optimal environments in this sample were weakening the linkage signal.
Only one of the G × E was in the diathesis–stress direction. This trend-level interaction was between the 15q21 locus and the number of ear infections in predicting the semantics phenotype. This interaction is potentially theoretically interesting considering the mixed findings in the literature regarding the impact of OME on speech–language development; however, caution must be exercised in interpreting this interaction because our methods of assessing episodes of OME were coarse. We used parent retrospective report, which may be unreliable and does not provide information on whether involvement was unilateral or bilateral and, crucially, on the documented presence and level of hearing loss in one or both ears. Nevertheless, the G × E results suggest a possible reason for why OME might be found as a risk factor in speech–language clinical samples or disadvantaged samples, which are more likely to have speech and language genetic risk factors (e.g., Shriberg, Flipsen, et al., Reference Shriberg, Flipsen, Thielke, Kwiatkowski, Kertoy and Katcher2000), but not in an epidemiological sample, in which such risk factors would be attenuated (e.g., Campbell et al., Reference Campbell, Dollaghan, Rockette, Paradise, Feldman and Shriberg2003). This hypothesis is in line with Shriberg and colleagues (Shriberg, Flipsen, et al., Reference Shriberg, Flipsen, Thielke, Kwiatkowski, Kertoy and Katcher2000; Shriberg, Friel-Patti, et al., Reference Shriberg, Friel-Patti, Flipsen and Brown2000) multifactorial model, which proposes that child factors, including both risk and protective genetic and environmental factors, may moderate or mediate the effects of hearing loss associated with OME on later speech–language development.
Another trend-level G × E that we obtained for the semantics phenotype also has potential theoretical relevance. The interaction we obtained between the 15q21 locus and shared oral reading for the semantics phenotype might partially explain some of the controversy in the literature regarding the magnitude of the effect of shared reading on language and literacy skills (Bus et al., Reference Bus, van IJzendoorn and Pellegrini1995; Dunning et al., Reference Dunning, Mason and Stewart1994; Lonigan, Reference Lonigan1994; Scarborough & Dobrich, Reference Scarborough and Dobrich1994a, Reference Scarborough and Dobrich1994b). Depending on the genetic background of the sample studied, the effect size of shared reading practices may be different. Given the bioecological direction of the interaction, if the sample is not at genetic risk for reading and language problems, the impact of shared reading will likely be positive. However, if the sample is at genetic risk for reading and language problems, the effect of shared reading may seem minimal. Thus, consideration of G × E may help to resolve some of the controversy regarding the impact of shared reading on language and literacy development.
Limitations and Future Directions
The primary limitation of this study is the small sample size and the potential for Type I error. This study was necessarily exploratory given the novel methodologies employed. Nevertheless, the consistency of the bioecological G × E across phenotypes, genetic loci, and environments argues against spuriousness. We consider the results preliminary, but worthy of further exploration and attempted replication.
Another limitation of this study concerns the range of SES and home language/literacy environments represented in the sample. Efforts were made to recruit participants representing a large range of SES, but the sample is not an epidemiological sample. Because of volunteer biases, we did not recruit many participants in the most impoverished circumstances so we cannot comment on the generalization of these findings to children in more severe environmental circumstances. For example, the mean years of maternal education in this sample was approximately 16 years. One standard deviation below this value, the cutoff that we termed the “less optimal environment,” was 13 years of education, which still represents 1 year of college education.
The restricted range of environments limits interpretation of the findings in some cases. For example, although it appears from the graphs in Figure 4b that children in enriched environments with increased genetic risk (ibd = 1) perform worse than children from less optimal environments, it would be erroneous to draw this conclusion without the full range of environmental circumstances represented. Nevertheless, it is interesting that G × E could be detected even within this relatively small range of environments.
It is also possible that we would have obtained different types of G × E if more severe environments were represented. In fact, there is preliminary evidence from the current study that G × E may differ according to the severity of the environmental risk. For example, our home language/literacy environmental variables in this sample could be regarded as indexing the advantage of the home because even the lowest value could still be seen as adequate for child rearing. In contrast, the number of ear infections variable could be seen as indexing the disadvantage of the child's early risk for transient hearing loss. For some children, parents reported up to 20 ear infections, which could be associated with sustained mild to significant hearing impairment in one or both ears. In contrast, children with no history of ear infections were not advantaged per se, but merely had a developmental history uncomplicated by the risk of transient hearing loss associated with OME. Thus, the different scales of the environmental variables, with the home language/literacy environment covering the range from adequate to enriched and the number of ear infections variable covering the range from no risk to high risk, may provide one explanation for the different directions of the G × E involving these different environmental variables.
It is an inherent limitation of the G × E line of research that it is difficult to disentangle the extent to which a measured environment is genetically determined. We attempted to ensure that the environmental variables in this study were independent of genetic risk at the loci on 6p22 and 15q21 by testing for environmental differences as a function of family genetic risk (G−E correlations). However, we acknowledge that the environmental variables reported in this study may be under the influence of other genes, besides the regions tested here, and even the current genetic regions if our tests of G−E correlations were not sensitive enough to detect the effect.
The genetic methods in this study are also limited by the current state of the SSD genetic literature. To date, linkage studies have focused on known RD risk loci (Miscimarra et al., Reference Miscimarra, Stein, Millard, Kluge, Cartier and Freebairnin press; Smith et al., Reference Smith, Pennington, Boada and Shriberg2005; Stein et al., Reference Stein, Schick, Gerry Taylor, Shriberg, Millard and Kundtz-Kluge2004, Reference Stein, Millard, Kluge, Miscimarra, Cartier and Freebairn2006). Genome-wide screens for SSD are now needed to identify risk alleles that are unique to SSD as well as those that are shared with its associated disorders (e.g., RD, SLI). In addition, although there have been candidate genes identified in the SSD/RD linkage regions, there has yet to be a replicated functional mutation that could be used to identify which individuals possess a risk allele. Until such functional mutations are identified, the biological mechanisms underlying the interaction will remain elusive.
Future studies should explore G × E in other developmental disorders and developmental psychopathologies to determine which disorders tend to show diathesis–stress interactions and which disorders tend to show bioecological interactions. A preliminary pattern has emerged in which G × E in psychopathologies have tended to be in the diathesis–stress direction, whereas G × E in academic and cognitive traits have tended to be in the bioecological direction. Additional research could guide further development of G × E theoretical models.