People are becoming increasingly reliant on mobile devices in emergencies as a lifeline for information, for useful tools, and as a way to let loved ones know they are safe. In addition, people are also more highly connected with social media both at home and work via personal computers, laptops, and mobile devices.
In the modern age, social media is becoming the first source of information and also the first way to communicate messages to more and more people. This is even truer for the under 30 age group. A new American Red Cross poll shows that mobile apps and social media sites are now tied as the fourth most popular way to get information during emergencies, behind television, radio, and online news sites, and the use of this approach is growing. One-fifth of Americans say they have gotten some kind of emergency information from a downloaded app. This could include apps of all types—from emergency apps to those sponsored by news outlets or privately produced apps. In addition to receiving information via apps and social media, nearly 40% of those surveyed would use social media to let loved ones know they are safe during an emergency, with women and households with children more likely to use social channels to send word this way (American Red Cross, unpublished data, December 2013). Older methods of receiving information, such as television, radio, and newspapers, while still present are no longer for many considered the first source and often are used for validation of information already gained from social media.
In addition, whereas in the past the primary mechanism for outbound communication was to place a phone call and preceding that to go talk to someone, today we are seeing more and more communication occurring digitally via texts, tweets, social media posts, and e-mail. Not only is the digital method of communication present in the home and at work, but even out of these locations, where cell phones have been used for years, people are using mobile devices not for placing phone calls but rather to text, tweet, post, and e-mail. This usage of social media and apps is not limited to personal information gathering and sharing. People are using social media to help others during emergencies by spreading useful information. Twelve percent of Americans and one-fifth of online users say they have used the social Web to share or seek information during an emergency. In the early hours of a disaster, most conversations center around people’s individual fears and their safety and well-being or that of their loved ones—not surprising given that social media is a highly personal form of communication.
Because social media users will take action based on the information they are seeing, it is important for the Red Cross and other credible organizations to be active in the social space. It is becoming clear that information in the social space can help people protect themselves and their loved ones. Lastly, when discussing the role of social media and apps in both disaster communication and action, one must also understand, evaluate, and plan for the public’s expectation of the role of apps and social media in disasters. Americans expect emergency responders to monitor their social media accounts and respond quickly if someone requests help via social media. More than one-third of the general public (36%) would expect help to help to arrive in less than 1 hour. Three out of 4 (76%) expect help in less than 3 hours, up from 68% the year before (American Red Cross, unpublished data, December 2013). This could prove to be an important turning point in how much emphasis emergency responders place on using social media during emergencies.
As a result, in emergency management, where receiving communication and information from people to help determine when events have occurred, what assistance may be needed, and where communication to responders, victims, and the public is essential, adaptation must occur in the modes, mechanisms, and approaches to communication to move these into the digital age. What is needed is a new communication hub for the digital age. We describe the American Red Cross’s concept of embracing and leading this digital transformation in emergency management communication, the DigiDOC.
Concept
We describe a concept for a Digital Operations Center that we believe should become an essential part of all emergency operations centers and a key piece of all agencies that operate incident management plans during disasters. The official name for this resource is the Digital Operations Center, but internally it is referred to as the DigiDOC. Although other agencies may have implemented approaches to using social media and apps, we feel the American Red Cross approach provides a practical and logical approach that other agencies can use as a model.
DigiDOC is physically located in the organizational Disaster Operations Center and structurally is a key component of the American Red Cross Incident Management System. The Digital Operations Center is modeled after Dell’s Social Media Command Center. The Digital Operations Center represents our organization's commitment to being a socially accessible organization. A key specific goal of this resource in addition to the obvious role of providing information and receiving information in the digital age by using apps and social media is to give the public a seat at the table of disaster operations.
The public is a vital participant in emergency response and recovery. They are usually the first source of information that an event has occurred and often are the first responders to their own neighbors. They can provide valuable information to the Red Cross and other response agencies. The functional goal is to be informed by and to become a social liaison for people, families, and communities to support one another before, during, and after disasters. The Digital Operations Center enhances information about disaster situations, enables better anticipation of disaster needs, and helps connect people with the resources they need during emergencies for the American Red Cross.
The key areas of this model are:
-
∙ Information gathering,
-
∙ Information dissemination,
-
∙ Linkage with our Emergency Management Plan and Incident Management Team including the Incident Commander and organization leadership, and
-
∙ Staffing.
Information Gathering
Information is obtained by the staff and volunteers who man the DigiDOC from a multitude of digital sources including social media, e-mails, and apps. We can see Twitter, public Facebook posts, forums, blogs, news sites, discussion boards, and video and image sharing sites. We only pull in publicly accessible social conversations. The initial choice of social media to use was related to a combination of public accessibility of all parts of the conversation, possibility for geotagging, and current prevalence of use by the public. Over time, the list of included social media sites and forums will be updated and expanded as appropriate to the mission of this concept. The primary model to integrate and analyze this large volume of information is through the use of what are referred to as “visualizations,” which are graphical summative representations of the social media and other digital communications.
The visualizations are based on what is referred to as a “topic profile.” We can display any combination of these 4 visualizations around any of our active topic profiles. A topic profile is a collection of key words and phrases we use to search an area of interest. For example, we have a topic profile called Red Cross, which allows us to see and break down all public social mentions of the Red Cross and our mission area. We also have a topic profile called Disaster Services, which helps us keep an eye on emergency situations like fires, earthquakes, floods, tornadoes, and hurricanes, even without mention of the Red Cross. In addition to standing topic profiles, new topic profiles can be created on the basis of occurring events. For example, during the tornadoes in the Midwest on February 28, 2012, we quickly created a topic profile to monitor and engage with people affected.
We have established in our model 4 types of visualizations:
-
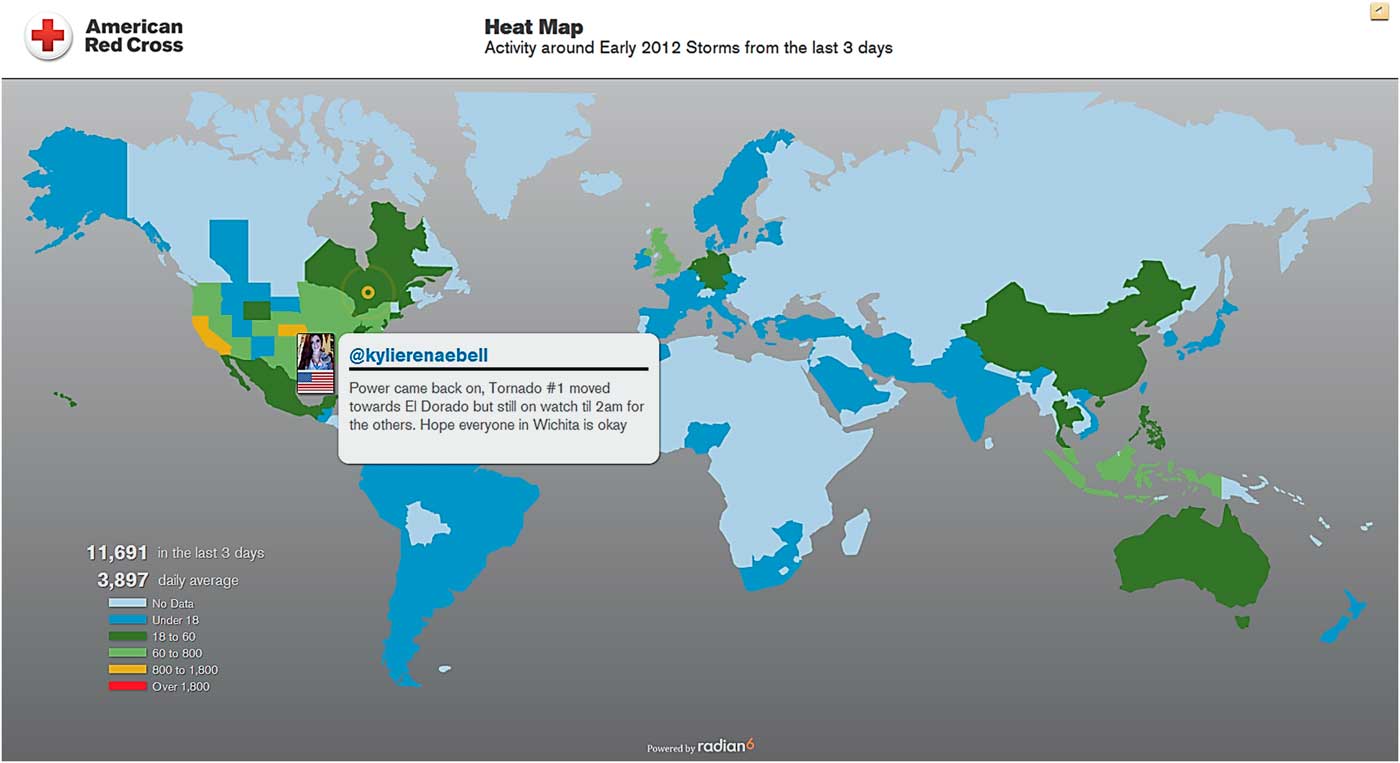
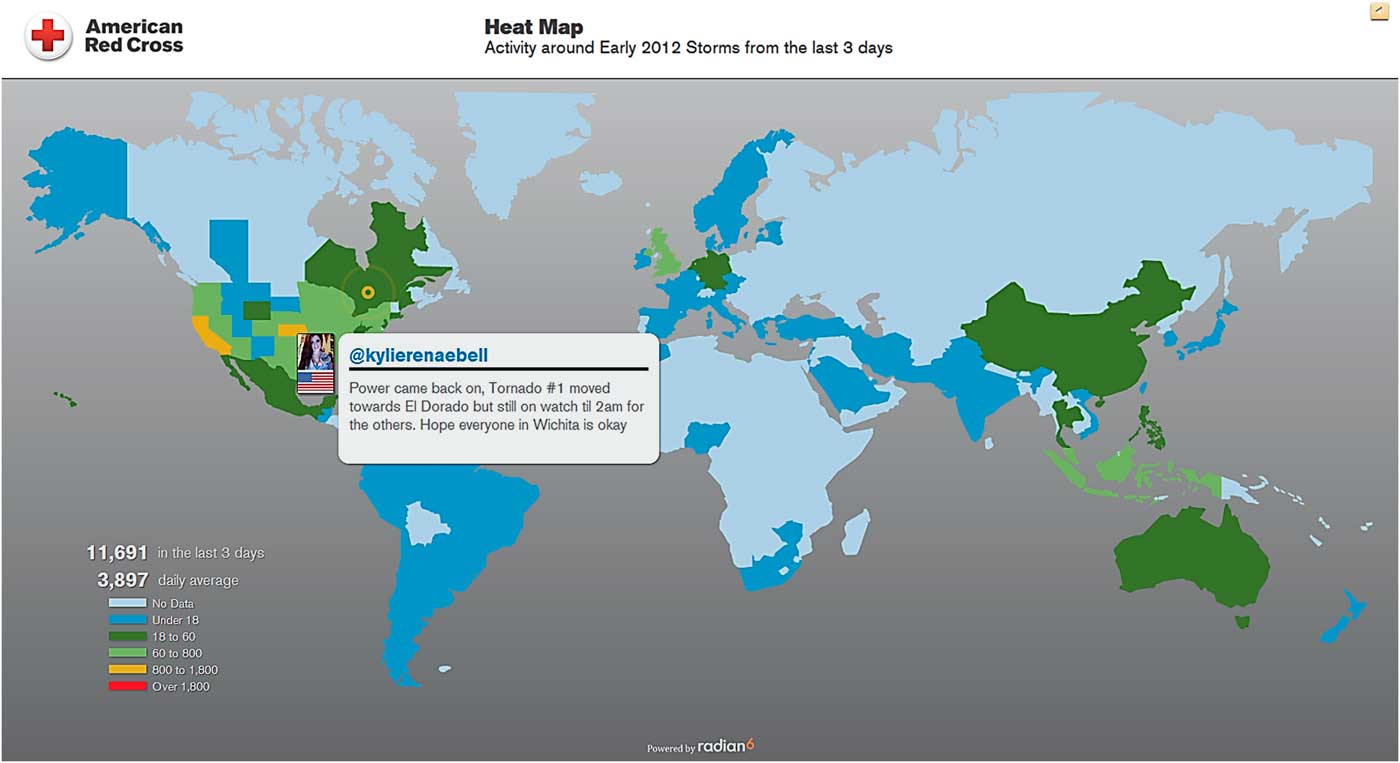
(1) Heat map: illustrates the volume of conversation by geography (Figure 1). Only posts on Twitter are shown on this screen, because the system can often figure out where the person is geographically on the basis of their Twitter profile. The heat map also displays a recent Tweet about the topic about once per minute. This allows us to have an early warning system by both the display of tweets and areas where there is a spike in tweets.
-
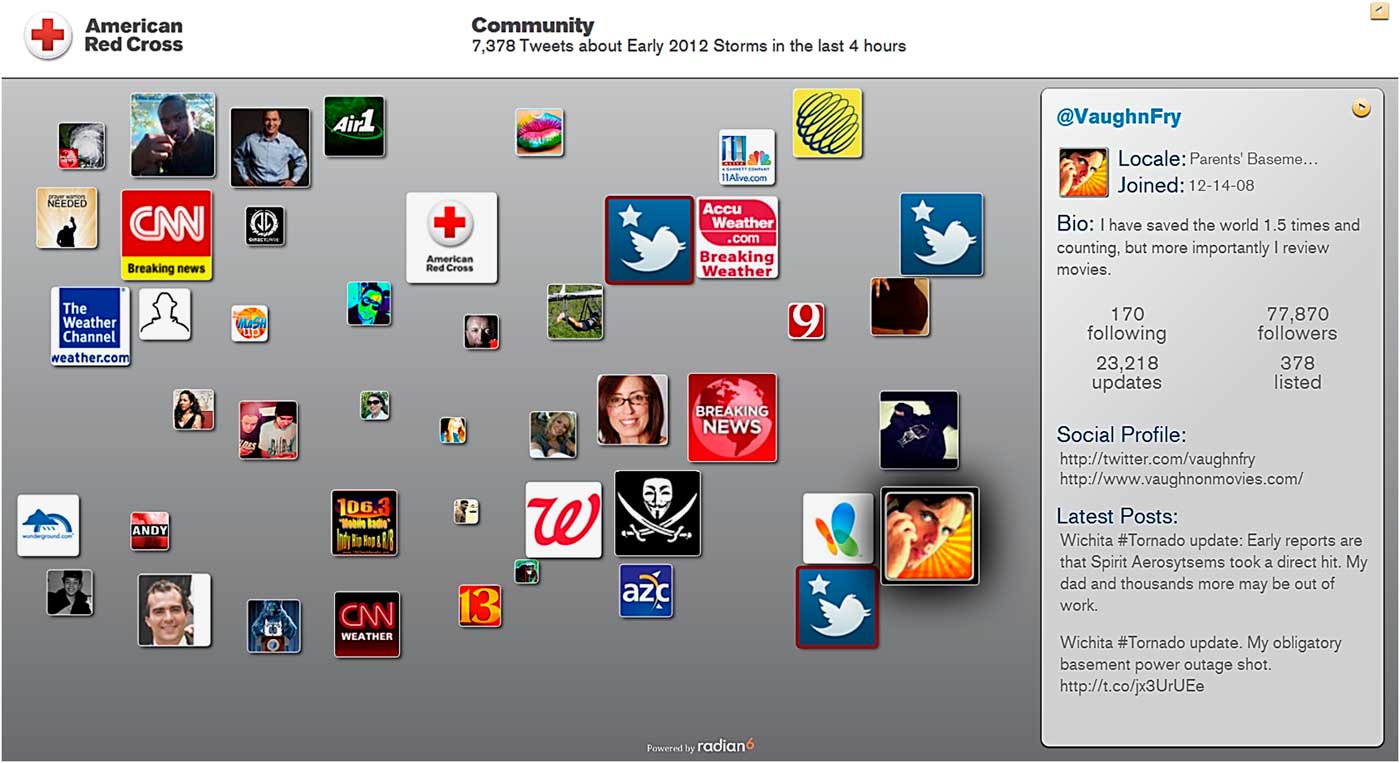
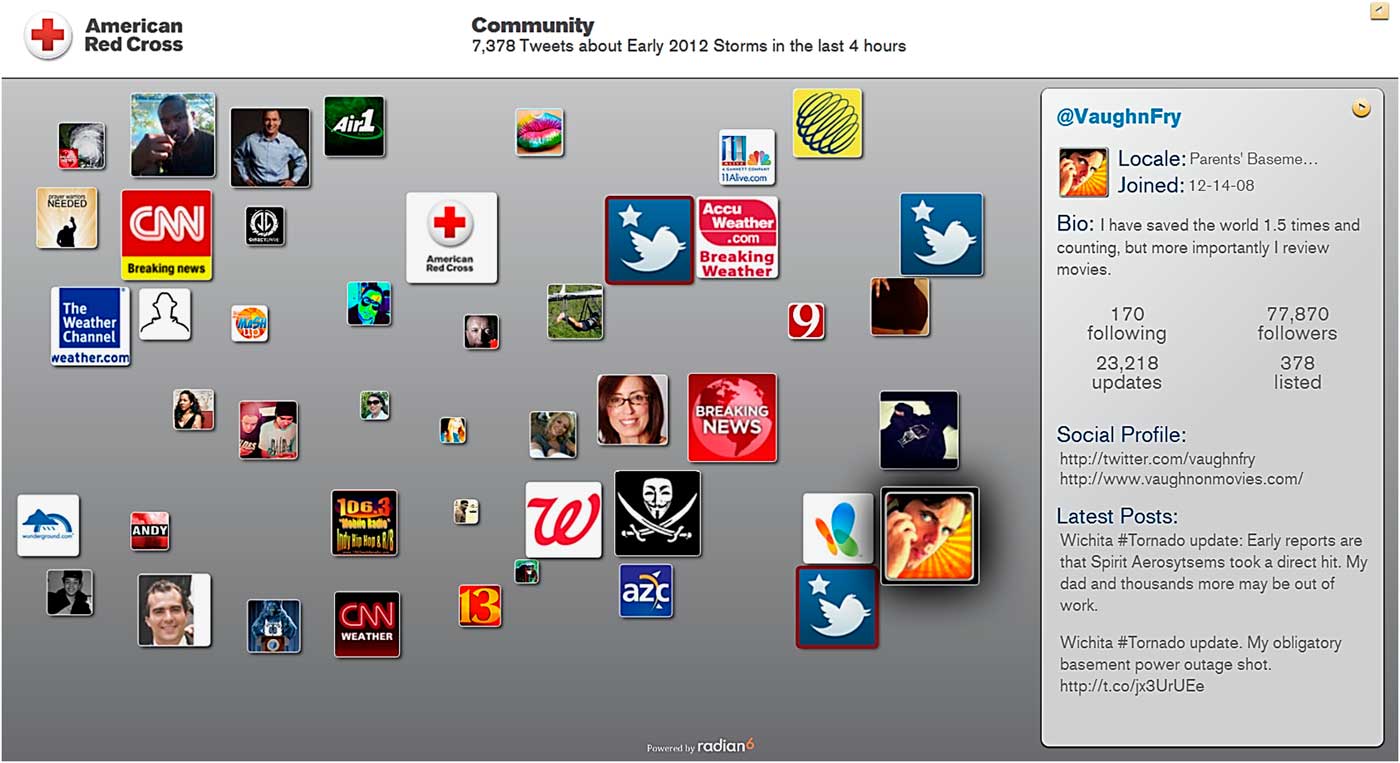
(2) Community screen: illustrates the social profiles of individuals talking about the topic (Figure 2). The larger the profile photo, the more followers that person has. This allows us to track discussions of interest by an individual and determine both the nature and the size of participation in the discussion.
-
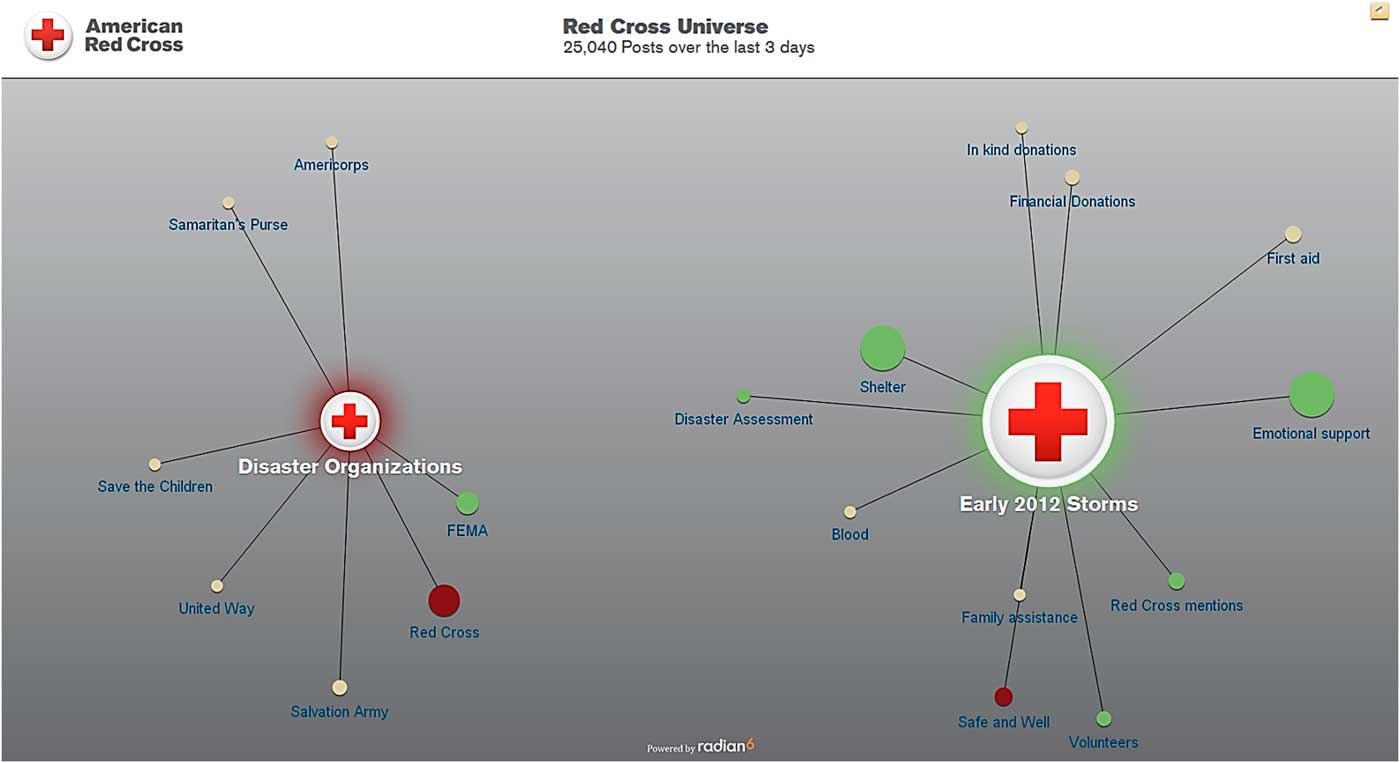
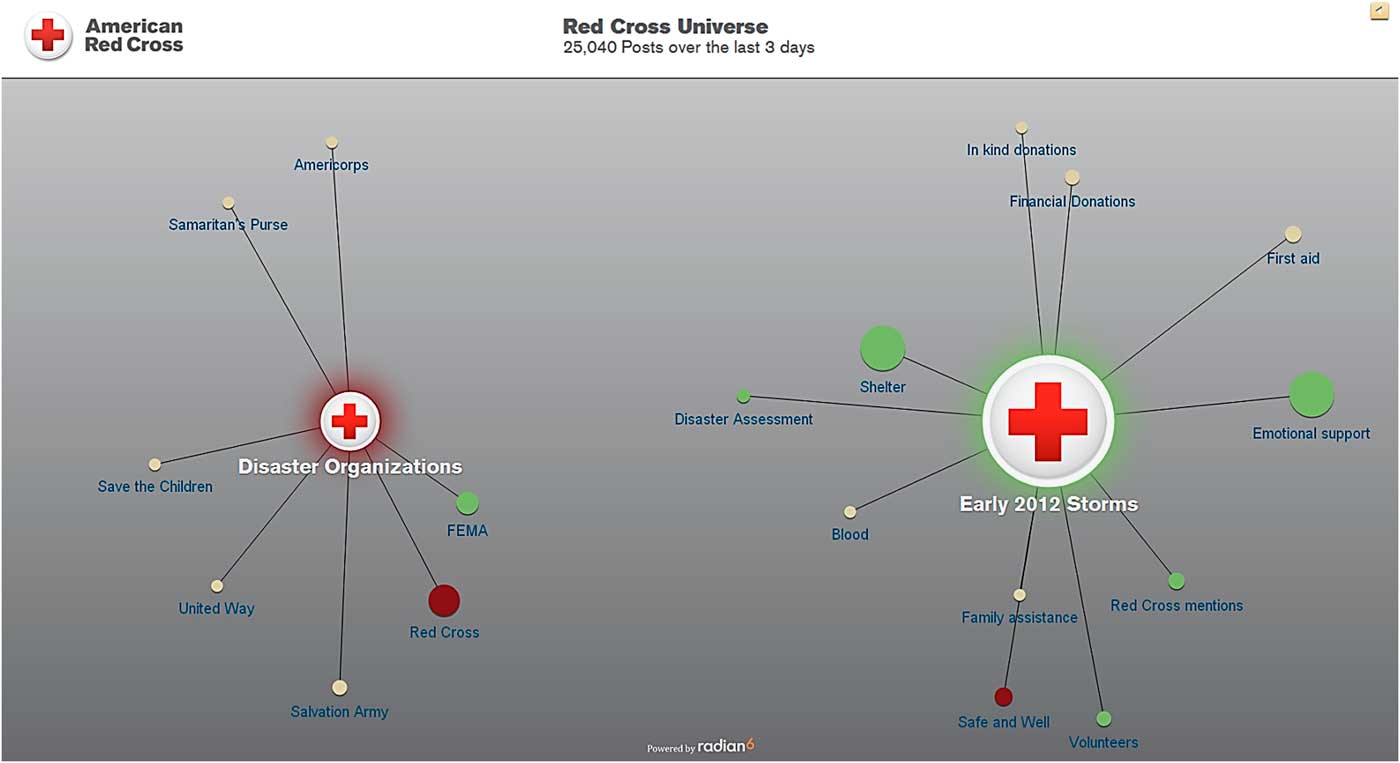
(3) Universe screen: illustrates the volume and sentiment of conversations by key words (Figure 3). We can display and compare up to 3 topics and their corresponding key words at a time. This allows us to follow topics and determine what is being said and the overall sentiment. The circles will glow green, red, or tan depending on whether the posts from the last 3 days have been more positive, negative, or neutral about the Red Cross. Sentiment is measured by an automatic sentiment analysis tool, which while helpful has been shown to not always be accurate. The tool was designed and has been used in customer service areas and uses adjectives and adverbs as well as predefining certain words as positive, negative, or neutral. While working most of the time, a problem is that words may have different sentiments in customer service areas than in emergency management. For example, the tool often thinks that the word “disaster” is negative.
-
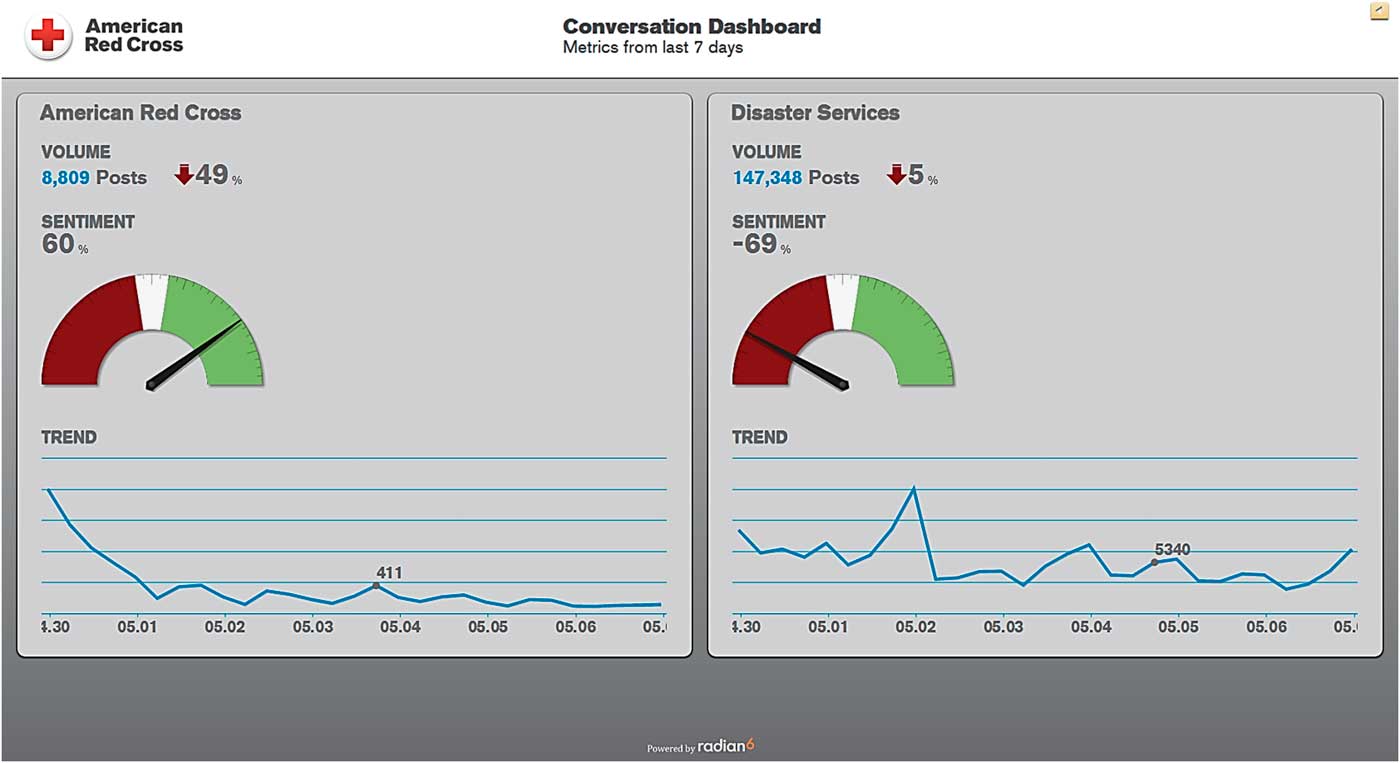
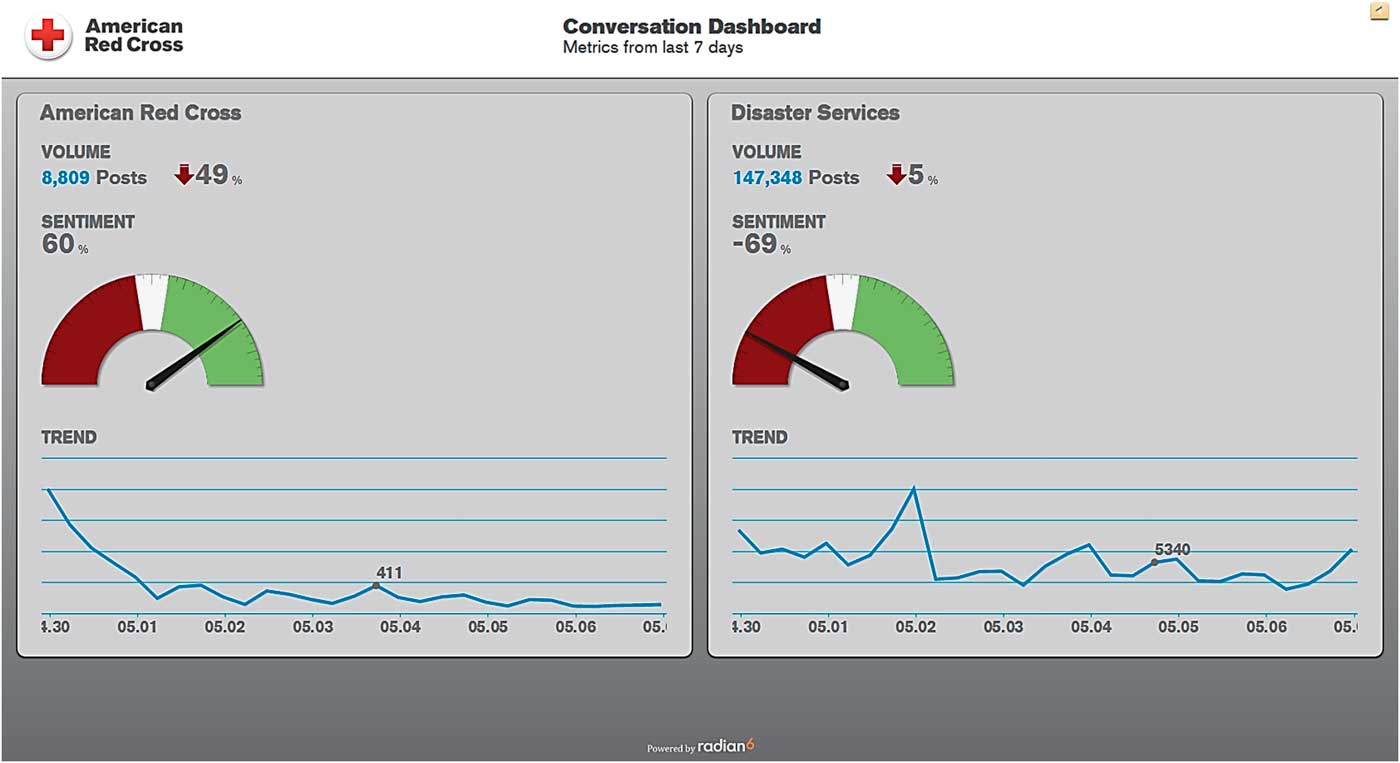
(4) Conversation Dashboard: illustrates the volume of conversation over time, a breakdown of the share of voice within a topic, and the sentiment over time (Figure 4). This allows us to follow ongoing events or subjects of interest.
Heat Map. The heat map screen shows where people have posted from in the last 3 days. As the volume of posts goes up for a certain area, the color changes and becomes “hotter.” Red means highest volume. This volume alone serves as a trigger for attention. A random selection of recent tweets pops up across the map and helps us watch for potential breaking information even if the volume of tweets is not yet large.
Community Screen. The community screen shows tweets about a chosen topic profile and helps us understand who is talking about a particular subject. The screen displays a random selection by using a computer randomization scheme to allow distribution across tweets from the last 4 hours. The bigger the profile image on the screen, the more influence the person has. Influence is measured by the size of the person’s following and also by how often they have talked about this subject.
Universe Screen. The universe screen displays several topic profiles in a sun-and-planet format and shows results from the last 3 days. The “sun” is the primary subject of each topic profile. The “planets” are different groups of key words within that broader subject. For example, the American Red Cross topic profile is broken down by line of business. The relative size of the circles gives an idea of which key words are pulling in more posts. When the system is pulling in new posts, an animation appears with little dots flying into the planets. The circles glow green, red, or tan depending on whether the posts from the last 3 days have been more positive, negative, or neutral about the Red Cross.
Conversation Dashboard. The conversation dashboard is a scorecard of sorts that shows how each topic profile has performed in the last 7 days. Shown are the overall volume of posts, overall sentiment (also measured by the automatic sentiment tool), and the volume trend for each topic profile.
Privacy Concerns
A key area of concern whenever anyone engages in information gathering, especially when discussing the Internet and social media, is privacy concerns. The American Red Cross has as part of this concept very clear controls and plans to address privacy concerns. We only pull in publicly accessible social conversations. We do directly engage with individual public social posts but only to answer questions, provide resources, have a conversation, or provide support. This is monitored and our policies and actions in information gathering are transparent to the public. In this way the public knows our actions in an effort to improve emergency preparedness and response via social media information gathering and the types and limits of our gathering and communications. This transparency also allows any persons with questions about privacy to review our approach and communicate any concerns.
Information Dissemination
It should be recognized that social media is a valuable tool for information gathering in disasters. But information gathering is not the only use of social media. Moving forward, it is also important to use social media for dissemination of information. This means using social media to disseminate but also to use information gained to guide and constantly update our overall dissemination plan, including both through social media and through traditional modes. In addition, as the public expects disaster agencies to be monitoring this mode, it is vital to have mechanisms for response and engagement of not only the public as a whole but also individuals.
Information gained in the DigiDOC is not assessed as single elements or separately from its source or volume but rather is assessed holistically to see all public social conversation about any given emergency. We look at what questions people have and what issues they are facing, and that information informs what content we push out through our national communications channels, including Facebook, Twitter, redcross.org, e-mails, public spokespersons, and press releases.
We also disseminate information at an individual level through what we call an “engagement console.” The engagement console is a software application that helps us monitor, engage, and internally collaborate about all social conversations during a disaster. The engagement console pulls in public Facebook posts, blogs, news sites, discussion boards, video and image sharing sites, and Twitter and allows the user to respond by using these mechanisms. It also serves as a workflow manager and is the tool that allows us to scale up to using many digital volunteers.
Our digital volunteers, staff, and subject matter experts can engage with individuals via engagement consoles located in the DigiDOC and even on their own computers outside of the Digital Operations Center. These individuals provide digital assistance during disasters, including information, resources, hope, and comfort. For example, whenever a digital volunteer responds via the engagement console to someone asking where the nearest shelter is, the other digital volunteers and the social engagement team will know this activity has happened. This way we don't duplicate efforts and we can keep track of how many people we provide services to and how well we're able to help.
The full impact of this engagement console model and comparison to traditional models of individuals finding our contact information and then calling a chapter, contacting the national office, or being referred to the Red Cross from local emergency management or nongovernmental agencies is currently being studied. Preliminary internal and limited data have shown a greater number of individual requests for assistance and a shorter turnaround time from questions to initial answer. The full analysis of these data will be published once sufficient analytic data are collected.
Linkages with Emergency Operations and Emergency Management/Organizational Leadership
A key aspect of this model is a tight and two-way linkage with our emergency management and organization leadership. This is done through a variety of structures:
-
∙ Decision makers for major disasters work within eyesight of the Digital Operations Center. They can come by at any time to get situational awareness at a glance. For this, the data are in the form of the visualizations on the 6 screens in the Digital Operations Center. We can adjust the data we're pulling in at any time. We're always tweaking and adapting to be relevant to what is happening on a given day.
-
∙ During disaster relief operations, the social engagement team provides dashboard reports and outlines top trends. The social engagement team will report to decision makers at national headquarters as well as to the local field operations multiple times per day when there is a major disaster. For this, the data are in the form of a summary report that includes our engagement activities as well as any trends. The social engagement team reports situations arising from their social monitoring that may affect the disaster operation and makes recommendations for changes to any Red Cross disaster relief activities.
-
∙ The social engagement team participates as part of the disaster team and works alongside everyone to enhance our overall awareness of how the public is responding to the disaster.
-
∙ Decision makers and subject matter experts can also directly engage with individuals by using their own engagement console. We are able to create tailored engagement consoles so that subject matter experts are informed by people talking about their area of expertise right from their own computers. Decision makers can also use either standard or customized engagement consoles to talk with individuals during events to gain specific insight, pose and respond to questions, etc.
-
∙ We also share these data with our partners locally and nationally including both governmental and nongovernmental entities. For this, the data will be in the form of summary reports very similar or identical to those we use internally. We will work with each operation to determine what data is actionable.
Staffing
The DigiDOC is staffed continuously and is scaled up for evens with additional staff, volunteers, and subject matter experts. As one would expect, this resource requires specially trained individuals and has not only created new staff roles but also new volunteer roles. Also, in keeping with the digital age, staff and volunteers do not need to be physically located in the DigiDOC but can support its operation from their own computers and if appropriately trained even use our software from their own location. This approach offers many benefits including but not limited to: easy scalability; recruitment and use of volunteers who would be unwilling or unable to respond to disasters or to a specific geographic location, including those with access and functional limitations; and reduction in cost owing to usage of volunteers’ equipment and limited travel.
In this model there are two levels of staff and digital volunteers: social engagement advocates and social engagement specialists. Social engagement advocates are trained with our Social Basics Course. These are volunteers or employees who use their personal accounts to engage on behalf of the Red Cross. Social engagement specialists are trained with our Social Basics Course and our Digital Disaster Volunteer Course. These are volunteers or employees who are responsible for social engagement or content for a field unit and are specifically trained to use our engagement console.
Not only does the ability to access engagement consoles outside the DigiDOC provide a decentralized and redundant communication mechanism, it allows individuals to volunteer in disasters even if they are unable to respond to the geographic area of the event. Lastly, this digital volunteer position allows those who wish to volunteer to help in times of disaster but who may have access or functional limitations precluding scene response to still have an opportunity to help.
Conclusion
It is clear in the current Digital Age that people receive information in a variety of ways during an emergency, and it is important for emergency responders to communicate to a wide audience through multiple channels, such as radio, television, and the Web. Because people are willing to take action on the information they see on the social web, it can be a vital and lifesaving channel for those who use it frequently. Lastly, the public’s perception is that those involved in emergency management, including governmental and nongovernmental agencies, will provide information via these modes but also monitor them to receive information and requests for help from the public.