1. Introduction
Understanding participation in armed movements is crucial for determining appropriate responses to conflict. Current literature focuses both on conflict's structural conditions, such as “horizontal inequality,” as well as individual-level characteristics that predict participation in conflict such as education, wealth, and employment. However, there is sparse exploration of the way that these structural conditions and micro-level characteristics interact to affect participation. We develop a theory explaining how group-based repression (a structural condition) might make self-perceived “productive potential” (a micro-level factor) salient in motivating participation in revolt. We provide a micro-foundational theory and new evidence from the case of Burundi to understand why horizontal inequality—that is, severe group-level differences in access to opportunities—leads to armed conflict.
Conventional economic theory suggests that those who face the poorest economic prospects should be most inclined to participate in revolt (Grossman, Reference Grossman1991). However, the evidence on such relationships is decidedly mixed, suggesting that pathways to participation vary tremendously depending on context. As a result, the question of whether and how economic conditions affect participation in revolt remains open (Blattman and Miguel, Reference Blattman and Miguel2010; Berman et al., Reference Berman, Callen, Felter and Shapiro2011).
In an attempt to tackle this puzzle, we consider how country-level structural conditions shape the motivations to revolt among individuals who differ in their economic conditions. We theorize that conditions of severe group repression may interact with individual-level characteristics to alter the economic logic of insurgent participation. Many societies exhibit “horizontal inequality” (Stewart, Reference Stewart2008), and such inequality often originates from and is maintained through repression. This induces sentiments of relative deprivation among members of repressed groups (Gurr, Reference Gurr1970). We posit that among members of these repressed groups, it is those with relatively high productive potential that chafe hardest under the “glass ceiling” preventing them from realizing their potential. Our evidence shows that these individuals have the strongest motivation for revolt against the custodians of the status quo.
These “glass-ceiling” motivations may help us in making sense of patterns anomalous to conventional economic accounts, including militant participation among relatively well-off individuals, as has been documented in Egypt, Lebanon, and Palestine (Gambetta and Hertog, Reference Gambetta and Hertog2007; Krueger, Reference Krueger2007). The “glass-ceiling” logic also provides micro-foundations for the cross-national correlation between horizontal inequality and civil war onset (Østby et al., Reference Østby, Nordas and Rød2009; Cederman et al., Reference Cederman, Gleditsch and Bugaug2013).
Our goal is to push harder on the logic of a “glass-ceiling” revolt to see how well it explains fine-grained patterns in a particular case: the 1993–2003 armed insurgency in Burundi. The Burundi case is interesting for three reasons. First, Burundi's history provides insights into the dynamics of “ranked” ethnic systems, which have historically defined horizontal inequality and some of the hardest conflict resolution challenges (Horowitz, Reference Horowitz1985). Second, Burundi is important for understanding conflict dynamics in a region that is of special significance to conflict research given the scale and duration of its armed conflicts. Finally, the case offers a historic macro-level shock to group repression, allowing for a cohort-based empirical test for the role of a hard-to-test macro-level variable, repression.
We use survey data on Hutu male participants and non-participants in the insurgency. Our basic test examines how productive potential, as proxied by individuals' own as well as their fathers' levels of education, affects participation. Further tests validate the use of these proxies for productive potential and demonstrate exposure to repression among Hutu males. Through these tests, we find that the glass-ceiling logic has predictive validity. Participation likelihood is increasing in individuals' own as well as fathers' education levels. The result is robust to controlling for age, provincial fixed effects, and differential survival. Further results show that Hutu men were subject to repression before the war, but that such repression was lifted through the insurgency.
We also leverage a historical shock to levels of repression in 1972, developing a cohort-based test. In the aftermath of a local Hutu insurrection in 1972, repression of Hutu men was increased dramatically nationwide. Cohorts who completed their education prior to this shock would have had their self-perceived productive potential reinforced by their own educational attainment. These individuals would have chafed especially hard under the increased repression—the door to mobility was slammed in their faces. We find that the relationship between participation and productive potential is strongest among members of these older cohorts.
Father's and own education could be associated with a variety of factors that increase the likelihood of insurgent participation; therefore, these variables are imperfect proxies for productive potential. Thus, we study five alternative mechanisms that might link education to participation. We do not find support for any of these alternative explanations. Our theory and these tests of its core predictions contribute to the growing literature dedicated to understanding the varied individual-level motivations for participation in political violence.
2. Repression, perceived productive potential, and revolt
At the macro level, current empirical literature is mixed in relating inequality to revolt. While there may be a weak correlation between conflict onset and inequality (Fearon and Laitin, Reference Fearon and Laitin2003; Collier and Hoeffler, Reference Collier and Hoeffler2004), given severe data limitations, these studies by no means provide the last word (Blattman and Miguel, Reference Blattman and Miguel2010). In fact, there is a strong macro-level correlation between civil war onset and specific forms of inequality, namely horizontal inequality (Stewart, Reference Stewart2008; Østby et al., Reference Østby, Nordas and Rød2009).
At the micro level, recent studies have found numerous personal characteristics—including economic welfare, personality, social status, and networks—to be associated with conflict participation (Petersen, Reference Petersen2002; Kalyvas and Kocher, Reference Kalyvas and Kocher2007; Arjona and Kalyvas, Reference Arjona, Kalyvas and Guichaoua2011). With respect to economic conditions, some find that participation rates decrease in indicators of economic prospects (Humphreys and Weinstein, Reference Humphreys and Weinstein2008), while other cases show the opposite (Gambetta and Hertog, Reference Gambetta and Hertog2007; Krueger, Reference Krueger2007; Berman et al., Reference Berman, Callen, Felter and Shapiro2011). Others still demonstrate that broad trends mask important fine-grained variation (Lee, Reference Lee2011). Such varied results suggest an incoherent variety of individual-level reasons for taking up arms.
As Balcells and Justino (Reference Balcells and Justino2014) propose, a fruitful step may be to consider the interplay between macro-structural conditions and individual-level attributes. We consider how repression and horizontal inequality interact with individual-level economic conditions to shape rebellious motivations. Specifically, we develop a logic of “glass-ceiling revolt,” which critically builds on relative deprivation and horizontal inequality literatures, but makes an important departure. The Appendix (available online) contains a formal presentation of this theory based on a “tipping point” model of insurgency (Wood, Reference Wood2003; Medina, Reference Medina2007). Here we describe key features.
Existing studies show how inequality across groups can lead to violence (Stewart, Reference Stewart2008; Cederman et al., Reference Cederman, Gleditsch and Bugaug2013). Complementary to this, Gurr (Reference Gurr1970) and others claim that feelings of deprivation relative to other groups can inspire individual-level participation in movements for social change. Our theory draws on these same psychological mechanisms, but in our account, the “referent” is one's own unrealized potential (Gurr, Reference Gurr2000). Feelings of relative deprivation may be based on a comparison between one's actual experience and the counterfactual of potential opportunities under no repression (Olson and Roese, Reference Olson, Roese, Walker and Smith2002). Our primary hypothesis at the individual level is that the greater the gap between one's realized potential and one's perceived productive potential, the higher the likelihood of participation in revolt.
Repression is the macro-level scope condition for our primary hypothesis. Group-based repression operates as a “glass ceiling” that keeps members of the repressed group from realizing their productive potential while still allowing them to witness the opportunities enjoyed by the non-repressed. Repression blocks mobility, and therefore creates the gap between repressed group members' realized and productive potential. Circumstances of group-based repression are common historically, particularly in “ranked” ethnic systems (Horowitz, Reference Horowitz1985) like Sunni-minority dominated Iraq, Lebanon with Sunni-Christian hegemony, and racial repression under Jim Crow in the US South.
This theory of “glass-ceiling revolt” provides micro-foundations for the positive correlation between horizontal inequality and violence. The theory also provides important nuance to relative deprivation theories by focusing on how variation in individual-level productive potential interacts with repression to produce feelings of relative deprivation. We know that barriers to mobility become targets of political change for members of repressed groups (DeNardo, Reference DeNardo1985; Medina, Reference Medina2007); our theory adds that under such conditions, those who chafe hardest under the “glass ceiling” of repression will have the strongest motivation to revolt.
This implies that, among members of a repressed group, those with higher perceived productive potential are more likely to reside at a margin where economic or political shocks could tip them into preferring to fight over acquiescing to the status quo. Those with lower self-perceived productive potential will be “infra-marginal” because they stand to gain relatively little from the removal of barriers to mobility. The assumption is that the constraints from repression bind among those who seek to reach heights in society, and that their resourcefulness or skills do not allow them to easily evade such repression. If such individuals with high productive potential are not able to access sufficient resources under the status quo, then these individuals may have ample motivation to join the revolt themselves. It is in such cases of severe repression that the logic of “glass-ceiling revolt” is most relevant, leading to the following hypothesis:
Ha: Among members of harshly repressed groups, participation in revolt will be increasing in self-perceived productive potential, all else equal.
H a identifies the subpopulation of the repressed group that is most likely to revolt, something that classical theories often fail to specify (Rule, Reference Rule1988, p. 208).
The “all else equal” in hypothesis H a refers primarily to three factors. (The formal analysis in the supporting information models these factors explicitly.) First, participation in insurgency may come at the cost of pursuing peaceful options. Many economic accounts of insurgency presume that such opportunity costs will be determinative (e.g., Collier and Hoeffler, Reference Collier and Hoeffler2004). However, under severe repression, opportunities among the repressed may vary only slightly from person to person, while productive potential varies significantly. Second, any account of participation in insurgency needs to address the problem of free-riding. Despite the hardships that one takes on as a fighter, it is typically reasonable to assume that members of a successful insurgency will enjoy certain privileges that non-participants do not. Such outcome-dependent rewards can be the basis of successful insurgent collective action (Medina, Reference Medina2007). Third, participation is only rational under beliefs that the insurgency has some chance of success. Conditional on such beliefs, those with higher productive potential would have the strongest motivation to fight in a movement against the custodians of a repressive status quo.
3. Insurgency in Burundi
The nature of repression and horizontal inequality in Burundi is such that it provides for a compelling test of our hypothesis. In Online Appendix Section B we provide a more detailed discussion of the historical background for the case. Crucially, that the case allows us to study how macro-level variation in the level of repression interacts with individual economic conditions. We have two sources of variation in macro-level conditions: variation across ethnic groups and variation over time. With respect to ethnic groups, the insurgency in Burundi was largely catalyzed by resentment among Hutus originating from their political and economic repression at the hands of a ruling Tutsi elite (Lemarchand, Reference Lemarchand1994). Over time, the level of this repression varied, with an especially dramatic ratcheting up occurring as the result of a crackdown by the Tutsi-dominated regime following a 1972 Hutu insurrection. As such, we have variation in both the macro-level factors (repression) and micro-level factors (productive potential) that are relevant to our theory. The case also fits the premises of our theory because of the apparently voluntary nature of participation in the insurgency, in contrast to other cases where forced recruitment has been more important (Humphreys and Weinstein, Reference Humphreys and Weinstein2008; Blattman, Reference Blattman2009). As discussed in the appendix, our survey data suggest that only a minority of insurgent participants (28 percent) indicated that they feared harm by the rebels if they did not participate, and a very small fraction (7 percent) indicated that they had been harmed prior to joining. When asked how they were convinced to join, 56 percent indicated that they convinced themselves and 25 percent indicated that their friends convinced them. These results suggest that insurgent recruitment was more a product of individual volition and peer pressure than abduction by the rebel organization.
4. Data
We use survey data collected in Burundi in 2007 (Samii et al., Reference Samii, Mvukiyehe and Taylor2009; Samii, Reference Samii2013) in order to test our theory. The data were collected as close to the end of the war as possible, thereby minimizing the gap between rebel participation decisions and data collection. The national survey included 446 ex-rebel Hutu combatants as well as 1,169 non-combatants. We use the data on the background and participation information of these individuals in order to test our hypothesis. Information about sampling and survey techniques can be found in the Appendix.
We restrict the sample of both civilian and ex-combatant respondents to Hutu males aged 13–42 in 1993, since it is these individuals for whom the hypothesis is relevant. Tutsi participation in the rebel groups was exceedingly rare, as was the participation of children younger than 13. We also restrict the sample to individuals 42 or younger because this is the maximum age in our sample of combatants; matching this age range in our sample of civilians controls for age differences. Finally, we focus only on men because our sample of rebel combatants, which was sampled in a manner that was independent of gender, includes a small fraction (5 percent) of women. Given Burundian gender norms, factors associated with women's participation were likely quite distinct, but the small number of women in our sample precludes analysis. Summary statistics are displayed in Table 1. We show summary statistics for the two proxy variables used for self-perceived productive potential: one's own education and father's education. Table 1 shows that ex-rebels had higher educational attainment levels and more educated fathers compared to both Hutu and Tutsi non-rebels.
Summary statistics

We use own education and father's education as proxies for an individual's assessment of his productive potential. While direct, own education is potentially biased for the current analysis for three reasons. First, the oppressive regime prior to 1993 may have led many Hutus to forgo education given that opportunities for employment were highly limited, making the measure endogenous. Second, Hutus that join the rebellion at school age would not be able to pursue more years of education. Third, after 1972, Hutu students were explicitly discriminated-against for scholarships and entry into higher level schools (Jackson, Reference Jackson2000). Thus, own education may not accurately measure productive potential given that repression likely stifled realization of this proclivity for educational attainment post-1972.
To avoid these sources of bias, we use father's education as a second proxy for productive potential. Father's education is plausibly related to an individual's self-perceived productive potential: individuals likely use their father's success as a baseline for their own potential. But, importantly for our analysis, the level of father's education for Hutu men would have been set prior to 1972, so there is little scope for either anticipation or the consequences of post-1972 discrimination to impact this measure.
5. Specifications and tests
As a first test, we use the following specification on our sample of Hutu combatant and civilian men:

where “Education” is measured either in terms of years of the subject's own education or the subject's father's education. The outcome is a binary variable taking the value 1 for participants and 0 for non-participants. X i is a vector of controls: age in 1972, pre-war province fixed effects, and survival probability. Age is an obvious confounder; average educational attainment increases in age and there are probable differences in participation likelihood due to age. Province fixed effects control for levels of urbanness and other contextual variability. We also control for survival probability. A section in the Appendix provides details on survival and attrition patterns between 1993 and the time of data collection. Our survey collects data on survival patterns by recording information on household members who died during the war, including both civilians and combatants. Based on these data as well as other administrative data, we estimate that the survival rate for civilians in our target population was between 85 to 87 percent, while for those in the rebellion, it was between 62 and 69 percent. Among rebels, those with educated fathers were also somewhat less likely to die. Without accounting for such patterns, we risk obtaining spurious results for the parameters of interest. Thus, we estimate a penalized logistic regression of survival on father's education, province fixed effects, and other key variables, and then control for a linearized (log-odds) transformation of the predicted survival probability. To avoid post-treatment bias, our main specifications avoid including individual attributes that are likely themselves to be affected by educational attainment (Rosenbaum, Reference Rosenbaum1984). Nonetheless, we account for many alternative consequences of education when examining alternative explanations below. We assume the error is clustered at the commune level. We fit the model using weighted least squares regression (applying the survey weights) and cluster-robust standard errors. Our hypothesis implies that β 1 > 0.
The Appendix replicates our results using logistic regression, and results are nearly identical. In addition to this baseline, we conduct further tests to shore up the plausibility of our interpretation. The first is an analysis that we use to validate our theoretical assumption that repression is binding. We add data from Tutsi men of the same age range as our sample's Hutu men. On average, Tutsi men faced much less repression when it came to pursuing their productive potential. To show this, we fit a weighted least squares regression to the following equation:

For the outcome Y i, we use educational attainment and a ranking of occupations (assigning − 1 for no occupation, 0 for unskilled, and 1 for skilled). This equation allows us to study the extent of discrimination that Hutu men faced relative to their Tutsi counterparts. Under no discrimination, the expectation is that father's education would be positively associated with educational and occupational attainment. Discrimination against Hutus relative to Tutsis would appear in the form of an attenuation of the relationship between father's education and one's own attainment among Hutus. Thus, we expect γ1 > 0 as the “natural” relationship between inter-generational levels of attainment, γ2 < 0 as the level difference in attainment by Hutus, and most importantly γ3 < 0 as the effect of discrimination preventing those Hutus with high-attaining fathers from realizing their productive potential. The same control variables are used as for Equation (1).
A third stage of analysis bolsters our main findings using different outcome variables and subsamples. We study the extent to which one's own education and father's education predict the occupational attainment of Hutu men before and after the war. The expectation is that the relationship will be stronger after the war, since the war's outcome lifted some constraints to Hutu mobility. Such a pattern would validate our assumption that these educational attainment variables proxy for self-perceived productive potential, and that these constraints motivated the revolt. We also study the extent to which these educational variables predict incoming and outgoing ranks within the rebellion. We expect upward mobility within the ranks to be possible among those Hutu participants with high productive potential because, unlike the repressive Tutsi regime, the rebel organization allowed for advancement. Such a pattern would shore up our assumption that the educational attainment variables are reasonable proxies for productive potential.
We then use the discontinuous increase in levels of repression in 1972 to construct a cohort-based test. By providing variation in levels of repression, this allows us to test the impact of the macro-level variable in our theory of glass-ceiling revolt. Resulting from a local insurrection in a central province, there was a ramping-up of repression in 1972. This shock to levels of repression helps to increase the credibility of our interpretation in terms of a “glass-ceiling revolt.” To understand the logic of this cohort-based test consider the following two points. First, the clampdown on Hutu access to education and opportunities following 1972 generates two cohorts: the older had the opportunity to pursue education for a time with relatively few constraints, and the younger faced severe constraints earlier in their lives. Thus, the older cohort would have their self-perceived productive potential reinforced through their accomplishments prior to 1972, only to have the door to further pursuit of opportunities slammed. Younger cohorts did not have such opportunities to reinforce their self-perceived productive potential, nor did they experience such a sharp shock to their ability to pursue post-education opportunities. And, again, we are able to distinguish individuals on the basis of their father's education levels, which would have been set prior to 1972.
Based on this logic, a few patterns should emerge. First, to validate that there were meaningful differences in access to education before and after 1972, we expect to see a stronger relationship between educational attainment and father's education for the older cohort. These older cohorts were not affected by the clampdown until later in life and thus had time to attain education in a manner that is consistent with the example of their fathers. Second, because the intensification in repression would have come as a harsher shock in terms of employment opportunities to the older cohort, we should find that the relationship between father's education and participation is especially strong for this older cohort as compared to the younger.
We use the following regression specification to test these predictions:

where “Older cohort” is an indicator variable, X i are the same controls as above, and ηi is an error term assumed to be clustered at the commune level. For the first test, Y i is years of education attained by the subject, which tests the prediction that the older cohorts had access to more educational opportunities since they were educated pre-1972. For the second test, Y i is participation in the armed revolt, which tests our prediction that this older cohort would have subsequently had more motivation to revolt. In both cases, our hypothesis is that α3 > 0. To distinguish between older and younger cohorts, we consider indicators that distinguish between cohorts above and below 12 and 16 years of age in 1972. These correspond, respectively, to ages of completion of primary school and either completion of junior secondary school or, more likely, entry into the work force (UNESCO 2015).
6. Basic results
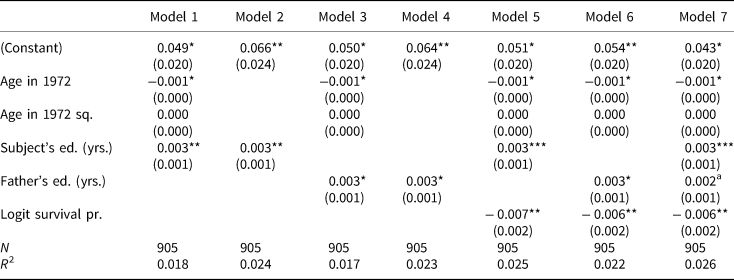
The results of the basic test, formalized by Equation (1), are shown in Table 2. We see in Models 1 and 2 that subject's own education is positively related to participation likelihood. The estimates are the same controlling for age via a continuous specification (Model 1) or using age-specific fixed effects (Model 2). Models 3 and 4 show that father's education is also positively correlated with participation. From a base participation probability of about 0.015 (not shown), participation probability increases by about 0.003 (about 20 percent over the base rate) for each year increase in either own or father's education.
Participation in revolt as a function of own and father's education

aSignificant at p < 0.10; *p < 0.05; **p < 0.01; ***p < 0.001. Weighted least square estimates. Standard errors account for clustering at the commune level (number of clusters is 65). Dependent variable is participation in armed revolt (0,1). Primary independent variables of interest are subject's education and father's education. All models control for pre-war home province fixed effects. All models control for age, with models 2 and 4 using age-specific fixed effects. The logit of survival probability controls for predicted survival probability, to account for attrition bias.
We described three effects that influence the relationship between own and father's education as measures of productive potential: anticipation effects; the mechanical effect from people leaving school to join the rebellion; and the fact that repression changes the mapping from productive potential to each of these measures. We find that the coefficients are almost identical for both measures, suggesting that these effects offset each other. It is also important to note that father's education is still significantly correlated with participation in Model 7 which includes own education. This suggests that, even in the face of individual-level variation in access to opportunities to realize one's own productive potential, perceptions of what one could have accomplished remain predictive of participation. Models 5 and 6 account for survival probability; the results remain similar. The Appendix shows robustness to accounting for the effects of out-migration, by limiting the analysis to subjects who resided in interior provinces as opposed to border provinces.Footnote 1
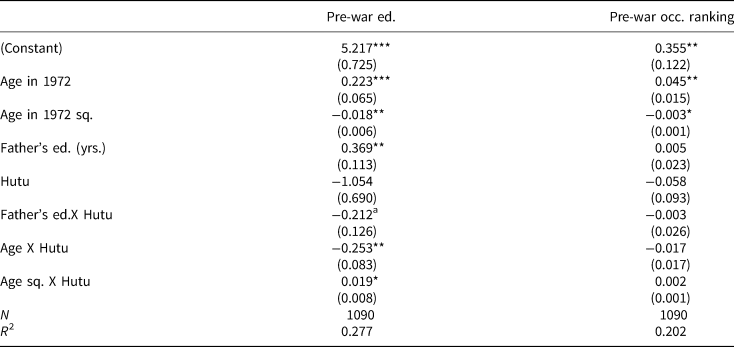
We now turn to analysis that tests motivating assumptions of our empirical strategy. Table 3 shows results for a test of our theory's primary empirical assumption. These results show that Hutu men experienced severe repression that did not allow them to realize their perceived productive potential. We measure this effect of repression using data from both Hutu and Tutsi men, as formalized by Equation (2). The regression controls for age, as well as province fixed effects and survival probability (coefficients omitted for space).
Subject's education and occupational ranking as a function of father's education (all-ethnicity sample)

aSignificant at p < 0.10; *p < 0.05; **p < 0.01; ***p < 0.001. Weighted least square estimates. Standard errors account for clustering at the commune level (number of clusters is 66). Dependent variable in Model 1 is respondent's own years of education before the war (0–18). Dependent variable. in Model 2 is respondent's own occupational ranking before the war (−1, 0, 1). Sample includes both Hutu and Tutsi male respondents. All models control for pre-war province fixed effects and survival probability.
Education and occupational attainment should be increasing in father's education for Tutsi men, but this relationship should be attenuated for Hutu men. Our results indicate this. The results for Tutsi men show that education increases in age, but in a manner that levels off at a certain point (hence the positive coefficient on age, and negative on age-squared). Those with more educated fathers tended to pursue more education themselves. These patterns are substantially attenuated for Hutu men. The partial effect of age is nearly zeroed out. Furthermore, the partial relationship between father's and own educational attainment for Hutus is about half that among Tutsis. For occupational attainment, the regression coefficients are not statistically significant, although the signs point in the expected direction. These results suggest that, while father's education is a strong predictor of one's own education under no constraints, it has far less predictive power for education levels attained by Hutus who suffered barriers of repression.
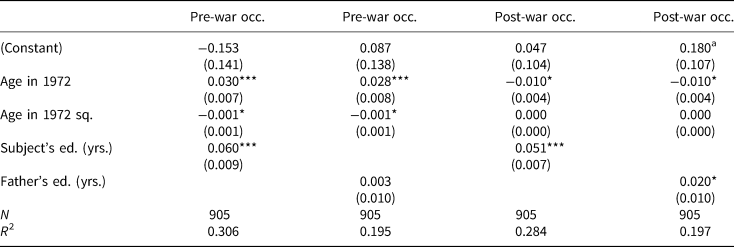
Tables 4 and 5 show results for tests of the assumptions that educational attainment is associated with productive potential and that constraints were present before the war. We expect that these measures of productive potential should provide little traction in explaining occupational attainment prior to the war; but after the war, when many constraints to mobility were lifted, the positive relationship between education and occupation should strengthen. Table 4 provides partially consistent evidence. The pattern holds for father's education as a measure of productive potential (columns 2 and 4), as we see an order of magnitude difference in the strength of the association going from pre-war to post-war occupational attainment. The relationship does not hold as strongly with respect to subject's own educational attainment. A possible interpretation is that anticipation effects mask the expected relationship. If in the pre-war period Hutu men could accurately anticipate whether educational attainment would pay off, and responded accordingly, then a consistent relationship between occupational and educational attainment may hold over time.Footnote 2
Occupational ranking as a function of own and father's education

aSignificant at p < 0.10; *p < 0.05; **p < 0.01; ***p < 0.001. Weighted least square estimates. Standard errors account for clustering at the commune level (number of clusters is 65). Dependent variable is occupational rank (−1, 0, 1). All models control for pre-war province fixed effects and survival probability.
Military ranks as a function of own and father's education (rebels only)

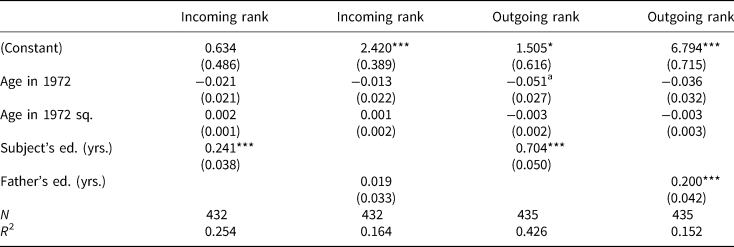
aSignificant at p < 0.10; *p < 0.05; **p < 0.01; ***p < 0.001. Weighted least square estimates. Standard errors account for clustering at the commune level (number of clusters is 65). Dependent variable is military rank (1 simple soldier—15 general). All models control for pre-war province fixed effects and survival probability.
Table 5 shows the results for the test on the military ranks (1–15, from simple soldier to general) obtained by those who participated in the rebellion. Patterns are consistent with our expectations. The association between education and outgoing ranks is strong for both one's own educational attainment and that of one's father. The association with incoming rank is weaker. These results help to validate our use of educational attainment as a proxy for productive potential: within the insurgent organization, individuals' productive potential was not repressed as it was by the Tutsi regime. As such, those with higher education were able to achieve upward mobility within the ranks. These results also demonstrate that educated Hutus may have had a higher expected value from participation in the insurgency. The revolt itself represents a new institution that allows Hutu men to express their productive potential.
The findings in Tables 3 to 5 show that, prior to the war, opportunities for Hutu men were relatively flat across father's education. Father's education nonetheless predicts participation. Moreover, the relationship between attainment and father's education changed dramatically after the war, once barriers to mobility were lifted. These results suggest that it was perceived productive potential rather than pre-war status per se determining likelihood of participation.
7. Cohort-based test
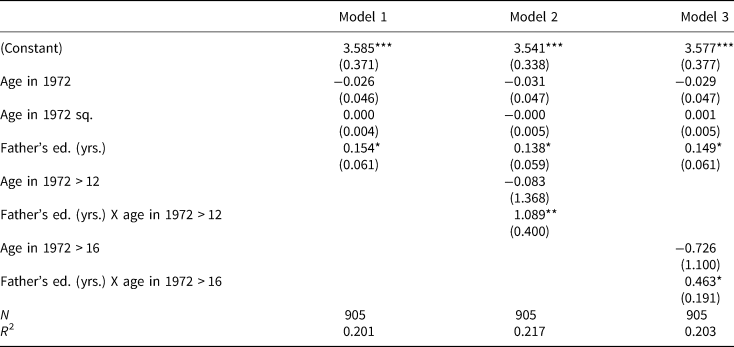
We now turn to our analysis of the discontinuous increase in repression after 1972. Table 6 serves to validate the assumptions that motivate this analysis. Using the specification set forth in equation (3), we examine cohort-specific differences in the relationship between father's educational attainment and one's own educational attainment. The results show that for the older cohort, father's education is a stronger predictor of one's own educational attainment. This holds whether the older cohort is defined by the cut point at age 12 or 16 in 1972, providing evidence for dramatic differences after 1972 in opportunities that young Hutu men faced in following the footsteps of their fathers.
Education as a function of father's education, by age categories in 1972

aSignificant at p < 0.10; *p < 0.05; **p < 0.01; ***p < 0.001. Weighted least square estimates. Standard errors account for clustering at the commune level (number of clusters is 65). Dependent variable is respondent's years of education before the war (0–18). All models control for pre-war province fixed effects and survival probability.
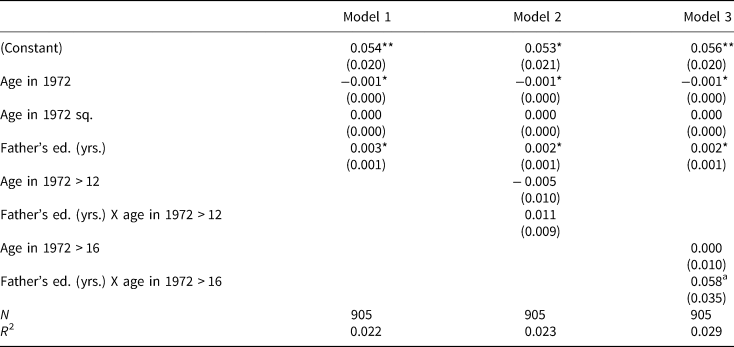
Table 7 shows results for the test on participation. When we define the older cohort at the cut point of age 16 (when school typically ends) in 1972, we find that there is a substantively large partial relationship between father's education and participation (each additional year of father's education increases participation likelihood by about six percentage points). For younger cohort members, the estimated relationship is weaker.Footnote 3 This is consistent with the story of how a ramping up of repression had a strong effect on Hutus who were able to finish education pre-1972 but then unable to pursue opportunities post-1972.
Participation in revolt as a function of father's education, by age categories in 1972

aSignificant at p < 0.10; *p < 0.05; **p < 0.01; ***p < 0.001. Weighted least square estimates. Standard errors account for clustering at the commune level (number of clusters is 65). Dependent variable is participation in armed revolt (0,1). All models control for pre-war province fixed effects and survival probability.
Figure 1 allows us to visualize the basic patterns in the raw data. Over all age levels, the participation rate for individuals with fathers that had some formal education (solid line) was higher than for those without any formal education (dashed line). However, there is a precipitous widening of the gap at around age 16, the age of those who would have suffered the most dramatic shocks to their access to opportunities following the post-1972 crackdown.
Participation probability for Hutu men with educated versus uneducated fathers, by age. The figure shows how the participation rate varies over age in our sample for those whose fathers had no formal education (dashed line) as compared to those whose fathers had at least completed primary school (solid line). The lines are local linear regression smoother fits with 95 percent confidence bands in gray. The rug plots at the top/bottom of the graph show the raw sample data for rebel joiners and non-joiners respectively, with non-educated (“o”) and educated (“—”) fathers. The graph shows a kink around age 16, corresponding to the cohort-based estimates in Table 7.

8. Checking alternative explanations
We explore five potential alternatives to the glass-ceiling logic for explaining the positive relationship between education and participation. The Appendix contains a detailed section with analyses of these alternatives. Here we summarize the findings.
There may have been revenge motivations based on the fact that the 1972 crackdown targeted Hutu elites. If the fathers of more educated individuals had been more likely to be killed, then these individuals may have been motivated to avenge their fathers' deaths rather than frustrations precipitated by pushing against a “glass ceiling.” We do not have explicit information in our survey data on who was targeted in 1972. But we have information on whether respondents' fathers were alive in 1993. Thus, as an indirect test we fit both Equation (1) and cohort-specific Equation (3) using the indicator for whether the respondent's father was alive in 1993 as the outcome. Confounding would appear as significant negative coefficients on β 1 and α 3. Another test comes from questions on the survey that asked rebel recruits their reasons for joining the insurgency. We use the sample of rebel recruits to fit both the basic Equation (1) and cohort-specific Equation (3); the outcome is whether the respondent gave “revenge” as one of their stated reasons for joining the rebellion. If this alternative hypothesis were valid, father's education would be positively correlated with this revenge response, especially among older cohorts.
As reported in the Appendix, these tests find no support for revenge motivations driving participation. We find no evidence that father's survival to 1993 was decreasing in father's education levels. Neither are there negative cohort effects. The education variables do not predict that rebel recruits indicated having participated for revenge purposes. Moreover, recall that in Table 2 we found that one's own educational attainment was positively associated with participation even after controlling for father's education. To the extent that vengeance motives were the primary driver, we would expect father's education to be the primary driver of the effect, and the apparent effect of one's own education would be spurious. This does not appear to be the case.
The second alternative explanation is the possibility that rebel movements selectively recruited more educated people (Bueno De Mesquita, Reference Bueno De Mesquita2005). To assess this possibility, we use data from our sample of Hutu men who did not participate in the insurgency. The survey asked these men whether they had considered joining. To test the selective recruitment explanation, we run our basic Equation (1) on this civilian sample, using their responses to this question as the outcome. If recruitment was selective, we would expect the coefficients on education and father's education to be negative, indicating that undereducated Hutu civilians considered joining but never ended up participating, possibly due to selective recruitment. The results (see Appendix) show that one's own education is positively correlated with having considered joining the rebellion (significant at the 10 percent level), which indicates that there were a significant number of well-educated civilians who considered joining the movement but never ended up participating. This contradicts the alternative explanation that rebel leaders selectively recruited educated individuals.
The third alternative explanation proposes that we consider household-level opportunity costs, rather than opportunity costs pertaining only to individuals. The argument is one of omitted variable bias: the relationship between education and participation in rebellion may be spurious as an indication of the effects of “productive potential.” Rather, households with more educated fathers and more educated sons may be wealthier and therefore more able to “afford” a son to join the rebellion. We examined two measures of household opportunity costs that fit this alternative: (1) an index of pre-war household wealth and (2) the number of brothers that the would-be recruit had. Each of these should affect the extent to which a household could “afford” one of its sons joining the rebellion. The index of pre-war wealth is the sum of “yes” responses to questions asking about whether the respondent's household owned land, cows, a radio, and beds with bed sheets.Footnote 4 If the findings with respect to education are indeed spurious, then controlling for these factors should nullify the relationship between educational attainment and rebellion. We show that the relationship between educational attainment and participation remains strong after controlling for number of brothers and pre-war wealth.
The fourth alternative explanation is that education yields resources—such as skills or networks—that facilitate collective action in ways that are distinct from economic opportunities, and thus our focus on economic opportunities may be misguided. We assess this possibility by examining a few additional variables. The first is whether the family possessed a radio prior to war, which would facilitate access to collective-action relevant political information. The second is whether respondents reported that someone from a rebel faction had ever told them about the possibility of joining the group, which would be indicative of access to the insurgent recruitment network. The third is whether the respondent tended to spend most time with friends or family prior to the war, which is intended to measure whether the respondent was active in peer networks that were more likely to be the social settings for political engagement and insurgent participation. We show in the Appendix that our education variables do indeed positively predict these indicators of collective action resources, but controlling for them does not weaken the association between the education and participation in our results, suggesting that they do not substantially mediate this relationship.
The fifth alternative is that education is a gateway to political socialization, which can motivate participation in distinct ways (Krueger, Reference Krueger2007). To assess this, we used a question from the survey asking respondents which political party they supported in 1993. The available responses were to support the incumbent and predominately Tutsi UPRONA party, the challenger and Hutu-dominated FRODEBU party, none of these parties, or some “other” party. Only a small number (26 respondents in total) reported “other,” and when asked for more details, these respondents overwhelmingly reported supporting the more radical Hutu-liberationist PALIPEHUTU party. So, we can take “other” responses as proxies for more radical political positions. We checked whether (i) more educated respondents were either less likely to indicate support for “none” (implying a political socialization effect) or more likely to support “other” (implying a radicalization effect) and (ii) controlling for these political support variables reduces the strength of the relationship between the education variables and participation. Results offer no indication of either a political socialization or radicalization effect, and controlling for these variables does not weaken the association between the education variables and participation.
9. Conclusion
In order to better understand how to prevent future conflict, we must understand motivations for rebellion.Footnote 5 We contribute along these lines by considering the logic of “glass-ceiling” revolt based on macro-theories of horizontal inequality and the more micro-logic of relative deprivation. We hypothesize that in situations of horizontal inequality enforced by group repression, it is those with relatively higher productive potential whose ambitions are most frustrated and therefore have the strongest motivation to revolt. We test this argument using micro-level data from Burundi, and find evidence that is consistent with the logic. We find participation likelihood rises with one's own and father's education. A more fine-grained test that leverages the abrupt increase in repression following 1972 provides further evidence consistent with the predictions of the theory. We test and find no support for various alternative explanations.
As discussed by Blattman and Miguel (Reference Blattman and Miguel2010), research on civil war and political violence has tended to focus on material opportunity costs as determining individuals' relative propensities to join armed groups (e.g., Collier and Hoeffler, Reference Collier and Hoeffler2004). Our theoretical analysis does not dismiss entirely the importance of opportunity costs. Holding productive potential fixed, we agree that lower opportunity costs should be associated with higher likelihood of participation. The logic we develop and the empirical results we show do, however, propose that other forces associated with relative deprivation are also at work, and that these other forces are important.
Our study has implications for debates about the role of “grievances” in civil war participation. Our results indicate the plausibility of the “glass-ceiling” logic as a micro-mechanism to explain the cross-national relationship between horizontal inequality and revolt (Østby et al., Reference Østby, Nordas and Rød2009; Cederman et al., Reference Cederman, Gleditsch and Bugaug2013). The “glass-ceiling” logic is distinct from that of Kuhn and Weidmann (Reference Kuhn and Weidmann2015), for whom the key mechanism is higher-income members of excluded groups recruiting lower-income members to do the fighting. The evidence presented here is not consistent with such an alternative account. Our results are consistent with findings that more educated individuals tend to join Islamic militant movements (Gambetta and Hertog, Reference Gambetta and Hertog2007; Krueger, Reference Krueger2007).
Others may argue that horizontal inequality could, theoretically, lead to civil war because it facilitates mobilization rather than being a source of grievance (Gubler and Selway, Reference Gubler and Selway2012). In addition, some suggest that participation among relatively well-off individuals may be merely a function of such individuals' greater interest in politics (Krueger, Reference Krueger2007; Lee, Reference Lee2011). But such alternative accounts leave unspecified the motivations for participating in insurgency. They cannot explain patterns like participation among the relatively better off within the repressed group or even among those with higher achieving fathers who were not given the opportunity to pursue their interests themselves (Tables 3 to 5).
Others still remain skeptical that such grievances can provide much explanatory leverage given that certain macro-level indicators of potential grievance seem to explain little variation in the onset of civil war after accounting for things like income (Fearon and Laitin, Reference Fearon and Laitin2003; Collier and Hoeffler, Reference Collier and Hoeffler2004). A way to resolve this apparent paradox may be to distinguish between macro and micro levels of analysis. Given the complexity of large-scale insurgent mobilization, it is no wonder that macro-level factors could intervene to obscure the relationship between grievances and the onset of civil war (Gurr, Reference Gurr1970, Ch. 8–10). Nonetheless, in examining why people participate in insurgency, the role of grievances could be much more pronounced. The evidence presented here, as well as in studies such as Petersen (Reference Petersen2002), support this proposition. At the same time, as Weinstein (Reference Weinstein2006) argues convincingly, there are a variety of modes of participation and recruitment depending on structural context. The structural conditions that define the glass-ceiling logic, namely high levels of horizontal inequality enforced through repression, are important scope conditions. Policies seeking to prevent armed revolt could look into why such conditions obtain and how they may be unwound. Further research might uncover other modes of participation that link additional macro-structural factors to micro-level motivations, thus providing a richer understanding of the causes of revolt with clearer implications for policy.
Finally, our findings contribute to the literature on education and conflict. Thyne (Reference Thyne2006) finds that at the country level, higher levels of education are associated with less civil war onset. But micro-level patterns are not so uniform. Campante and Chor (Reference Campante and Chor2014) find that when macro-level economic conditions are poor, high education is associated with more participation in protest. Such findings, when viewed alongside the findings in this paper, reveal how macro-level inequality may pervert the relationship between education and peace.
Supplementary Material
The supplementary material for this article can be found at https://doi.org/10.1017/psrm.2019.28
Acknowledgments
The data come from the Wartime and Post-Conflict Experiences in Burundi study, which was sponsored by the Folke Bernadotte Academy, Sweden, and the United States Institute of Peace, and was approved by the New York University IRB as protocol no. HS-5279. For helpful discussions, we thank Ariel BenYishay, Chris Blattman, Thomas Flores, Omar Garcia Ponce, Michael Gilligan, Guy Grossman, Macartan Humphreys, Patrick Kuhn, Eric Mvukiyehe, Gwendolyn Taylor, Matthew Winters, and participants at the Columbia-NYU Contemporary African Political Economy Research Seminar, Cornell Institute for African Development, Midwest Political Science Association annual meeting, and William & Mary Development Economics Seminar.