INTRODUCTION
Peat deposits are important natural archives for reconstructing past climate and environmental change. This is of particular significance in the mid-to-high latitudes which are experiencing increasing climate variability and long-term warming but where there is a relative paucity of instrumental (observational) records (IPCC AR5 Reference Stocker, Qin, Plattner, Tignor, Allen, Boschung, Nauels, Xia, Bex and Midgley2013; Jones et al. Reference Jones, Gille, Goosse, Abram, Canziani, Charman, Clem, Crosta, de Lavergne and Eisenman2016; Rainsley et al. Reference Rainsley, Turney, Golledge, Wilmshurst, McGlone, Hogg, Li, Thomas, Roberts and Jones2019). Despite the importance of peat for reconstructing palaeo-ecological and -climate change (e.g. McGlone et al. Reference McGlone, Turney, Wilmshurst, Renwick and Pahnke2010), its role as a major global carbon reservoir, including past changes in flux (Turney et al. Reference Turney, Jones, Lister, Jones, Williams, Hogg, Thomas, Compo, Yin and Fogwill2016a; Amesbury et al. Reference Amesbury, Roland, Royles, Hodgson, Convey, Griffiths and Charman2017; Gallego-Sala et al. Reference Gallego-Sala, Charman, Brewer, Page, Prentice, Friedlingstein, Moreton, Amesbury, Beilman and Björck2018), and even defining geological epochs (Turney et al. Reference Turney, Palmer, Maslin, Hogg, Fogwill, Southon, Fenwick, Helle, Wilmshurst and McGlone2018), there are a number of potential issues regarding precise dating of sequences in remote, highly dynamic locations. These include the suitability of available calibration curves (Scott et al. Reference Scott, Cook and Naysmith2010; Reimer et al. Reference Reimer, Bard, Bayliss, Beck, Blackwell, Ramsey, Brown, Buck, Edwards and Friedrich2013b), sedimentary material selection and pretreatment (Nilsson et al. Reference Nilsson, Klarqvist, Bohlin and Possnert2001; Brock et al. Reference Brock, Higham, Ditchfield and Bronk2010; Piotrowska et al. Reference Piotrowska, Blaauw, Mauquoy and Chambers2011), and site context for developing robust chronological frameworks.
A key consideration when selecting material for radiocarbon dating is whether the age assigned to a peat sample truly reflects the time that the associated sediments were deposited. It is well known that some sediments may incorporate carbon that is from the non-contemporaneous environment. Peat sediments can comprise both “older” and “younger” carbon, through the mobility of various size/chemical fractions, deposition of reworked material from upslope, and penetration of older peat by younger rootlets (McGlone et al. 2004). The most important issue, therefore, is to identify the fraction that can provide a reliable radiocarbon determination (and is present in sufficient quantity). Peat and macrofossils from bogs are thought to be least susceptible to older or younger carbon contamination, while lakes and swamps can be subject to redeposition of old carbon from the adjacent catchment, as well as hardwater effects (Olsson Reference Olsson1986). Some environments are more susceptible to the movement and redeposition of organic components. A key concern is the vertical penetration of roots, resulting in inclusion of “younger” carbon in the samples being dated (Kilian et al. Reference Kilian, van Geel and van der Plicht2000; Brock et al. Reference Brock, Lee, Housley and Bronk2011). For example, root penetration can reach up to 2 m in depth and can therefore bias the radiocarbon determination of the peat unit by several thousand years (Martin et al. Reference Martin, Goff, Jacobsen and Mooney2018). When dating bulk peat samples, removal of visible roots can reduce the influence of this “younger” carbon, resulting in older ages. However, it should be noted that identification of these roots after decomposition can be challenging, particularly in sediments of greater antiquity. Another possibility is the downward vertical migration of microfossils by water movement/flow, however, this is generally limited to the relatively unconsolidated upper sediments, limiting the impact on age determinations (Ivanov Reference Ivanov1981; Joosten and De Klerk Reference Joosten and De Klerk2007).
The dating of terrestrial plant macrofossils (e.g. seeds, wood, bark, leaves) has been suggested to improve the accuracy of chronologies as, providing they are in situ and have not been reworked, they are likely to be contemporaneous with the time of deposition and therefore reflect atmospheric 14C (Lowe and Walker Reference Lowe and Walker1997; Turney et al. Reference Turney, Coope, Harkness, Lowe and Walker2000; Blockley et al. Reference Blockley, Lane, Hardiman, Rasmussen, Seierstad, Steffensen, Svensson, Lotter, Turney and Bronk2012). Dating short-lived terrestrial plant remains ensure that the assimilated atmospheric CO2 is likely to be near-contemporaneous with the terrestrial environment. However, misidentification of root material for plant macrofossils can result in significant errors (Martin et al. Reference Martin, Goff, Jacobsen and Mooney2018), so extreme caution must be taken. For highly humified peat, from which it is difficult to select specific macrofossils, or in the absence of visible macrofossils, it is possible to date either the whole peat sample (termed a “bulk” sample), or specific fractions of the peat, which may be separated physically or chemically. For rapidly accumulating peats in ombrotrophic bogs in particular, bulk 14C ages can directly reflect atmospheric radiocarbon (Blaauw et al. Reference Blaauw, van der Plicht and van Geel2004).
A potential source of older carbon being incorporated into a peat sequence, regardless of the material type, is the translocation of older carbon from higher adjacent ground as a result of erosion. A potentially important aspect at some locations is cryoturbation, which can distort the stratigraphic integrity of a sequence through movement/mixing of material of different coarseness in a profile. If the material is allogenic (i.e. transported from elsewhere) it is essential that it has not been reworked/redeposited from older geological strata or soils, as this could bias the 14C age determination towards older values. For example, old soil humics and refractory soil organic material such as lignin can be several thousand years old at the point of redeposition (McGlone and Wilmshurst Reference McGlone and Wilmshurst1999). This is particularly problematic in organically lean sediments (Reimer et al. Reference Reimer, Bard, Bayliss, Beck, Blackwell and Ramsey2013a; Wilson et al. Reference Wilson, Clark, Birnie and Moore2002). In addition, some organic components such as wood or charcoal may have inbuilt ages due to their persistence in a landscape on timescales of centuries or longer, before incorporation into a sediment unit (Oswald et al. Reference Oswald, Anderson, Brown, Brubaker, Feng, Lozhkin, Tinner and Kaltenrieder2005; Kershaw et al. Reference Kershaw, McKenzie, Porch, Roberts, Brown, Heijnis, Orr, Jacobson and Newall2007; Howarth et al. Reference Howarth, Fitzsimons, Jacobsen, Vandergoes and Norris2013).
Different sedimentary environments have been shown to have varying susceptibilities to the incorporation of non-contemporaneous carbon (McGlone and Wilmshurst Reference McGlone and Wilmshurst1999; Chu et al. Reference Chu, Sun, Huang, Huang and Zhou2016). As a result, there have been a number of studies investigating different size and chemical fractions for radiocarbon dating of peat. For instance, some work has found that the incorporation of bulk peat dates appeared to introduce no significant systematic biases into large datasets (Blaauw et al. Reference Blaauw, van der Plicht and van Geel2004; Holmquist et al. Reference Holmquist, Finkelstein, Garneau, Massa, Yu and MacDonald2016). A study from Australia found that 14C dating of short-lived plant macrofossils resulted in consistently younger ages than from both pollen concentrate material and charcoal, with the macrofossils thought to be potentially closer to the age of the deposition of the sediment (Martin et al. Reference Martin, Goff, Jacobsen and Mooney2018). In addition to separate size fractions, different chemical fractions may also provide divergent age determinations (Shore et al. Reference Shore, Bartley and Harkness1995; Turetsky et al. Reference Turetsky, Manning and Wieder2004); vertical transport of humic acids in peat columns is potentially variable due to site-specific conditions, and may be arrested in acidic environments due to lower humic acid solubility (Wüst et al. Reference Wüst, Jacobsen, van der Gaast and Smith2008). While Brock et al. (Reference Brock, Lee, Housley and Bronk2011) demonstrated that humic acid fractions were significantly younger than their humin counterparts at a site in northern Germany, it was difficult to conclude confidently that the date of one fraction was more reliable than any other. In contrast, Hill et al. (Reference Hill, Hill, Brunning, Banerjea, Fyfe, Hogg, Jones, Perez and Smith2019) found no statistical difference between humic and humin fractions in four out of five sample pairs derived from peat at Glastonbury, England—one sample pair showed an older humin fraction, probably as a result of site disturbance.
The south Atlantic subantarctic islands of South Georgia and the Falklands are situated within the core latitude of the westerly wind belt (51–54°S). These islands have long been recognized for their potential for reconstructing regional and hemispheric climate and environmental changes (Barrow Reference Barrow1978), and have been the focus of several recent studies (van der Putten et al. Reference van der Putten, Verbruggen, Ochyra, Spassov, de Beaulieu, De Dapper, Hus and Thouveny2009; Strother et al. Reference Strother, Salzmann, Roberts, Hodgson, Woodward, Van Nieuwenhuyze, Verleyen, Vyverman and Moreton2015; Turney et al. Reference Turney, Jones, Lister, Jones, Williams, Hogg, Thomas, Compo, Yin and Fogwill2016a, Reference Turney, Jones, Fogwill, Hatton, Williams, Hogg, Thomas, Palmer and Mooney2016b; Berg et al. Reference Berg, White, Jivcov, Melles, Leng, Rethemeyer, Allen, Perren, Bennike and Viehberg2019; Oppedal et al. Reference Oppedal, Bakke, Paasche, Werner and van der Bilt2018; Thomas et al. Reference Thomas, Jones, Fogwill, Hatton, Williams, Hogg, Mooney, Jones, Lister, Mayewski and Turney2018a; White et al. Reference White, Bennike, Melles, Berg and Binnie2018). The geochronological basis for these reconstructions has relied almost wholly on 14C. While both islands experience a generally cool, maritime climate, the combination of extremes in altitude, climate, sea ice and glacial/periglacial conditions (the latter notably on South Georgia), and limited vegetation cover, has created landscapes that are highly dynamic across a range of timescales, with substantial potential for remobilization of sediments (and associated 14C; Wilson et al. Reference Wilson, Clark, Birnie and Moore2002; Oppedal et al. Reference Oppedal, Bakke, Paasche, Werner and van der Bilt2018).
This study compares 14C determinations from different depositional environments on the highly dynamic subantarctic islands of the South Atlantic to investigate the most suitable fraction for 14C dating, and to investigate the influence of local geomorphology on the 14C inventory. We report a study of six sites from a range of different depositional terrestrial environments on two subantarctic islands in the South Atlantic: the Falkland Islands and South Georgia (Figure 1). To investigate the most reliable fraction(s), a total of 112 14C ages were obtained, comprising 24 pairs of bulk peat and macrofossils (coarse fraction, >0.2 mm), 21 pairs of fine fraction (<0.2 mm) and macrofossils, and two triplets of all three fractions. Here we explore different influences on the radiocarbon inventory in each sequence.
A) The South Atlantic sector of the Southern Ocean with the locations of the Falkland Islands (FI) and South Georgia (SG) (black boxes). Average positions of the southern limb of the Antarctic Circumpolar Current (purple, solid line), the polar front (red, dashed line), subantarctic front (green, dotted line) and the subtropical front (orange, dot-dash line) (Orsi et al. Reference Orsi, Whitworth and Nowlin1995). B) Falkland Islands (site locations at black X). C) South Georgia (site locations at black X, study discussed in text black circle). Maps produced with GMT (Wessel et al. Reference Wessel, Smith, Scharroo, Luis and Wobbe2013). (Please see electronic version for color figures.)

Study Area
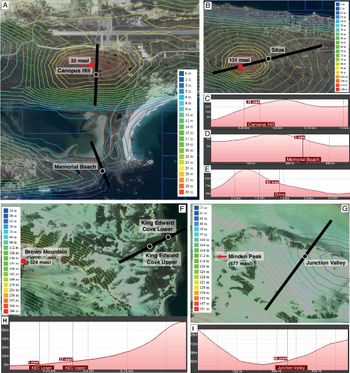
The Falkland Islands and South Georgia lie in the South Atlantic at 52°S and 54°S, respectively. The Falklands are 540 km east of the coast of South America and 1500 km west of subantarctic South Georgia (Figure 1). Three sites were investigated on the Falkland Islands in the immediate area of Port Stanley (Figures 1 and 2). The first selected site was Canopus Hill, an Ericaceous-grass dominated peatland situated above Port Stanley Airport (51.691°S, 57.785°W, approximately 30 m above mean sea level (masl) (Figure 2A–E) from which a sediment sequence 1.6 m long was cored. In addition, we investigated peat sequences from Memorial Beach (51.70053°S, 57.78331°W, approximately 5 masl), and Silos (51.70224°S, 57.87939°W, approximately 83 masl) where we recovered 1.6 m and 0.7 m of sediment, respectively. While the site at Silos is located on a gentle slope approximately 0.7 km from a local topographic peak, Memorial Beach is located on a narrow coastal isthmus, just above sea level (Figure 2A–E). On South Georgia, three moss-dominated (Polytrichum strictum and Chorisodontium aciphyllum) peat sites were investigated: a 0.8 m long record was obtained from King Edward Cove Lower (54.293°S, 36.494°W, approximately 5 masl); 0.9 m from King Edward Cove Upper (54.29396°S, 36.49642°W, approximately 23 masl) in Cumberland Bay; and a 0.7 m sequence was collected from Junction Valley (54.298°S, 36.524°W, approximately 80 masl, some 2 km farther inland from King Edward Cove). King Edward Cove Upper and Lower have similar depositional environments, located on the low gradient slopes, while the site at Junction Valley is located on the toeslopes of the relatively wide valley (Figure 2F–I); all are surrounded by vegetated slopes and rocky peaks.
Site location maps with contours showing terrain, and elevation profiles: A) Canopus Hill and Memorial Beach contour map; B) Silos contour map; C, D, E) the respective elevation profiles of these 3 sites; F) King Edward Cove Lower and Upper contour map; G) Junction Valley contour map; H) the respective elevation profiles from these 3 sites. Black dots denote site locations.

The subantarctic islands of the South Atlantic have been the focus of considerable work. Prior knowledge of radiocarbon chronologies from these regions can be extremely valuable when undertaking a dating campaign on a peat sequence, particularly for identifying potential accumulation rates. Following the Last Glacial Maximum, climate amelioration allowed the establishment of blanket peat across large parts of the Falkland Islands from 16,500 yr BP (Wilson et al. Reference Wilson, Clark, Birnie and Moore2002). Today, the Falkland Islands are not glaciated, and are dominated by extensive undulating lowlands (though with several upland areas in excess of 500 m above sea level). The present climate of the Falkland Islands is characterized by a cool temperate, maritime climate, with low seasonality. The Mount Pleasant Airport weather station (Figure 1B), just a few hundred meters from the Canopus Hill site, records a mean annual temperature of 5.5°C (with a range of −5°C to 25°C), and annual precipitation of ~600 mm, which is distributed uniformly throughout the year (Lister and Jones Reference Lister and Jones2014). Peat sequences across the islands have been used for studies of palaeovegetation (Barrow Reference Barrow1978; Clark et al. Reference Clark, Huber and Wilson1998), as well as past changes in the Southern Hemisphere westerly winds through the Holocene (Turney et al. Reference Turney, Jones, Fogwill, Hatton, Williams, Hogg, Thomas, Palmer and Mooney2016b; Thomas et al. Reference Thomas, Jones, Fogwill, Hatton, Williams, Hogg, Mooney, Jones, Lister, Mayewski and Turney2018a).
South Georgia is a relatively small, mountainous island, down the axis of which are a series of icefields, many of which descend and terminate as tidewater glaciers that have experienced substantial retreat over recent decades (Bentley et al. Reference Bentley, Evans, Fogwill, Hansom, Sugden and Kubik2007; Gordon et al. Reference Gordon, Haynes and Hubbard2008; Cook et al. Reference Cook, Poncet, Cooper, Herbert and Christie2010; van der Bilt et al. Reference van der Bilt, Bakke, Werner, Paasche, Rosqvist and Vatle2017). At the Grytviken weather station (Figure 1C), a few km from the three peat sequences sampled, mean annual temperatures are ~2°C (with a range of −8°C to 20°C), with an annual precipitation over double that of the Falkland Islands at 1400 mm (mostly the result of orographic rainfall; Thomas et al. Reference Thomas, Turney, Allan, Colwell, Kelly, Lister, Jones, Beswick, Alexander, Lippmann, Herold and Jones2018b). In exceptional winters, sea ice can extend north of the island. Despite the large presence of ice over the island, the promontory of land around Grytviken is not currently directly influenced by glacial activity. However, recent work has suggested periods of glacial advance (and retreat) during the Holocene (van der Bilt et al. Reference van der Bilt, Bakke, Werner, Paasche, Rosqvist and Vatle2017; Oppedal et al. Reference Oppedal, Bakke, Paasche, Werner and van der Bilt2018; Berg et al. Reference Berg, White, Jivcov, Melles, Leng, Rethemeyer, Allen, Perren, Bennike and Viehberg2019), which would likely have directly impacted the higher ground around the sites investigated. Peat sequences dating to ~9000 yr BP have been analyzed for palaeovegetation and palaeoenvironmental reconstruction (van der Putten et al. Reference van der Putten, Stieperaere, Verbruggen and Ochyra2004, Reference van der Putten, Verbruggen, Ochyra, Spassov, de Beaulieu, De Dapper, Hus and Thouveny2009). The climate and environmental history of the islands will be considered when assessing the comparability of the radiocarbon inventory from each site.
METHODS
The peat sequences investigated in this study were collected by a combination of monolith tins (upper 50 cm) and at greater depth using a D-section corer with 8-cm diameter and 50-cm length. The sequences reported here comprise a uniform, humified, dark-brown peat. The material for radiocarbon dating was sampled at designated intervals, and a 1-cm section was extracted from the core using a scalpel. Where bulk peat samples were taken, any obvious woody rootlets were removed. To separate the fine and coarse fractions, the sample material was wet-sieved at 0.2 mm. Sufficient micro- and macrofossil material for 14C dating was obtained for each fraction after sieving.
The 14C samples were pretreated, combusted, and graphitized at the University of Waikato Radiocarbon Laboratory. The 14C/12C measurement was undertaken at the University of California at Irvine (UCI). All samples were pretreated using an acid-base-acid (ABA) protocol with multiple base extractions. Our routine procedure is 1M HCl at 80°C for 1 hr; 1M NaOH at 80°C for 30 min; 1M HCl at 80°C for 1 hr; 80°C, MilliQTM water for 5 min (pH>5), sonicated, then dried at 80°C. The supernatant is removed after each step by pipette. The chemical concentrations, number of NaOH treatments (which continues until the color is no longer transferred from sample to the liquid), temperature and length of pretreatment will vary depending on the quantity and condition of the sample. The pretreated samples were converted to CO2 by combustion in sealed pre-baked quartz tubes, containing Cu and Ag wire. The CO2 was then converted to graphite using H2 and an Fe catalyst, and loaded into aluminum target holders for measurement at UCI on a NEC compact (1.5SDH) AMS system (Southon et al. Reference Southon, Santos, Druffel-Rodriguez, Druffel, Trumbore, Xu, Griffin, Ali and Mazon2004).
A total of 112 14C ages were measured from 65 discrete depth horizons from six peat sequences (three on the Falkland Islands, and three from South Georgia). To better understand the radiocarbon inventory of the peat sequences, all sampled depths were measured for bulk peat, with more detailed study of 26 subsamples measured from the coarse fraction (macrofossils, identified here as >0.2 mm), and 23 samples from the fine fraction (<0.2 mm). Some of these dates have been previously published in studies reporting synoptic atmospheric circulation change and westerly wind periodicities (Turney et al. Reference Turney, Jones, Lister, Jones, Williams, Hogg, Thomas, Compo, Yin and Fogwill2016a, Reference Turney, Jones, Fogwill, Hatton, Williams, Hogg, Thomas, Palmer and Mooney2016b; Thomas et al. Reference Thomas, Jones, Fogwill, Hatton, Williams, Hogg, Mooney, Jones, Lister, Mayewski and Turney2018a). We report 14C measurements as percent modern carbon (pMC), since some of the ages are younger CE 1950 (i.e. after the nuclear “bomb peak”), thus allowing systematic graphing and comparison (though uncalibrated radiocarbon ages are also presented in Table 1). We analyzed the uncalibrated pMC values to separate the effect of plateaus in the calibration curve in the distribution of calibrated 14C dates. However, we also present a selection of probability density functions to show the effect of radiocarbon calibration using the Southern Hemisphere radiocarbon calibration curve (Hogg et al. Reference Hogg, Hua, Blackwell, Niu, Buck, Guilderson, Heaton, Palmer, Reimer, Reimer, Turney and Zimmerman2013; SHCal13).
Percent modern carbon and radiocarbon age and uncertainties for peat sequences on the Falkland Islands and South Georgia.

RESULTS AND DISCUSSION
The peat sequences from the two islands preserve a range of radiocarbon contents within different components of the host sediments. Canopus Hill provides the most coherent age-depth profile of the six sites investigated (Figure 3). The paired radiocarbon ages from the macrofossil, fine and bulk components are all within error, and fall on the 1:1 regression line in Figure 4, providing confidence that the age-depth relationship is robust, regardless of the fraction dated. There is therefore limited evidence of vertical movement of any fraction through the profile. Perhaps most importantly, the site is situated very near the top of a local topographic peak (Figure 2), with no surrounding higher slopes, limiting the input of older carbon into the site. Memorial Beach is situated on a short isthmus with no immediate surrounding steep slopes (Figure 2), suggesting little opportunity for redeposition of older carbon. While only bulk peat dating was undertaken, two duplicates were measured which dated within uncertainties (Figure 3). As the characteristics of Memorial Bay resemble that of Canopus Hill, we assume the age-depth profile also to be coherent.
pMC vs. depth plot for each site on the Falkland Islands and South Georgia, with the coarse, fine, and bulk peat fraction pMC plotted.

Scatterplot of pMC values for all sites with duplicate measurements, with the coarse, fine and bulk peat fraction separated. Solid line indicates a 1:1 regression, dashed line is a simple linear regression.

In contrast to the above, the peat sequence at Silos has highly variable age components (Figure 3). Importantly, the 70 cm record captures most, if not all, of the Holocene (Table 1). The closest topographic high-point, only some 0.7 km distant, and the relatively steep slope (Figure 2) may have been the origin for reworked carbon, resulting in anomalously older ages for the fine fraction at any given depth (Figure 4). Here we find differences of up to 16 pMC from the upper part of the record (Wk 33414 for the coarse and fine fraction at 15–16 cm; Table 1); a duplicate coarse sample from the same depth indicates a 4 pMC difference (Wk 34838). At 65–66 cm depth, two duplicate coarse fractions indicate a difference of 11 pMC (Wk 33416 & 34840). Perhaps tellingly, the poor replication of duplicate samples demonstrates that developing a robust chronology from slowly accumulating sequences in areas surrounded by relatively steep slopes can be highly challenging.
To test the above interpretation, we sampled three sequences from South Georgia. Our immediate focus was on two sites near the coast at King Edward Cove. The “Upper” sequence was sampled from a peat-covered terrace towards the eastern base of Brown Mountain (324 masl), while the “Lower” record was obtained at lower elevation (i.e. below the terrace) closer to the coast (Figure 2). The two sites were selected to test whether the (upper) terrace site might be more vulnerable to the input of older carbon from Brown Mountain. In the Upper sequence we find that none of the components provide an internally coherent series of ages, although the coarse (macrofossil) samples are consistently younger than the other fractions (Figures 3 and 4). In contrast, the Lower sequence (farther from Brown Mountain) displays a striking consistent offset in 14C measurements between the three fractions, with the coarse macrofossils the youngest component, and the fine the oldest. The implication of these two series is that close to mountain slopes, the coarse macrofossil fraction cannot necessarily be considered reliable, and that the fine fraction may be vertically mobile, resulting in older ages at depth.
Importantly, these findings do not preclude dating of sequences at relatively high elevations, as long as the site is surrounded by open, low gradient terrain as found at Junction Valley (Figure 2). The area is characterised by a succession of small peat terraces higher up that are stepped down through Junction Valley, allowing the opportunity to capture the (re)deposition of material from the upper slopes before it reaches the lower slopes. Here we sampled a peat sequence on the base of the hillslope, distant from the steeper upper slopes, that is relatively slowly accumulating (arguably similar to Silos on the Falkland Islands; Table 1). The sequence exhibits a surprising coherence between the different size fractions (Figure 3). However, two “infinitely-old” ages were measured from near the surface (macrofossils from 7–7.5 cm; Wk 35147) and at depth (the fine fraction at 36–37 cm; Wk 34607), suggesting that there is still potential for redeposition of significantly older carbon from eroding deposits upslope near Minden Peak (677 masl).
The calibration of 14C ages relies on the construction of an appropriate calibration curve (e.g. IntCal13 (Reimer et al. Reference Reimer, Bard, Bayliss, Beck, Blackwell and Ramsey2013a) for Northern Hemisphere samples, and SHCal13 (Hogg et al. Reference Hogg, Hua, Blackwell, Niu, Buck, Guilderson, Heaton, Palmer, Reimer, Reimer, Turney and Zimmerman2013) for Southern Hemisphere samples). However, a characteristic feature of calibration curves is that radiocarbon age is not precisely linear with calendar age, as evidenced by the presence of radiocarbon plateaux, where single 14C ages correspond to multiple calendar ages, and “wiggles,” where 14C ages fluctuate rapidly. As a result, a single 14C date may correspond to more than one calendar age, or a large time interval with a corresponding large uncertainty. Conversely, in periods containing 14C “wiggles,” a surprisingly precise chronology can be determined, and Bayesian age-modeling software such as OxCal (Bronk Ramsey and Lee Reference Bronk and Lee2013) and Bacon (Blaauw and Christen Reference Blaauw and Christen2011) can significantly reduce chronological uncertainties within a sequence.
In the Canopus Hill peat sequence, calibration of the paired 14C ages from the different fractions results in virtually identical probability distribution functions for the calendar age ranges, although the exact degree of overlap depends somewhat on the structure of the calibration curve (Figure 5). Both the 57.5 cm and the 35.5 cm dated horizon in this sequence display a bimodal distribution as a result of the complex structure of the calibration curve, making the calendar age range estimation larger than a comparable unimodal distribution. However, in the Silos sequence, the difference in age determination between the three fractions is exacerbated when ages are calibrated, with individual horizons displaying a range of several millennia (Figure 6).
The calibrated age probability density distributions of paired fractions from Canopus Hill, Falkland Islands: coarse (green) and fine (purple), and coarse (green) and bulk (yellow) AMS 14C ages. Calibrated with SHCal13 calibration curve (blue line) (Hogg et al. Reference Hogg, Hua, Blackwell, Niu, Buck, Guilderson, Heaton, Palmer, Reimer, Reimer, Turney and Zimmerman2013), figure plotted with OxCal v4.3.2 (Bronk Ramsey Reference Bronk2017).

The calibrated age probability density distributions of three fractions from Silos, Falkland Islands: coarse (green), fine (purple), and bulk (yellow) AMS 14C ages. Calibrated with SHCal13 calibration curve (blue line) (Hogg et al. Reference Hogg, Hua, Blackwell, Niu, Buck, Guilderson, Heaton, Palmer, Reimer, Reimer, Turney and Zimmerman2013), figure plotted with OxCal v4.3.2 (Bronk Ramsey Reference Bronk2017).

Certain climatic or environmental conditions may influence the radiocarbon inventory of different sizes and/or fractions. For example, cold environments (particularly those that are high latitude or high elevation) are generally characterized by low sedimentation rates. This increases the likelihood of higher proportions of redeposited older carbon being incorporated into the sediment sequence. In the Falkland Islands sites, both Canopus Hill and Memorial Beach have relatively high average sedimentation rates at 28.5 14C yr/cm and 17.5 14C yr/cm and display coherent age-depth profiles. Conversely, the site at Silos has a much lower sedimentation rate (119.4 14C yr/cm), with a less consistent age-depth profile, suggesting that the rates of sedimentation may play an important role in the comparability of different size fractions dated (Figure 3). However, this relationship does not hold in South Georgia, where average sedimentation rates range from 16.7 14C yr/cm (King Edward Cove Lower) to 77.6 14C yr/cm (King Edward Cover Upper) to 87.6 14C yr/cm (Junction Valley), and where Junction Valley displays the most coherent age-depth profile of the three sites, but with the slowest rate of sedimentation. This therefore suggests that while sedimentation rate is likely influential, it is not the most important factor affecting the reliability of 14C dating of peat sequences. Another possible factor affecting the 14C inventory is the contamination of marine carbon from bird droppings. Seabird colonies are common throughout the both islands though the site locations reported here were far from large colonies and beyond the direct influence of birds. While we found no physical or chemical evidence to suggest the incorporation of marine carbon, we cannot totally exclude this as a possibility.
To investigate any systematic differences in the sediment radiocarbon inventory arising from Holocene and Late Glacial environmental changes, we compared glacier and palaeoclimate reconstructions from selected sites in the Falklands and South Georgia with 14C profiles. Environmental changes, such as periods of glacier advance, seasonal snow-cover, and/or wetter conditions, can impact surface processes, potentially resulting in non-contemporaneous carbon being remobilized and incorporated into sedimentary sequences. The latter includes the migration of fine-sized material through sedimentary profiles. Although we found no evidence of cryoturbation in our sequences, it is possible that previously freezing period(s) may have impacted the stratigraphic record and left no visible evidence. For instance, several Holocene glacial advances have been recently identified in the Olsen Valley to the immediate west of Grytviken in South Georgia (Figures 1 and 7). These include an early Holocene advance (between 7200 ± 400 to 4800 ± 200 cal yr BP), a late Holocene advance (between 2700 ± 150 to 2000 ± 200 cal yr BP) and a more recent advance (500 ± 150 to 300 ± 100 cal yr BP) (Oppedal et al. Reference Oppedal, Bakke, Paasche, Werner and van der Bilt2018). Other reconstructions have suggested different periods of relatively wet and dry conditions throughout the Holocene (van der Putten et al. Reference van der Putten, Stieperaere, Verbruggen and Ochyra2004, Reference van der Putten, Verbruggen, Ochyra, Spassov, de Beaulieu, De Dapper, Hus and Thouveny2009). While the glacial advance between 2700 ± 150 to 2000 ± 200 cal yr BP coincides with a range of 14C determinations over different fractions, similar 14C distributions do not occur during other two reported glacial advances, suggesting there is limited support for strong environmental influence. In the Falkland Islands, there appears to have been a shift toward drier conditions over the last ~3000 years (Wilson et al. Reference Wilson, Clark, Birnie and Moore2002; Thomas et al. Reference Thomas, Jones, Fogwill, Hatton, Williams, Hogg, Mooney, Jones, Lister, Mayewski and Turney2018a). While Canopus Hill and Memorial Beach both display coherent age-depth profiles over this period, the site at Silos has a complex age-depth relationship, which does not appear to correlate with any published records of climate/environmental change (Figure 7). More detailed high-resolution climate reconstructions across the two islands are needed to clarify these relationships. Our results therefore suggest that while periods of environmental change can result in sediment (and 14C) remobilization, site location remains a critical factor in what are inherently highly dynamic landscapes.
The calibrated age-depth relationship for each site, with a comparison of selected glacier and qualitative palaeoclimate reconstructions from the Falklands and South Georgia: [1] (Wilson et al. Reference Wilson, Clark, Birnie and Moore2002); [2] (Thomas et al. Reference Thomas, Jones, Fogwill, Hatton, Williams, Hogg, Mooney, Jones, Lister, Mayewski and Turney2018a); [3] (Oppedal et al. Reference Oppedal, Bakke, Paasche, Werner and van der Bilt2018); [4] (van der Putten et al. Reference van der Putten, Verbruggen, Ochyra, Spassov, de Beaulieu, De Dapper, Hus and Thouveny2009); [5] (van der Putten et al. Reference van der Putten, Stieperaere, Verbruggen and Ochyra2004). Thermometer symbols with arrows denote relative warm and cool periods (blue and red boxes). Asterisks denote glacial advances (grey band). Relative wet and dry periods are shown by the purple and brown boxes, respectively.

CONCLUSIONS
We conclude that site location is the primary factor for producing robust chronologies in highly dynamic landscapes. The most desirable situations are sites with limited opportunities for redeposition from higher adjacent areas, reducing the range of 14C content within a sample. However, in situations where this is not possible, this study suggests that a coarse fraction (macrofossils) offers the best potential for ages that are more likely contemporaneous with the period of sediment accumulation. Bulk peat does not appear to introduce systematic bias and should not be excluded, a finding which supports previous studies (Blaauw et al. Reference Blaauw, van der Plicht and van Geel2004; Holmquist et al. Reference Holmquist, Finkelstein, Garneau, Massa, Yu and MacDonald2016). However, since most of the oldest ages were measured from the fine component, this fraction should be discouraged from use in the development of chronologies. Ideally, a large number of 14C age determinations should be used to construct a robust chronology in highly dynamic landscapes, with dating of duplicate fractions to determine the extent of potential incorporation of non-contemporaneous carbon. However, the cost of such an approach is typically too expensive for most studies. It is therefore crucial that a thorough understanding of the depositional context and the potential for reworking is attained for radiocarbon dating of such deposits to be most successful. This is particularly important if natural archives in the mid to high latitudes are to be fully exploited for understanding past and future climate variability and impacts (Thomas Reference Thomas2016).
ACKNOWLEDGMENTS
CSMT and CF acknowledge the support of the Australian Research Council (FL100100195, FT120100004 and DP130104156). We thank the captain and crew of the Fishery Patrol Vessel The Pharos for travel to and from South Georgia, and the Government of South Georgia and the South Sandwich Islands, and the Falkland Islands Government for permission to undertake sampling on the island (permit numbers SGEP0110/11 and R07/2011, respectively). Darren Christie kindly assisted with the fieldwork on the Falkland Islands, and Charlotte Cook helped prepare the samples in the laboratory. We would like to thank two anonymous reviewers and Associate Editor Pieter Grootes for their thorough reviews and helpful comments, which helped to improve the manuscript.