Introduction
In recent years, transition metal dichalcogenides (TMDCs) have drawn incredible research interest owing to numerous advantages over zero band gap graphene and its derivatives. The TMDCs are two-dimensional (2D) materials with the general formula MX2, where M is a transition metal atom (Ti, Mo, and W) and X is a chalcogen (S, Se, and Te) [Reference Wang, Kalantar-Zadeh, Kis, Coleman and Strano1]. In a typical TMDC, the hexagonally configured layer of metal atoms are sandwiched between the two layers of chalcogens. The intralayer X–M–X bonds are predominantly covalent in nature, whereas the sandwich layers are coupled by weak van der Waals forces. Compared with conventional chalcogenides, such a unique structure and bonding found in TMDCs provide immense potential for application in the field of nanoelectronics, optoelectronics, catalysis, energy storage, lubrication, etc. [Reference Wang, Kalantar-Zadeh, Kis, Coleman and Strano1, Reference Chhowalla, Shin, Eda, Li, Loh and Zhang2]. These layered materials are also smart enough to store and release hydrogen under special circumstances, and, consequently, have already shown their advantage in hydrogen storage applications [Reference Chhowalla, Shin, Eda, Li, Loh and Zhang2].
As an important member of the TMDC family, tungsten disulfide (WS2) has garnered significant research interest recently. To be specific, excellent mechanical, thermal, and electronic properties of WS2 could help extending its usefulness in solid lubricants, lithium batteries, dye-sensitized solar cells (DSSCs), energy storage, and photocatalysis [Reference Panigrahi and Pathak3]. Because of the van der Waals forces along out of plane (c-axis) directions, the bonds tend to get sheared when sliding occurs and, consequently, coefficient of friction (COF) is lowered [Reference Wang, Xu and Liu4]. This unique capability of sliding one atomic layer over other makes MoS2 and WS2 as the most preferred choice in specific applications, such as, solid lubricating agent. Moreover, morphology of these layered systems is likely to influence the quality of lubrication mechanism substantially. Tang et al. have synthesized multiwalled WS2 nanotubes using fluidized bed method and have investigated their corresponding mechanical properties [Reference Tang, Wei, Wang, Kawamoto, Bando, Zhi, Mitome, Zak, Tenne and Golberg5]. The thick WS2 nanotubes were found to withstand comparatively higher loading amount as compared with the thin WS2 nanotubes. The layered TMDC compounds, inorganic fullerene (IF)-type nanoparticles, and inorganic nanotubes (INT), in particular, exhibit excellent mechanical and tribological characteristics, owing to their perfect crystalline nature and inclusion of van der Waals bonding at large [Reference Kaplan-Ashiri and Tenne6]. Resembling bucky ball fullerene made of C-atoms, the IF-type WS2 systems are essentially closed cage nano-dimensional systems with a hollow core within and are usually chemically inert. Earlier it was shown that, adding IF-type WS2 nanoparticles in a polymer matrix as well as in lubricant oil could enhance the lubricating performance by significant amount [Reference Yang, Liu, Li, Li, Peng and Zou7, Reference Saini, Roy, Das, Dixit and Nayak8]. Saini et al. have reported the tribological behavior of electro-deposited Ni–WS2 composites, which ensured a noticeable lowering of COF from a value of 0.8 to 0.4 at large [Reference Saini, Roy, Das, Dixit and Nayak8]. On the other hand, Quan et al. have discussed the tribological features of WS2 solid/liquid systems with trifluorinated-propyl and chlorinated-phenyl with methyl-terminated silicone oil (FCPSO) and silahydrocarbon (SiCH) space oils [Reference Quan, Gao, Weng, Hu, Jiang, Wang, Sun and Liu9]. Their evaluation on WS2 with SiCH oil exhibited a low and stable COF and consequently, durable wear life. Moreover, derived through self-propagating high temperature synthesis (SHS) from using tungsten and molybdenum powders, nano-lamellar WS2 and MoS2 products tend to exhibit much lowered COF as compared with their commercially available counterparts [Reference An, Irtegov and de Izarra10]. The synthesized product also endorsed better lubricating performance when mixed with oil. A significantly low COF and low wear were found by Fleischer et al. when they investigated the tribological performance of IF-WS2 as an additive in oil [Reference Joly-Pottuz, Dassenoy, Belin, Vacher, Martin and Fleischer11]. A similar type of study was made by Akalin et al. where they have investigated the frictional property of IF-WS2 nanoparticles by adding various concentrations of it in mineral oil. They could record a decrease in COF in simulated engine conditions, controlling the oil temperature, speed, and normal load [Reference Gullac and Akalin12]. The thermal properties of pristine IF-WS2 and carbon-coated IF-WS2 nanoparticles were investigated by Zhu et al. with the proposition that the later would display an improved thermal stability owing to the protective layer of carbon [Reference Xu, Almeida, Chang, Xia, Wears and Zhu13]. Also, thermal and mechanical properties of graphitic carbon–coated nano IF-WS2 reinforced in poly(ether ether ketone) (PEEK) matrix exhibited a significant improvement due to particle loading [Reference Wang, Yang, Thummavichai, Xu, Hu, Chen, Xia and Zhu14]. Nevertheless, there exist gaps in literature as regards, processing route, and relevant properties to be influenced by the nature of the loading entities as well as the host matrix itself. The scope of improvement in strengthening fundamental insight while ensuring interconnected properties is still lacking.
In this work, we discuss processing and characterization of polyvinyl alcohol (PVA) dispersed IF-type WS2 nanoparticles highlighting microstructural, thermogravimetric, mechanical, and tribological properties at large. The influence of nanoparticle loading on the mechanical toughness and COF is also highlighted. Finally, the wettability property of nanoparticle-loaded polymer films was examined with the help of static and dynamic water contact angle (CA) measurements.
Results and discussion
Structural and morphological analyses
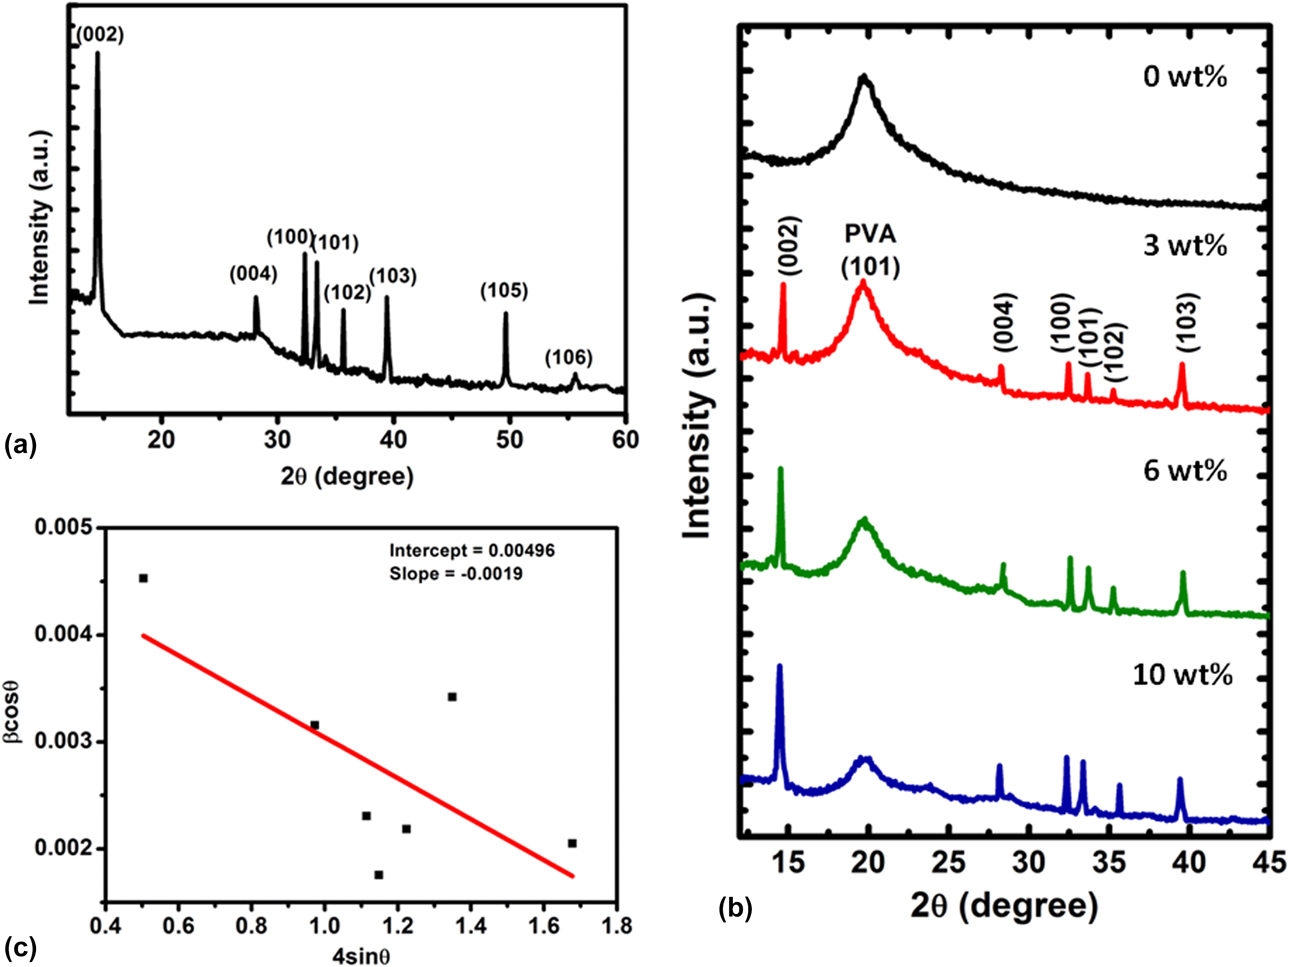
Powder X-ray diffraction (XRD) patterns of the pure IF-type WS2 nanopowder and WS2 nanoparticle-dispersed PVA films are shown in Figs. 1(a) and 1(b). The prominent peak observed at 2θ ∼ 14.45°, is attributed to (002) plane of the hexagonal phase of WS2 (JCPDS File No. 08-0237) [Reference Hazarika and Mohanta15]. Structurally, the crystallites are believed to grow along the c-axis, with stacking of (002) planes. Moreover, Bragg’s diffraction peaks at 28.34, 32.26, 33.25, 35.20, and 39.33° corresponded to the (004), (100), (101), (102), and (103) planes of hexagonal WS2, respectively [Reference Joly-Pottuz, Dassenoy, Belin, Vacher, Martin and Fleischer11]. The average crystallite size (D) of the synthesized nanoparticles has been calculated using the Williamson Hall equation, 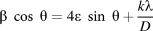 $\beta \;\cos \;\theta = 4\varepsilon \;\sin \;\theta + {{k\lambda } \over D}$, where λ is the wavelength of X-ray radiation, θ is the diffraction angle, β is the line width at half maximum height, and ε is the mean lattice strain. Plotting a graph between β cos θ versus 4 sin θ and imposing a straight line fit, the mean lattice strain and average crystallite size have been calculated from the slope and intercept on the y-axis; respectively [Fig. 1(c)] [Reference Park, Jang, Cheon, Lee, Lee and Lee16]. The average crystallite size and the micro strain were found to be 27.4 nm and −1.9 × 10⁻³, respectively. The negative value of microstrain may indicate the relaxed nature of the crystallites [Reference Hazarika and Mohanta17].
XRD plots of (a) IF-WS2 nanopowder, and (b) IF-WS2/PVA nanocomposite films with different loading content. The Williamson–Hall plot relevant to diffractogram of IF-WS2 nanosystem, shown in (c).
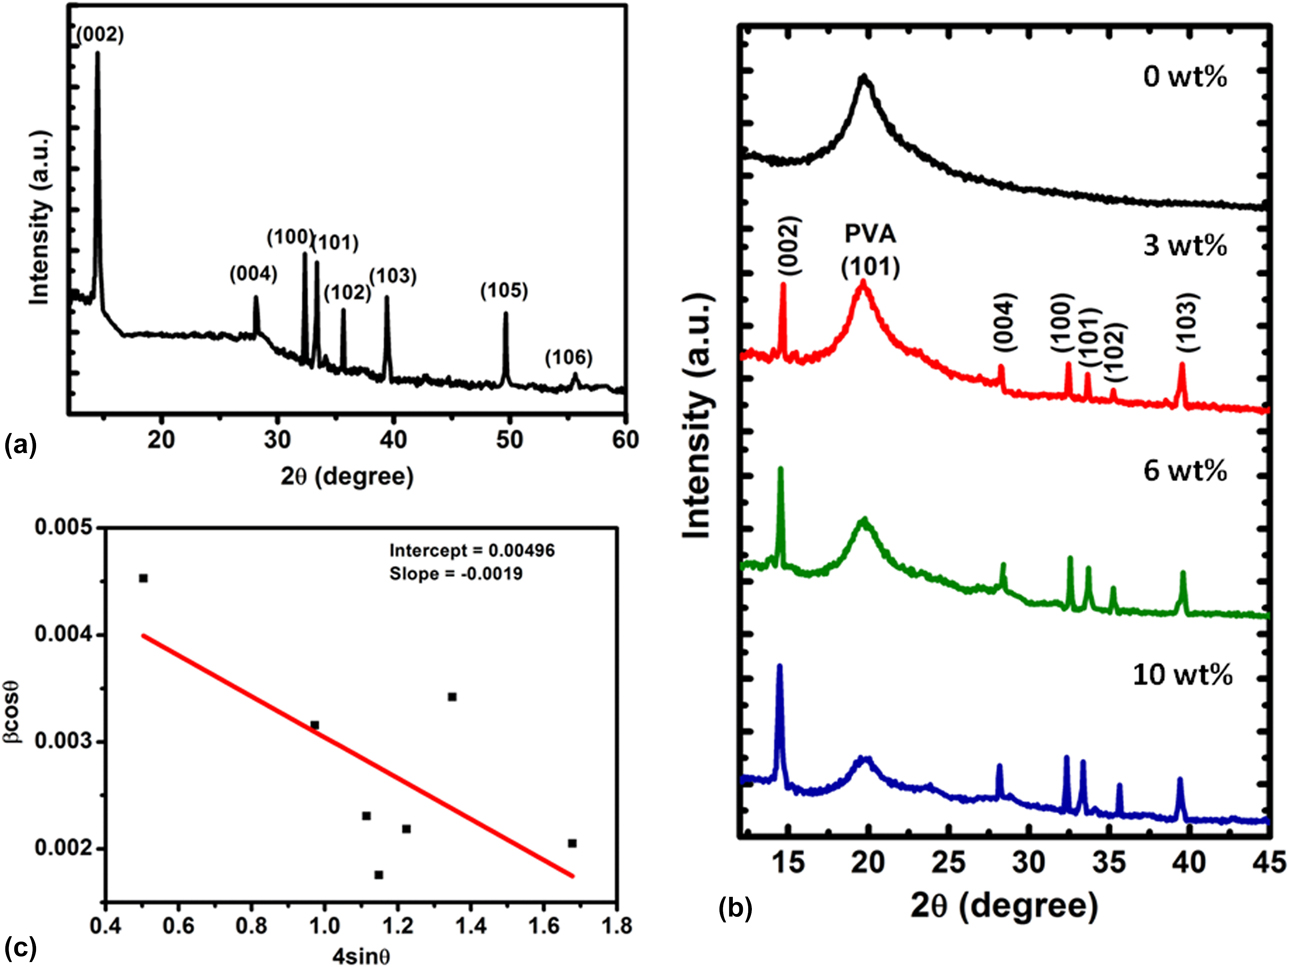
The semi-crystalline nature of PVA is evident from the Bragg’s peak located at ∼19.9°, which corresponds the (101) plane of PVA [Reference Rao, Raizada, Ganguly, Mankad, Satyanarayana and Madhu18]. The IF-WS2 nanoparticle-loaded PVA specimens exhibited suppressed WS2 peaks due to the presence of polymer environment and lack of compactness. However, with increase in the concentration of the WS2 nanoparticles, the peak intensity tends to improve significantly [Fig. 1(b)], thereby indicating an increase in the crystallinity content [Reference Ma, Qian, Yin and Zhu19]. Consequently, a decrease in the peak intensity of PVA can be noticeable due to a lowered degree of crystallinity of PVA. The loading of IF-WS2 nanoparticles causes a lowering in intermolecular interaction between the PVA chains contributing to more amorphous nature at large [Reference Hemalatha, Rukmani, Suriyamurthy and Nagabhushana20].
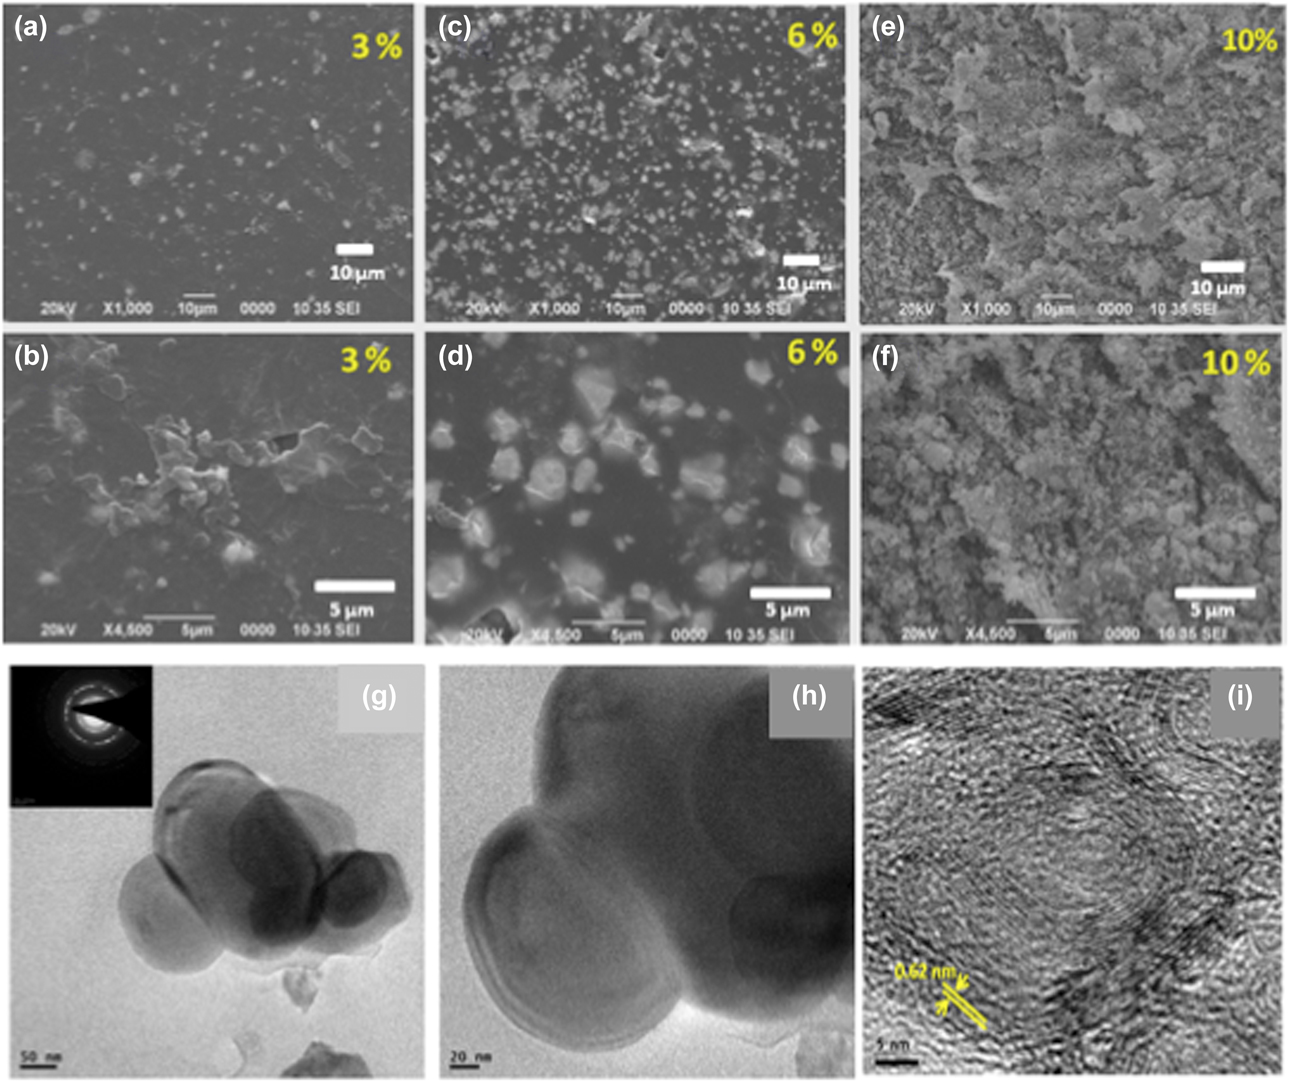
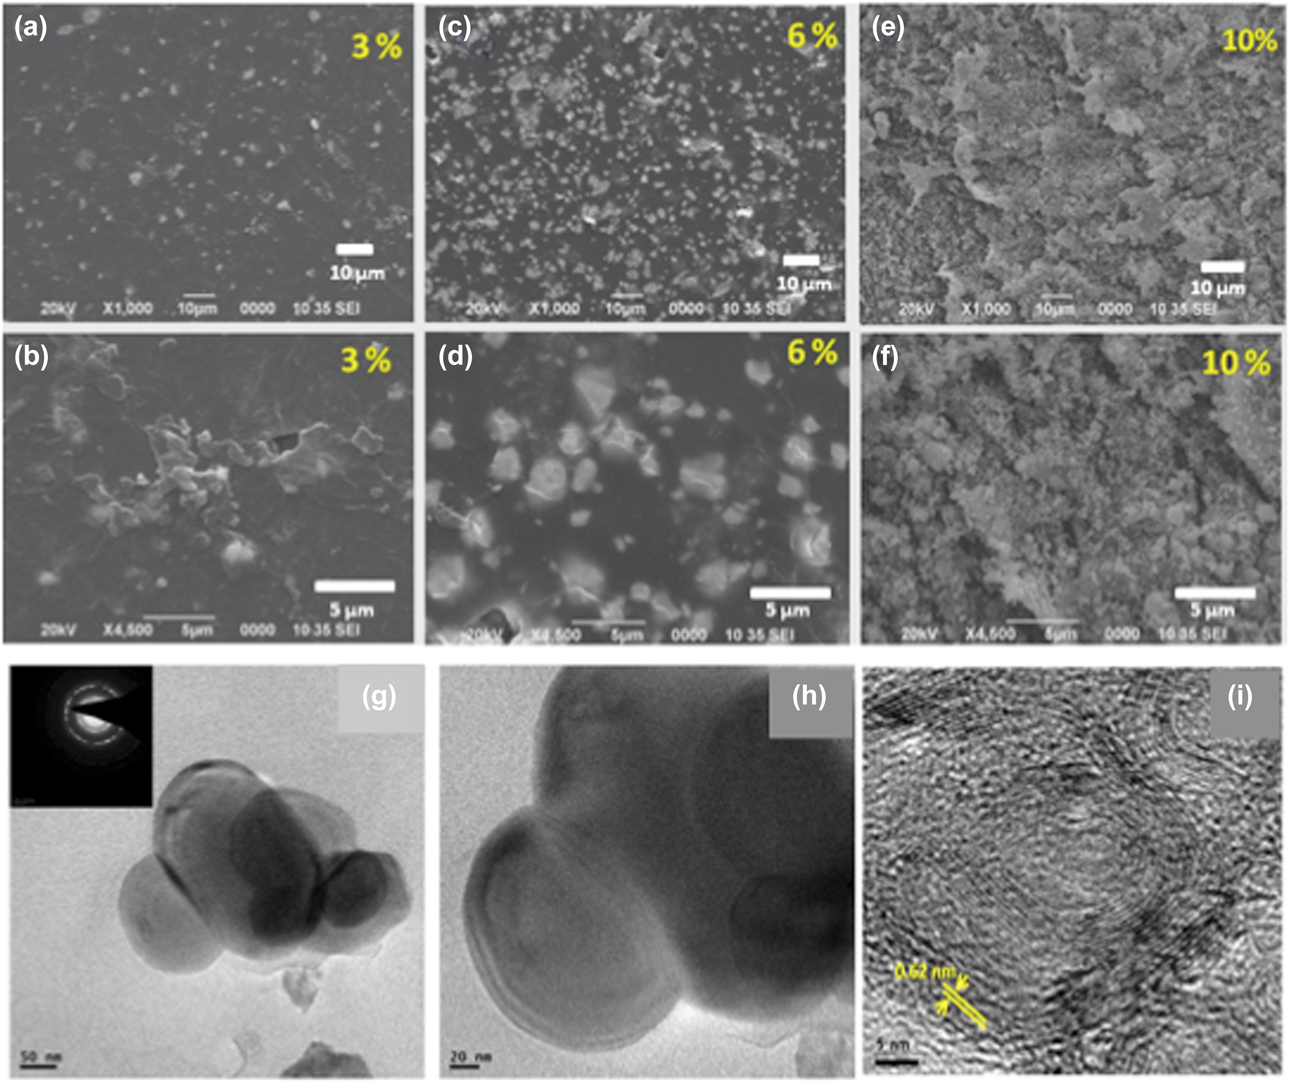
To ensure a uniform dispersion of nanoparticles in PVA, imaging through scanning electron microscopy (SEM) has been performed on different specimens, which can be found in Figs. 2(a)–2(f). The top and middle panels of micrographs essentially indicate views at low and high magnifications revealed through SEM. Apparently, the interparticle separation is comparatively large at a lower concentration of nanoparticles than the case observed for higher particle concentrations. Moreover, with increase in IF-type WS2 concentration, the agglomeration of nanoparticles increases and is maximum for 10 wt% loading of IF-type WS2. The clustering through assimilation of the nanoparticles occurred in order to minimize the overall surface energy in the confined environment [Reference Hemalatha, Rukmani, Suriyamurthy and Nagabhushana20]. Apparently, 6 wt% loading of IF-type WS2 gave a fairly good dispersity owing to homogenous distribution and minimal clustering. Low- and high-resolution transmission electron microscopy (TEM) images of IF-WS2 nanosystems are depicted in the lower panel of Fig. 2 through subfigures (g–i). The balloon-shaped structures are essentially particles that possess polyhedral entities with a hollow core at the center, representing the most-suited IF-type nanostructure [Reference Díez-Pascual, Naffakh, Marco and Ellis21]. One can notice a shadowed impression of a few particles through the WS2 nanoparticle due to their presence in successive imaging planes [Figs. 2(g) and 2(h)]. The average size of the IF-WS2 particles is in the range of 80–160 nm and nonspherical core dimension in the range of 55–75 nm. Apart from a hollow core within, note the typical bending of lattices at the IF nanoparticle surfaces, which is generally found to be obtuse [Fig. 2(i)]. Resembling carbon-based bucky ball fullerene structure, it is the regular polyhedral structure with a central core inside and adjoining edges that would create facets outside, giving the terminology as, “IF-type system.” Moreover, the SAED pattern is shown as inset of Fig. 2(g). With diffused ring patterns, the SAED pattern depicts the polycrystalline nature of the synthesized nanosystem. The interplanar spacing is calculated using the ImageJ® software (Sun Microsystems, Santa Clara, California) and found to be ∼0.62 nm.
(Upper panel) SEM images of IF-WS2/PVA solid films with different nanoparticle loading: (a) 3%, (c) 6% and (e) 10%. The magnified images are shown in (b), (d) and (f); respectively. (Lower panel) TEM micrographs of IF-WS2 nanoparticles at (g) low and (h) high magnifications. The enlarged fullerene-type WS2 highlighting interplanar spacing and bending at the surface is depicted in (i), whereas, SAED pattern is shown as inset of (g).
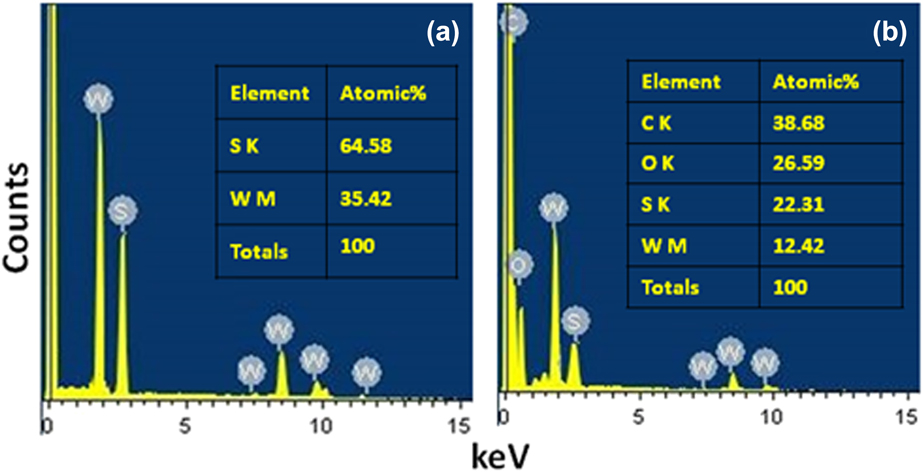
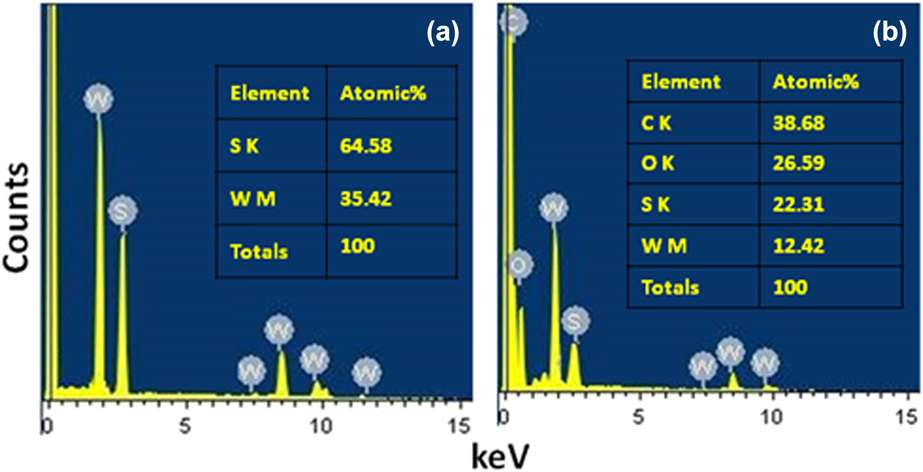
The EDX spectra of the pure WS2 nanopowder and WS2–PVA nanocomposite films are shown in Figs. 3(a) and 3(b). The presence of elements W and S can be clearly witnessed in the spectra. With regard to quantitative information, the ratio of S to W is found to be 1.85:1 in pure WS2 and 1.79:1 in 6 wt% WS2/PVA nanocomposite system. Availability of a slightly less content of sulfur could be due to the loss of unsaturated S atoms from the nanoparticle surfaces. In IF-type WS2 nanoparticle-dispersed PVA specimen, apart from peaks that arise due to W and S elements, a characteristic O-peak has been witnessed. The elements H and C are not identifiable in EDX, though the latter’s contribution near zero line could emerge from conducting carbon-tape used to fix the specimen.
EDX spectra of (a) IF-WS2 only and (b) IF-WS2/PVA nanocomposite film.
FT-IR spectroscopy and thermo-gravimetric studies
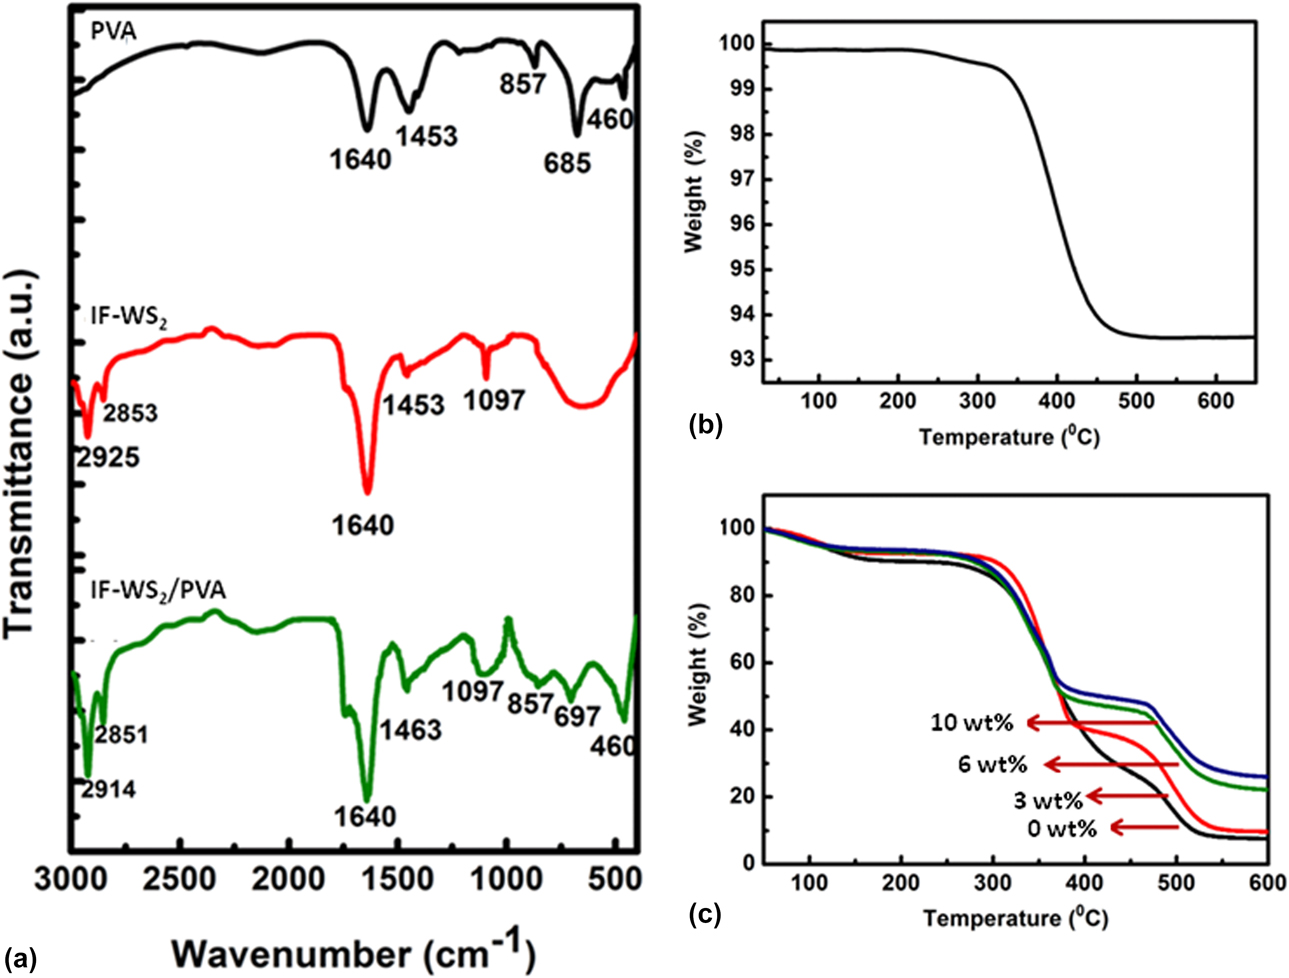
Different vibrational modes present in the nano-WS2/PVA specimens under study have been revealed through the Fourier transform infrared spectroscopy (FTIR), the results of which are shown in Fig. 4(a).
(a) FT-IR spectra of pure PVA, pure IF-WS2 and IF-WS2/PVA nanocomposites. The TGA spectra of pure IF-WS2 and IF-WS2/PVA nanocomposites with varying nanoparticle loading are depicted in (b) and (c); respectively.
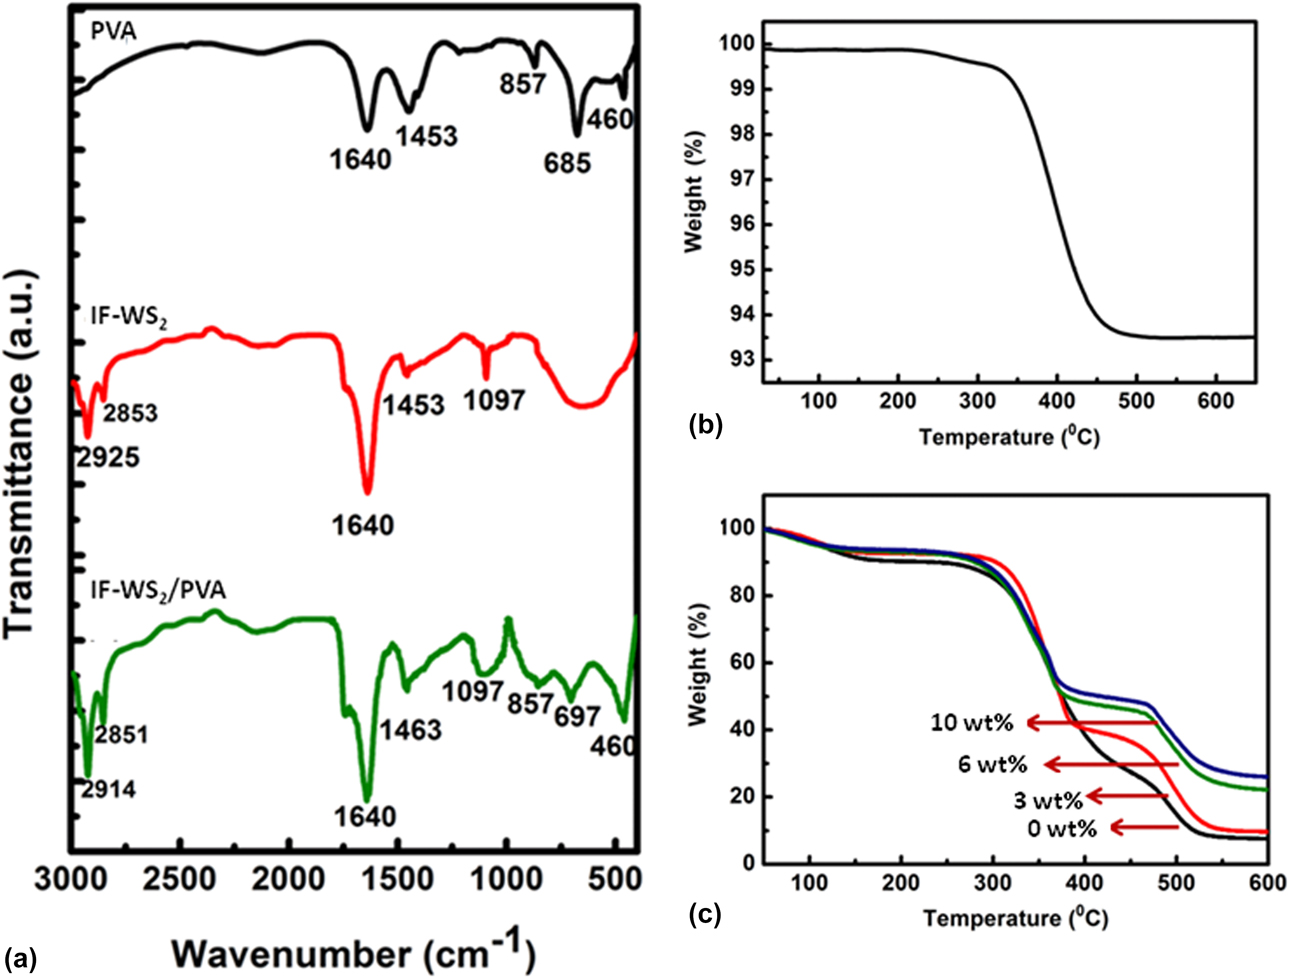
In the FTIR spectrum of the pure WS2, the band located at 460 cm−1 is attributed to the S–S bond [Reference Panigrahi and Pathak3]. Whereas, the bands at 680 and 857 cm−1 are due to the W–S stretching and bending vibrations [Reference Vattikuti, Byon and Chitturi22, Reference Wu, Yue, Xiao, Huang, Lin, Fan, Lan and Lin23]. Moreover, the peaks at 1453 and 1640 cm−1 can be ascribed to the stretching deformation of the hydroxyl group [Reference Vattikuti, Byon and Chitturi22]. Also, in case of the pure PVA film, the bands positioned at ∼1453 and 1640 cm−1 are due to the stretching deformation of the hydroxyl groups [Reference Vattikuti, Byon and Chitturi22]. A prominent band at 1097 cm−1 corresponds to C–O stretching vibration of acetyl group present in the PVA network [Reference Kim, Wie, Mahmood and Park24]. The peaks at ∼2853 cm−1 and 2925 cm−1 are believed to have originated from asymmetric and symmetric C–H stretching vibrations; respectively [Reference Xu, Almeida, Chang, Xia, Wears and Zhu13]. On the other hand, in the FTIR spectrum of the IF-type WS2/PVA nanocomposite film, the peak at ∼460 cm−1 is assigned to the S–S bond [Reference Panigrahi and Pathak3], whereas the respective bands at ∼697 and 857 cm−1 are attributed to the W–S stretching and bending vibrations [Reference Vattikuti, Byon and Chitturi22, Reference Wu, Yue, Xiao, Huang, Lin, Fan, Lan and Lin23]. The bands found at ∼1463 and 1640 cm−1 are due to the stretching vibrations of the hydroxyl group present in PVA in consistency with an earlier report [Reference Vattikuti, Byon and Chitturi22]. The peaks at ∼2851 and 2914 cm−1 are due to manifested asymmetric and symmetric C–H vibrations; respectively [Reference Kim, Wie, Mahmood and Park24]. Since all the peaks present in the FTIR spectra of pure WS2 and pure PVA are present in IF-type WS2/PVA nanocomposites with slight variation in wavenumber positions, it can be concluded that the WS2 is homogeneously dispersed within the PVA network.
The thermal stability of pure fullerene-like WS2, and IF-WS2/PVA nano-composites has been evaluated by using TGA equipment under nitrogen atmosphere, the results being depicted in Figs. 4(b) and 4(c). As can be found, the weight loss of pure IF-type WS2 starts at ∼350 °C, beyond which the loss is rapid upto a temperature of 480 °C [Fig. 4(b)]. The total weight loss of WS2 is about 6.45% when it is heated to a temperature of 650 °C. This weight loss is attributed to the substantial removal of sulfur and subsequent oxidation of IF-type WS2 to stable WO3 [Reference Xu, Almeida, Chang, Xia, Wears and Zhu13]. Between the temperature range 480–650 °C, no further loss of weight of nano IF-WS2 was observed and eventually it could suggest complete conversion of WS2 to WO3 phase [Reference Xu, Almeida, Chang, Xia, Wears and Zhu13]. The thermal decomposition of the PVA and nano-WS2/PVA nanocomposites is plotted in Fig. 4(c). The decomposition of PVA was observed along three steps over different temperature ranges [Reference Khare, Ramkumar and Verma25]. In the first step, before reaching a temperature of 160 °C, PVA loses its mass by about 9 wt% essentially through primary decomposition and the release of absorbed water, owing to the hydrophilic nature of the PVA polymer. The sharp decrease in the TGA curve observed between 260 and 420 °C characterizes ∼68% weight loss and was attributed to the degradation of –OH groups attached to the side chains of the PVA molecules. In the third step, between 430 and 520 °C, the weight loss is ascribed to the complete carbonization of the PVA structure. Above 520 °C, PVA was converted to carbon and carbonaceous product, which is stable over a range of 520–600 °C [Reference Khare, Ramkumar and Verma25]. The inclusion of nanoscale IF-WS2 into PVA was seen to improve thermal stability, especially at higher temperature and that, the temperature, at which 5, 10, 50, and 70% degradation of the nanocomposite films occur has also been predicted (see Supplementary material). Our results indicate that incorporation of nano-WS2 into PVA is capable of restricting thermal degradation/disruption of molecular chains. This can be attributed to the strong surface interactions between nanoscale WS2 and PVA, such as hydrogen bonding and the physical barrier effect of the IF-type WS2 and observed for a similar system [Reference Zhou, Jiang, Bao, Song, Wang, Tang, Hu and Gui26].
Mechanical and tribological properties
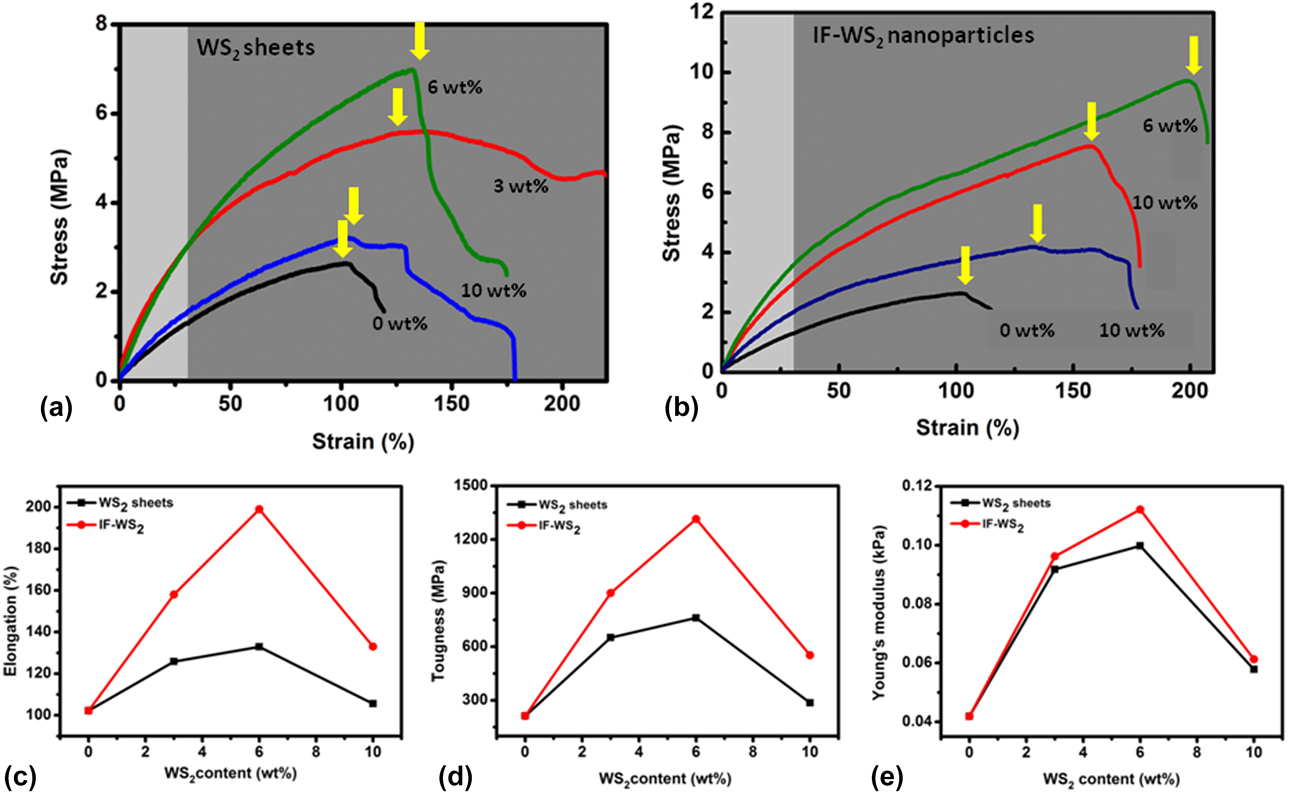
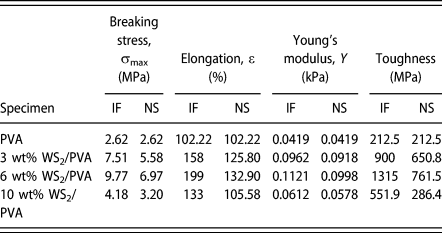
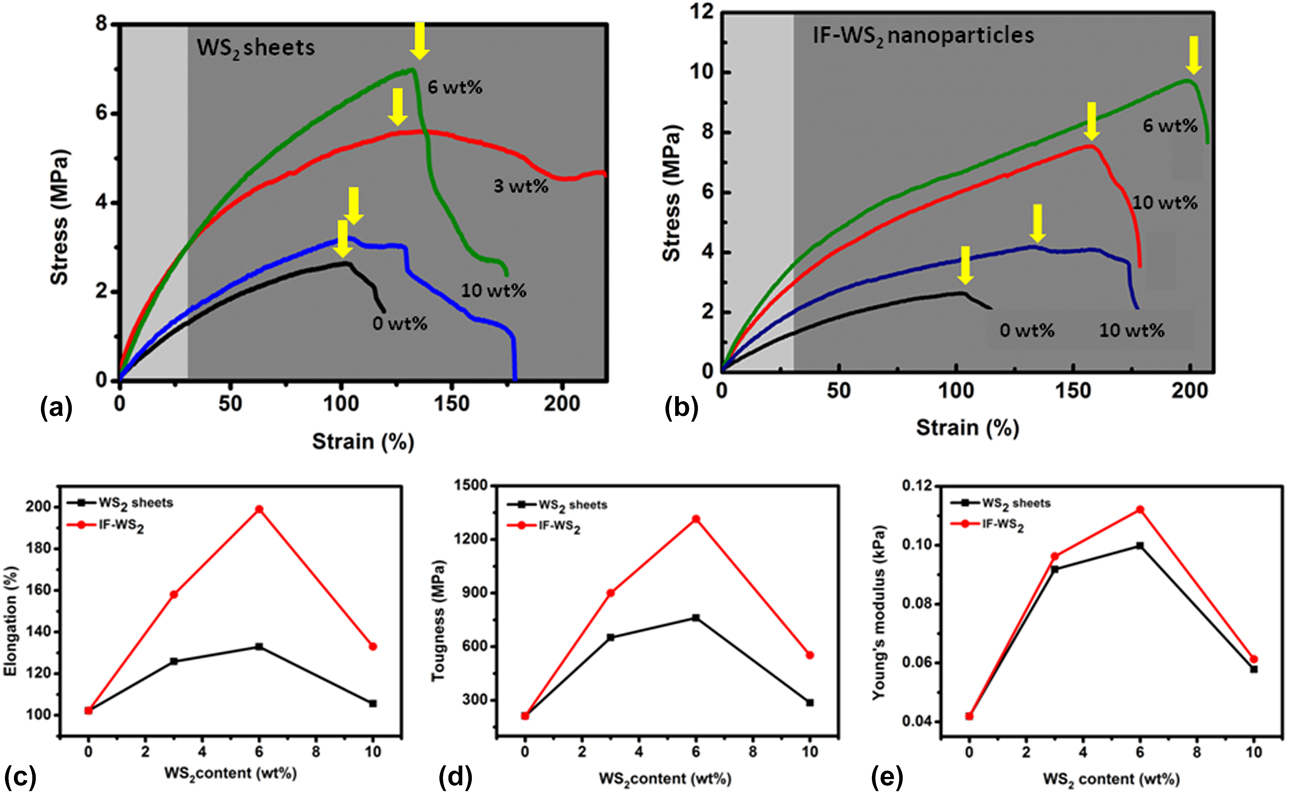
The mechanical properties of the WS2–PVA nanocomposite films were investigated using a universal testing machine (UTM) (UTM; Zwick, BZ010/TN2S, Zwick Roell GmbH & Co., Ulm, Germany). For comparison purpose, the stress–strain characteristics of the PVA dispersed with either nanosheets or IF-WS2 can be found in Figs. 5(a) and 5(b) and Table I. The microstructural properties of the WS2 nanosheets have already been reported in a recent work [Reference Hazarika and Mohanta27]. As can be noticed, the plots essentially characterize elastic and pseudo-plastic segments before reaching the breaking point. The mechanical properties such as, tensile strength, Young’s modulus, and ductility of the nanocomposite films tend to increase noticeably as compared with the pure PVA film. However, the enhancement is prominent up to inclusion of 6 wt% nanoscale IF-WS2. The toughness, as predicted from elongation at break, also follows the similar trend as other mechanical properties. Not surprisingly, mechanical feature is likely to get hindered due to overloading of the nanoparticles (10 wt%), and this was explained earlier considering agglomeration feature of WS2 in nylon 12 [Reference Xu, Yan, Shyng, Chang, Xia and Zhu28]. It is worth mentioning here that, as compared with the PVA matrix, nylon 12 is less dense, chemically resistant, and insensitive to stress cracking apart from having low water absorption capability. This is why we anticipated a higher amount of critical loading in PVA than it was witnessed in nylon 12. In fact, with a higher packing of nanoparticles, the dispersion of IF-WS2 becomes inadequate with less free volume available for the dispersed nanoparticles. As a result, the agglomeration might hamper active deformation and could result in local stress concentration [Reference Xu, Yan, Shyng, Chang, Xia and Zhu28] and this eventually leads to the reduction in elongation and toughness. A lowered elongation and improved strength was reported for IF-WS2-reinforced PEEK nanocomposites [Reference Wang, Yang, Thummavichai, Xu, Hu, Chen, Xia and Zhu14]. At similar particle dispersions, it is the IF-WS2 which offers a better mechanical strength over the PVA host dispersed with WS2 nanosheets in the present case. To be specific, elongation at break is 35% higher for PVA with 6 wt% IF-WS2 than the case for its nanosheet counterpart [Fig. 5(c)]. A significant increase in elongation at break would indicate remarkable ductility feature. On the other hand, at the critical loading (6 wt%), the toughness is nearly 44% higher with inclusion of IF-WS2 than with nanosheets despite the fact that Youngs’s modulus of the former is only slightly improved [Figs. 5(d) and 5(e)].
Mechanical stress versus strain plot of PVA nanocomposites dispersed with (a) nanosheets and (b) fullerene-like WS2. A comparative view wrt variation of elongation at break, toughness and Young’s modulus with nanoparticle loading can be found in (c), (d), and (e), respectively.
Physical parameters related to mechanical properties of PVA dispersed with either fullerene-like (IF) or nanosheets (NSs) of WS2.

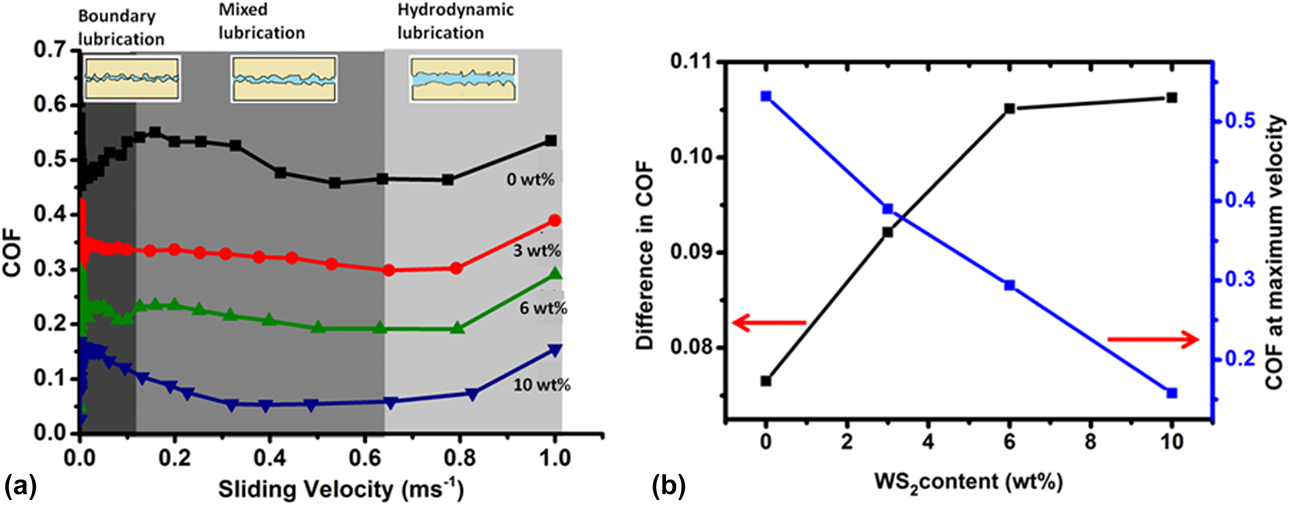
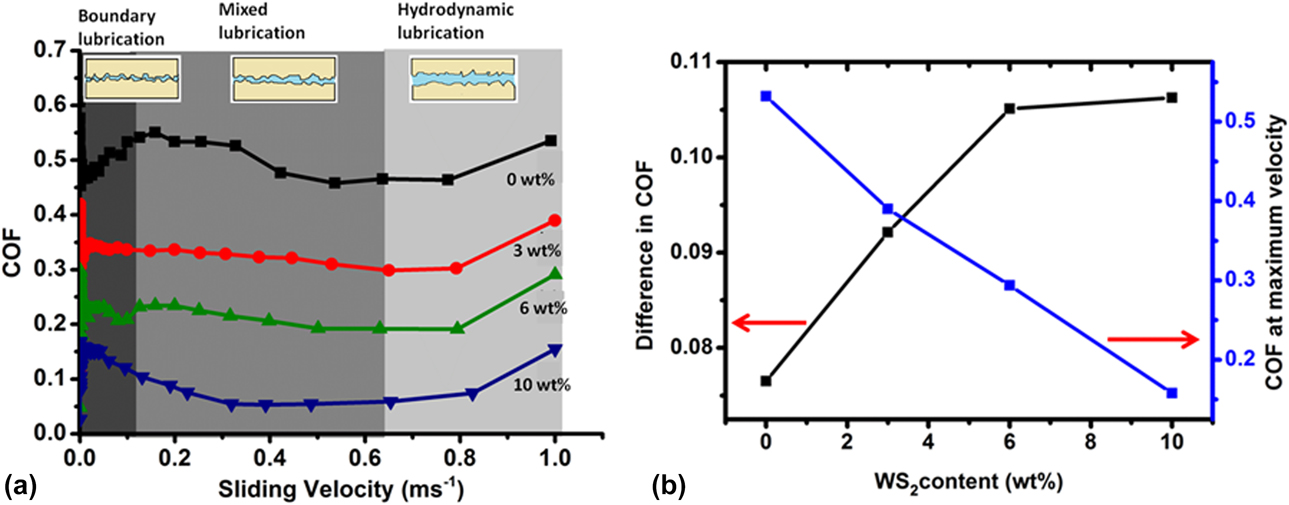
By definition, tribological property focuses on friction and wear involved when two mating surfaces are in relative motion. In this regard, the nature of coefficient of friction (COF) versus sliding velocity characteristics offer adequate information as regards lubricating property. In general, when total load is taken by the contact areas of the sliding surfaces, it is essentially the boundary lubricating region. In the mixed lubricating regime, the total load is partly taken by the asperity contact of the mating surfaces and partly by the lubricating fluid forming thin films over the contact areas. However, friction is drastically reduced in the third regime, when the whole load is taken by the lubricating fluid itself, resulting in hydrodynamic lubricating region.
In the present case, the ball on the three plate method was employed to evaluate the COF of pure and IF-type WS2/PVA nanocomposites, for which fluidic specimens were used instead of solid films. As can be found in Fig. 6(a), the results are nothing but a series of Stribeck curves depicting distinctly different (aforementioned) lubricating regions. A Stribeck curve normally gives the relationship between the Hersey number and the COF of a given fluid. The Hersey number is a the dimensionless number obtained from the velocity (v) times the dynamic viscosity (η) divided by the load per unit length of bearing (P), i.e.,  ${{v \cdot \eta } \over P}$. For a given viscosity and load, the Stribeck curve shows how the COF responds to an increasing velocity [Reference Zhu, Wang and Wang29]. It was observed that incorporation of IF-type WS2 nanoparticles is capable of lowering the COF in all the aforementioned regimes quite significantly. Moreover, this decrement in COF becomes more prominent with the increasing nanoparticle loading. Earlier, small size, cage-like morphology, and chemical inertness of WS2 within the host were ascribed to such a lowering of effective COF [Reference Yang, Liu, Li, Li, Peng and Zou7]. The low friction of layered WS2 arises owing to the existence of out-of-plane van der Waal’s bonding present between different WS2 planes, which helps one plane to slide over the other [Reference García-Lecina, García-Urrutia, Díez, Fornell, Pellicer and Sort30, Reference Tevet, Von-Huth, Popovitz-Biro, Rosentsveig, Wagner and Tenne31]. However, the presence of IF-WS2 nanoparticles in a host matrix calls for additional effects. As predicted earlier, the lowering of COF can be attributed to instant deformation of IF-WS2 under load, which may result in sheets or even exfoliated structures between the rubbing surfaces [Reference Yang, Liu, Li, Li, Peng and Zou7, Reference Tevet, Von-Huth, Popovitz-Biro, Rosentsveig, Wagner and Tenne31, Reference Rapport, Leshchinsky, Lapsker, Volovik, Nepomnyashchy, Lvvsky, Popovitz-Biro, Feldman and Tenne32]. This is because, under a normal load, the cage-like polyhedral structure in a synthetic polymer would demand rolling action in addition to sliding. Figure 6(b) essentially represents the characteristic feature of COF in the hydrodynamic lubricating regime, such as, variation in the difference in maximum and minimum COF as well as COF at maximal sliding velocity with nanoparticle loading. As can be noticed, with an increasing amount of nano-IF-WS2, the COF is dropped sharply from nearly 0.55 to 0.15 at a maximal velocity, v = 1 m/s but beyond 6 wt% the difference in COF tends to be minimal. Previously, a relatively lower critical loading (0.5–5 wt%) of IF-WS2 nanoparticles was predicted when dispersed in either a lubricant oil [Reference Yang, Liu, Li, Li, Peng and Zou7, Reference Joly-Pottuz, Dassenoy, Belin, Vacher, Martin and Fleischer11] or a paraffin oil [Reference Rapport, Leshchinsky, Lapsker, Volovik, Nepomnyashchy, Lvvsky, Popovitz-Biro, Feldman and Tenne32]. A similar situation was also realized for WS2 nanosheets dispersed in commercial grade oils [Reference Zhang, Xu, Wang, Ye, Lei, Xue, Tang and Li33]. In the present case of PVA which is an aliphatic polymer, a higher loading was possible owing to its flexibility and cage-like network. Beyond the critical loading, it is possible that the free volume around the IF-WS2 nanoparticles would decrease and, consequently, nanoparticles can come in direct contact with each other, which is clearly detrimental to the cause of lowering friction.
(a) Stribeck curves for pure PVA and IF-WS2/PVA nanocomposites with different nanoparticle loading, (b) a comparative account on the variation of COF (at maximal sliding velocity = 1 m/s) and optimal difference in COF with nanoparticle loading in the Stribeck-hydrodynamic region.
Surface-wettability studies
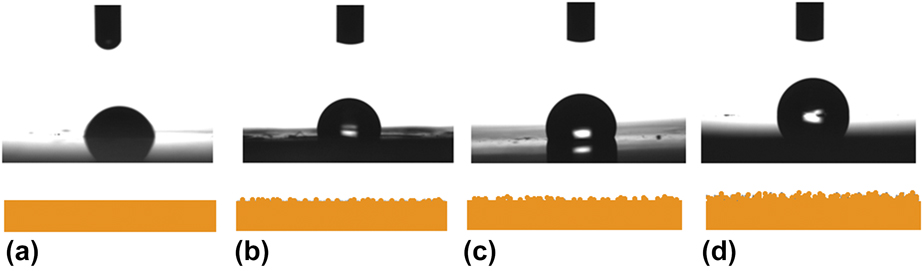
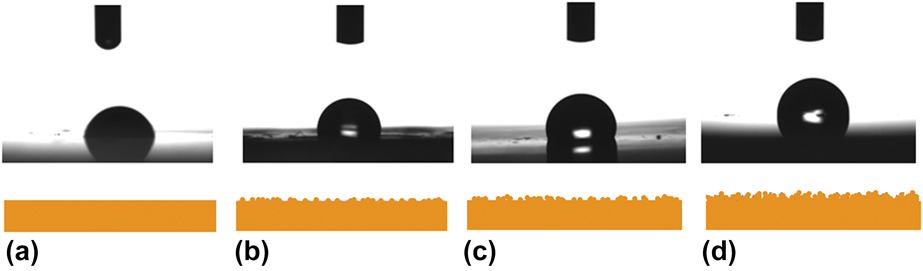
The water contact angle (CA) of PVA, and nanoscale IF-type WS2-loaded PVA (3–10 wt%) are shown in Figs. 7(a)–7(d). To be specific, exhibiting a hydrophilic response the PVA film gives a stable CA value of 68.1°, whereas nanoscale IF-type WS2-loaded films predicted CA values of ∼85.2°, 92°, and 113.9°. It is quite apparent that, with an increasing content of nano-WS2, the CAs tend to rise, owing to an increased surface roughness [Reference Hou, Deem and Choy34]. As a result, a hydrophilic to hydrophobic surface characteristics can be ensured with the inclusion of WS2 nanoparticles. It was believed that the hydrophobic behavior is a consequence of increased surface roughness of the films, as predicted in earlier work [Reference Yang, Tartaglino and Persson35]. The loading of nano-IF type WS2 systems in polymeric host is likely to induce local deformation around the particles and, consequently, may influence the surface structure drastically (lower panel, Fig. 7). The presence of localized organic–inorganic matter interface is believed to be the origin of surface roughness which would enhance CA values (see Supplementary material).
Static water CA snap-shots for (a) pure PVA, and PVA with nano IF-WS2 at (b) 3 wt%, (c) 6 wt%, and (d) 10 wt% loading.
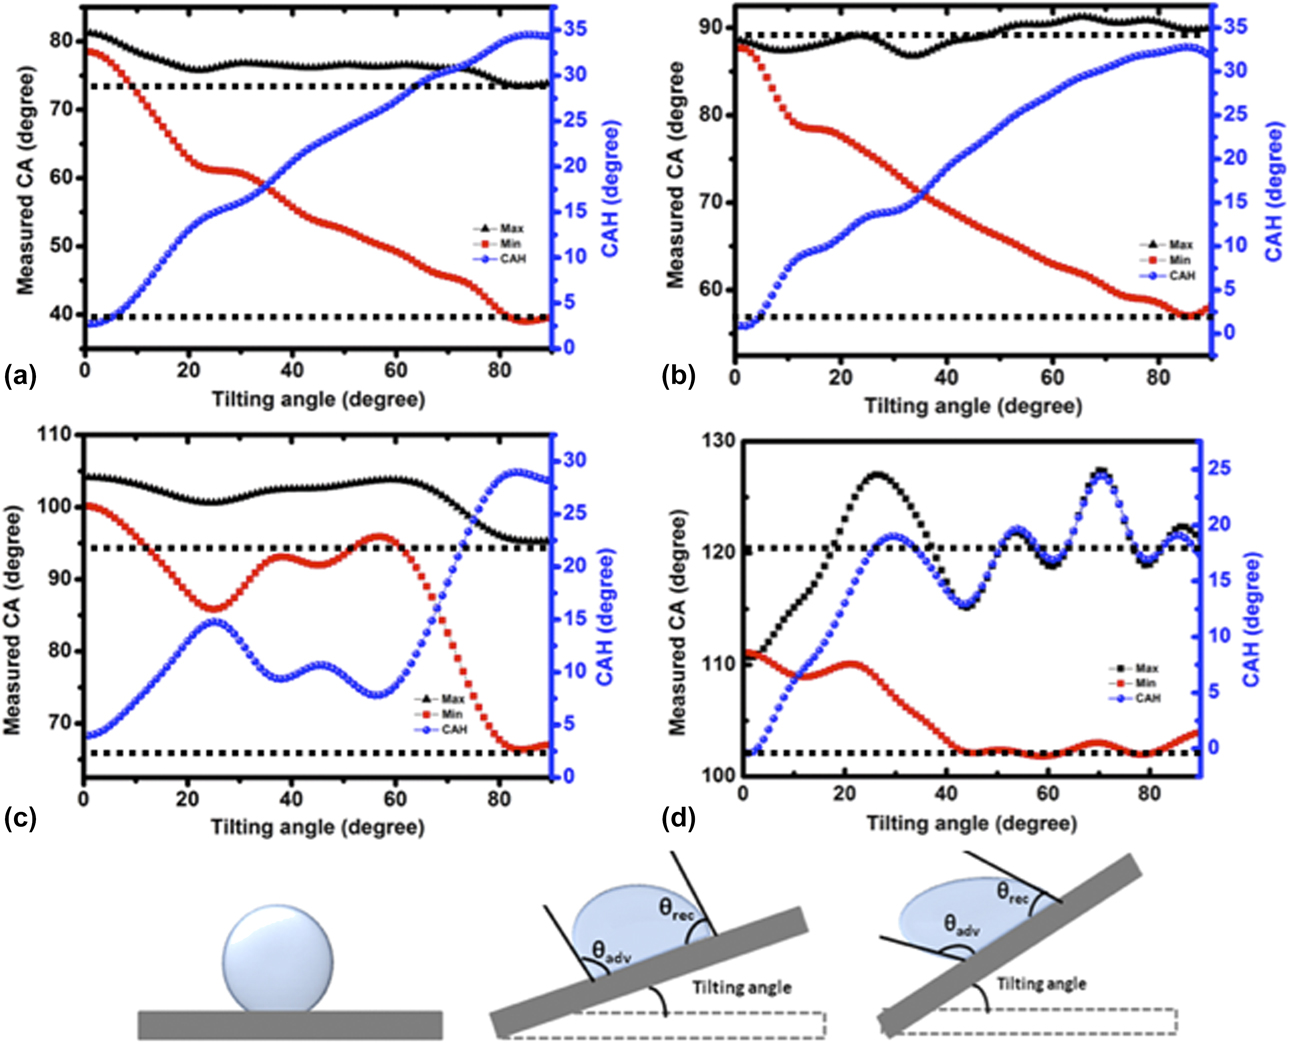
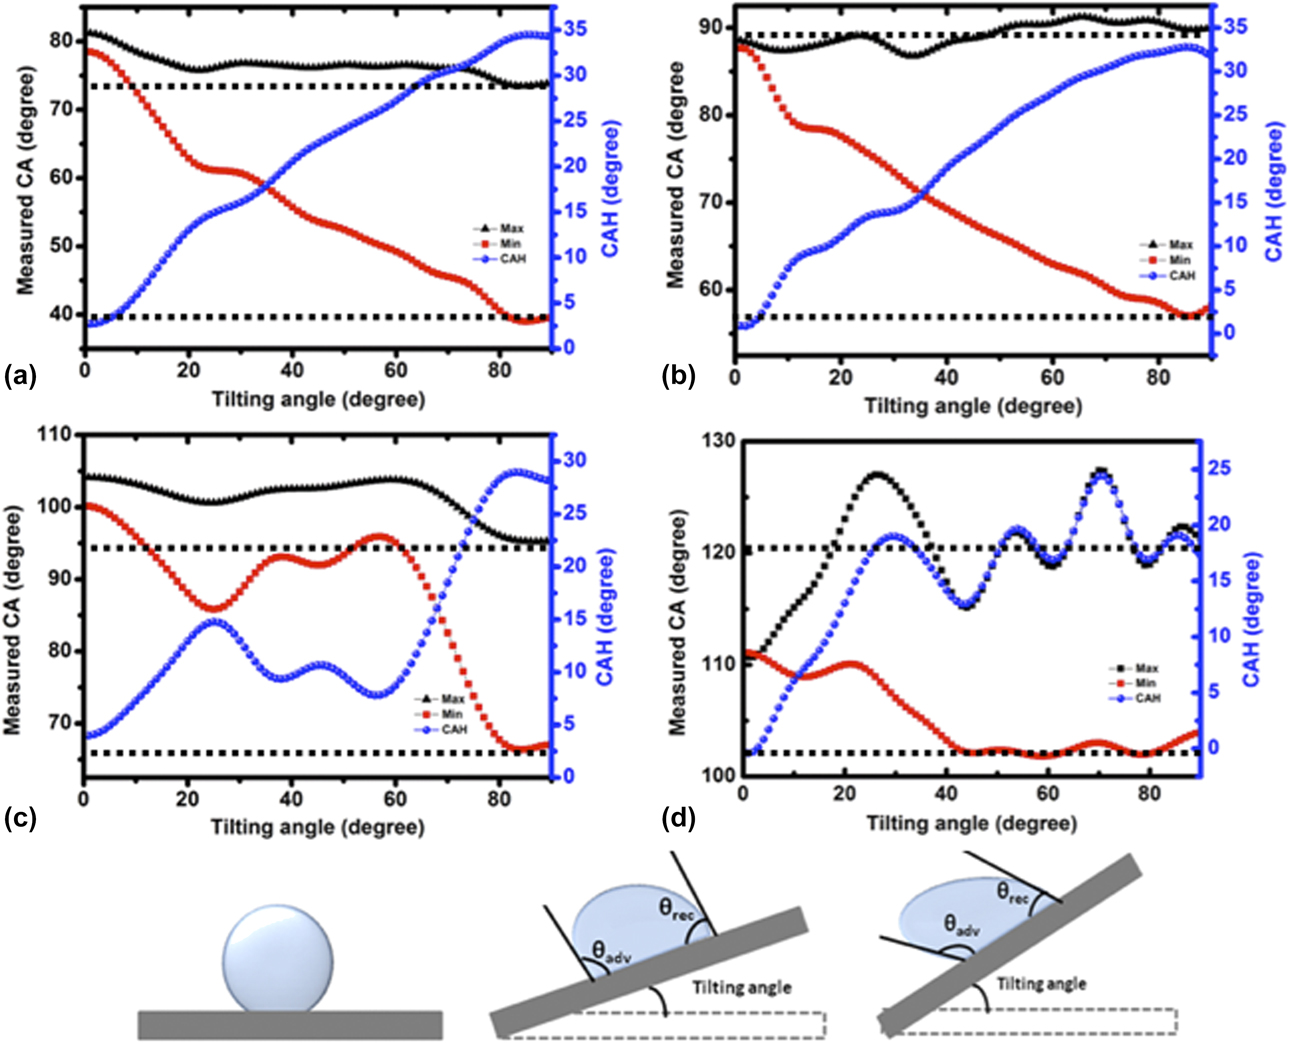
Contact angle hysteresis (CAH) is an important parameter for understanding surface wettability features of a given specimen. For measuring CAH value, the droplet is allowed to slide over the surface of the specimen under study considering tilting plate methodology. As a result of sliding, the droplet undergoes numerous changes in contact line, which leads to several CA values (Fig. 8). Theoretically, it was explained by assuming that the Gibbs energy of a system has multiple minima and a single global minimum, considering the fact that each value of the allowed CA indicates the metastable state of the system [Reference White, Santos, Rodríguez-Valverde and Velasco36]. The maximum and minimum CAs are invariably recognized as, advancing (θadv) and receding (θrec) angles and subsequently, the difference between these values give the exact CAH value. At certain degree of tilting, some critical angles are defined which gives the idea regarding change of contact line [Reference Aideo and Mohanta37]. On the surface, the angles at which the first displacement of the contact line of the water droplet occurs and the angle for which both the uphill and downhill contact line of the water droplet changes are known as critical angles, α1 and α2, respectively [Reference White, Santos, Rodríguez-Valverde and Velasco36]. Whereas the black and red curves refer to respective variations in θadv and θrec, the blue curve depicts change of CAH. Dictated by surface roughness feature, here, we noticed an enhanced static CA with an increased dispersion of the nano-WS2 content (Fig. 7 and also Supplementary material), but with undulated θadv and θrec values when subjected to tilting of the base (Fig. 8). Furthermore, even though the CAH value offers a steady growing trend with tilting angle, the overall CAH is lowered with nano-WS2 dispersion (Fig. 8, and also Supplementary material). Opposite to the “Petal effect” where a high CA and high CAH can be noticed, a higher CA and lower CAH are essentially associated with the phenomenon called “Lotus effect” where solid–liquid surface adhesion property is suppressed drastically [Reference Aideo and Mohanta37–Reference Nosonovsky and Bhushan39]. Thus, we can say that the hydrophobic response is effectively improved on addition of nano-WS2 into PVA. The schematic view of the droplet shape imposed by surface wettability and as a consequence of base tilting is presented in the lower panel of Fig. 8.
Dynamic CA and CA hysteresis obtained for different films: (a) PVA only, and PVA with nano IF-WS2 inclusions at (b) 3% wt%, (c) 6 wt%, and (d) 10 wt% loading.
We have also estimated surface energy of the nanoscale IF-type WS2/PVA films considering water (L1) and ethylene glycol (L2) as the reference liquids. According to Kaelble Uy model [Reference Kaelble and Uy40], one can split the surface tension into two components: polar and dispersive, because of the independent interactions of the solid and solvent [Reference Shen, He, Wu, Gao, Keyshar, Zhang, Yang, Ye, Vajtai, Lou and Ajayan41]. The total surface energy of the nanocomposite film is given by
 $$\gamma _{\rm{s}}^{{\rm{tot}}} = \gamma _{\rm{s}}^{\rm{d}} + \gamma _{\rm{s}}^{\rm{p}}\quad ,$$
where  $\gamma _{\rm{s}}^{\rm{d}}$ and
 $\gamma _{\rm{s}}^{\rm{p}}$ are the dispersive and polar components of the solid.
The equations which govern the aforementioned theory are given by
 $${a_1}x + {b_1}y = {d_1}\quad ,$$
 $${a_2}x + {b_2}y = {d_2},\quad x \ge 0,y \ge 0\quad ,$$
with symbolic representations,  $x \equiv \sqrt {\gamma _{\rm{s}}^{\rm{d}}}$ and
 $y \equiv \sqrt {\gamma _{\rm{s}}^{\rm{p}}}$, and
 $${a_1} = \sqrt {\gamma _{{{\rm{L}}_{\rm{1}}}}^{\rm{d}}} \;{\rm{and}}\;{b_1} = \sqrt {\gamma _{{{\rm{L}}_{\rm{1}}}}^{\rm{p}}} ,\;{d_1} = {{\gamma _{{{\rm{L}}_{\rm{1}}}}^{{\rm{tot}}}\left( {1 + \cos \;{\theta _{{{\rm{L}}_{\rm{1}}}}}} \right)} \over 2}\quad ,$$
 $${a_2} = \sqrt {\gamma _{{{\rm{L}}_{\rm{2}}}}^{\rm{d}}} \;{\rm{and}}\;{b_2} = \sqrt {\gamma _{{{\rm{L}}_{\rm{2}}}}^{\rm{p}}} ,\;{d_1} = {{\gamma _{{{\rm{L}}_{\rm{2}}}}^{{\rm{tot}}}\left( {1 + \cos \;{\theta _{{{\rm{L}}_{\rm{2}}}}}} \right)} \over 2}\quad .$$
For water,  $\gamma _{{{\rm{L}}_{\rm{1}}}}^{\rm{d}} = 22.1$,
 $\gamma _{{{\rm{L}}_{\rm{1}}}}^{\rm{p}} = 50.7$ (SFE database, Kyowa Interface Science Co., Ltd.), and therefore,
 $\gamma _{{{\rm{L}}_{\rm{1}}}}^{{\rm{tot}}} = 72.8$. For ethylene glycol,
 $\gamma _{{{\rm{L}}_{\rm{2}}}}^{\rm{d}} = 29.4$,
 $\gamma _{{{\rm{L}}_{\rm{2}}}}^{\rm{p}} = 18.3$ [Reference Kawai42], and
 $\gamma _{{{\rm{L}}_{\rm{2}}}}^{{\rm{tot}}} = 47.7$.
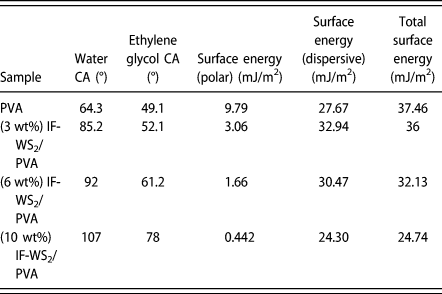
Putting the required values for each of the specimens under study in Eqs. (2) and (3), the surface energy of the nano-WS2 dispersed systems have been calculated. The values of  ${\theta _{{{\rm{L}}_{\rm{1}}}}},{\theta _{{{\rm{L}}_{\rm{2}}}}}$ as well as calculated surface energy values are shown in Table II. It is worth mentioning here that, while polar component falls rapidly, dispersive component improves with nanoparticle inclusion but eventually, total surface energy gets lowered substantially. To be specific, for a pure PVA and 10% IF-type WS2/PVA film, the total surface energies are computed as 37.4 and 24.7 mJ/m2. A marginal drop in total surface energy, an improved hydrophobic (dewetting) feature, and lowered adhesion are believed to have originated from microscopic manifestation in surface structure after inclusion of nanoparticles.
Wetting–dewetting phenomena. Surface energy measured at the nanocomposite film surfaces using static CA features.

Conclusion
In this work, we have demonstrated structural, mechanical, tribological, and wettability characteristics of hydrothermally processed IF-type WS2 nanoparticles, homogeneously dispersed in a polymer host. The polyhedral, fullerene-like nanostructures of WS2 with a hollow core inside are quite evident from the TEM imaging. The range of elastic and plastic regions are found to be dependent on the amount of nanoparticle loading, before attaining breaking point. For nanocomposite films, elongation and, consequently, Young’s modulus of elasticity generally offer an increasing trend but the maximal value was seen at 6 wt% nano-WS2 loading. Breaking stress also gives an enhanced value from 2.7 to 9.7 MPa without and with 6 wt% loading of nano-WS2. Moreover, tribological studies have revealed a significantly lowered COF with the inclusion of nano-WS2, but with a progressive increasing feature in the hydrodynamic regime. Thermally and mechanically stable nanocomposite films also presented an excellent hydrophobic response by displaying high CA but reduced CAH. Surface energies of the composite films have been calculated by considering contributions from polar and dispersive parts separately for two reference liquids. The net surface energy was found to vary in the range of 24.7–37.5 mJ/m2. More work in this direction would bring further insight as regards, wetting–dewetting transitional surface properties using diverse morphologies of WS2 and similar systems. Bifunctional mechanical and hydrophobic features have immense scope in coating, sealing, and textile industries apart from nano-mechanical components.
Experimental: materials and methodology
Synthesis of IF-type WS2 nanosystems
Mediated by reaction in solution phase, a facile, two-step hydrothermal route was employed for processing IF-type WS2 nanosystems. The detailed synthesis procedure is reported earlier [Reference Hazarika and Mohanta15].
Making of IF-type WS2 nanoparticle-dispersed fluids and solid films
First, 3 g of PVA (low molecular weight, ∼11,000 Loba Chemie, Mumbai, India) is dissolved in 100 mL DI water at a temperature of 80 °C, for 4 h. After cooling down to room temperature, WS2 powder is added to the PVA solution under vigorous stirring (∼300 rpm), followed by sufficient sonication (f ∼ 50 kHz) for about 1 h in steps. The blended solution was then spread onto a set of glass substrates kept at a temperature of 60 °C and in order to help complete evaporation of water, they were left undisturbed for ∼12 h. The complete process yielded thick solid films, with homogeneously dispersed IF-type WS2 nanoparticles. Accordingly, films were casted for three different concentrations of WS2 nanosystem viz. 3, 6, and 10% and with the film thickness varying in the range, 0.14–0.17 mm. A film without nano-inclusion is kept as reference for studying mechanical properties. It may be noted that, nanoparticle dispersed fluids without film casting are used for evaluating tribological performances.
Analytical tools and techniques employed
To exploit the structural and crystallographic properties of the synthesized IF-type WS2 nanosystems, powder XRD technique was employed using a Bruker AXS X-ray diffractometer (Karlsruhe, Germany) equipped with a Cu Kα source (λ = 1.543 Å). The morphological details of the as-synthesized IF type WS2 nanosystem were revealed through both scanning electron microscopy (SEM; JEOL JSM, 6390 LV, Tokyo, Japan) and also transmission electron microscopy (TEM; Tecnai, FEI, Czech Republic). The elemental analysis was performed through the EDX studies. Whereas, FTIR study of the IF-type nano-WS2/PVA specimens was carried out by using a FTIR spectrophotometer (Nicolet impact I-410, USA), thermogravimetric study has been performed on a thermal analyzer (TGA-DSC: TGA-50 & DSC-60, Shimadzu Co., Kyoto, Japan).
As for mechanical studies, a universal testing machine (UTM; Zwick, BZ010/TN2S) was employed to examine the tensile strength and toughness of the IF-nano WS2/PVA films. In contrast, the tribological behavior was assessed by a TwinedriveTM Rheometer (Anton Paar, MCR 702, Graz, Austria). The method of study adopted here is the ball on three plate method. In this setup, a steel ball of diameter 12.7 mm is pressed with a normal force (F = 10 N) against three plates that are mounted on a movable stage, with the specimen under study placed in between the three plates. The ball is made to rotate with an increasing sliding speed while the plates are kept at rest. As for stress versus strain measurements, IF-WS2/PVA nanocomposite solid films have been used, whereas nanoparticle-dispersed fluidic PVA systems were employed to acquire rheological/tribological data.
On the other hand, the wettability property of the dispersed systems was evaluated with the help of an advanced CA meter (Kyowa, DMs-401, Tokyo, Japan) setup. Using tilting plate methodology, the maximum and minimum angles (as regards, advancing and receding angles) have been determined. In this method, the liquid droplet is carefully dropped on the sample, where it is allowed to slide from 0° to 90°. For every unit degree of tilting, the CAs were determined considering advancing (θadv) and receding (θrec) angles. The data acquisition was done with the standard FAMAS software® (Tokyo, Japan).
Supplementary material
To view supplementary material for this article, please visit https://doi.org/10.1557/jmr.2019.301.
Acknowledgments
The authors thank CSIR, New Delhi, for providing financial support against CSIR project No. 03(1448)/18/EMR-II. The authors also acknowledge IUAC, New Delhi, for extending the support under UFR-62312/2017. The help and support extended by SAIC-TU, SAIF-NEHU, and Analytical Division of Anton Paar® India Pvt., Ltd., Gurgaon, for carrying out various experimental works are gratefully acknowledged. We also extend our sincere thanks to peers and colleagues for their valuable suggestions at various stages of the work.