I. INTRODUCTION
RuAl2 and RuGa2 are members of a family of compounds known as Nowotny chimney-ladder structure compounds.Reference Nowotny, Eyring and O’Keeffe1 Crystallizing in TiSi2 structure (also known as C54 structure) with space group Fddd, these compounds have unique atomic arrangements in which transition metal atoms are not nearest neighbors but rather surrounded by main group elements. Compounds belonging to this family are, in general, structurally complex and also found to be pseudogap semiconductors if the valence electron count (VEC) is 14.Reference Jeitschko2, Reference Imai and Watanabe3 Satisfying the VEC 14 rule, both RuAl2 and RuGa2 are indeed found to be pseudo semiconductors by various experiments. For example, RuAl2 is reported to be infrared active and its resistivity can reach as high as 2.6 Ω·cm at low (∼4.2 K) temperatures.Reference Basov, Pierce, Volkov, Poon and Timusk4, Reference Volko and Poon5 In addition, RuAl2 exhibits large negative Seebeck coefficients in excess of −250 μV/K, which is consistent with the existence of a pseudogap.Reference Mandrus, Keppens, Sales and Sarrao6 In the case of RuGa2, negative coefficient of resistance with an energy gap of ∼0.42 eV has been reported.Reference Evers, Oehlinger and Meyer7 RuGa2 is also known to possess large Seebeck coefficient in the range of 250–300 μV/K.Reference Takagiwa, Matsubayashi, Suzumura, Okada and Kimura8 Because of structural complexity,Reference Fredrickson, Lee and Hoffmann9 alloys belonging to this family often exhibit low thermal conductivity. For example, compounds such as Ru2Ge3 and MnSi1.74 exhibit thermal conductivity as low as ∼3.0–3.3 W/m·K.Reference Hayward, Ramirez and Cava10, Reference Fedorov, Zaitsev and Rowe11 Such semiconductors are ideal candidates to explore for possible use as thermoelectric materials. Hence, it is not a surprise that thermoelectric properties of several compounds belonging to this family have been studied.Reference Caillat, Fleurial and Borshchevsky12–Reference Amagai, Yamamoto, Iida and Takanashi16 Although transport studies have been performed for RuAl2 and RuGa2, systematic study of these alloys by substituting various elements is still lacking. Substitution can not only change the carrier concentration but also reduce the thermal conductivity due to impurity scattering.
Band structure calculations have been performed by many groups.Reference Manh, de Laissardiere, Julien, Mayou and Cyrot-Lackmann17–Reference Fournée, Belin-Ferré, Trambly de Laissardière, Sadoc, Volkov and Poon20 The essential conclusion is that, because of the unique crystal structural feature as mentioned above, the gap opening is not due to the charge transfer as proposed by JeitschkoReference Jeitschko2 but rather due to the hybridization of Ru-d band with sp-band of main group elements Al or Ga. Further, these calculations predict higher mobility for holes for compounds crystallizing in C54 structure (space group Fddd), which is the structure for both RuAl2 and RuGa2. However, it is not clear how high the hole mobility will be in comparison to the electron mobility. Hence, it would be interesting to compare the experimentally measured hole mobility with electron mobility.
Our main objective is to synthesize RuAl2 and RuGa2 with a wide range of carrier concentration and study their transport properties. To realize this objective, first, we substituted n-and p-type doping agents as much as possible. We have substituted different doping agents, Cr and Mn as p-type dopants and Si and Co as n-type dopants, since the solubility limit of these dopants can be different in the host alloys. In this way, a wider range carrier concentration can be achieved both in RuAl2 and RuGa2. Also we have made solid solutions, Ru0.9Fe0.1Ga2, RuAl1.9Ga0.1, and RuGaAl, where one would expect thermal conductivity reduction. Note that good thermoelectrics are poor conductors of heat, mainly because of low lattice thermal conductivity. Finally, we measured resistivity, Seebeck coefficient, thermal conductivity, and Hall coefficient to understand the role of substitution on the transport properties.
II. EXPERIMENTAL PROCEDURES
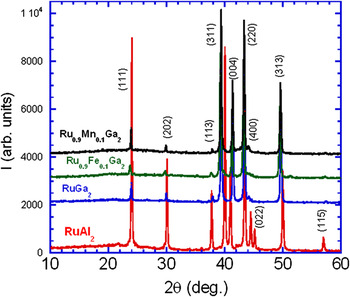
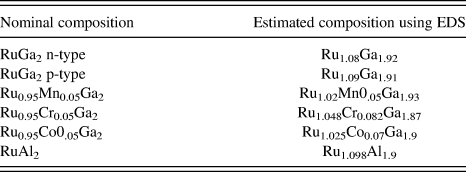
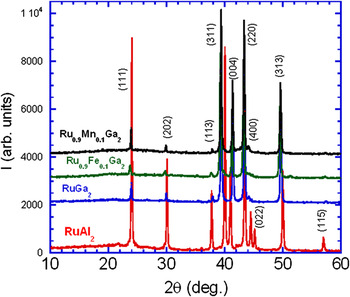
Compounds have been synthesized by arc melting appropriate quantities of high pure (99.9%) elements under a flowing Ar atmosphere. The resulting ingots were melted several times after flipping them upside down to ensure homogeneity. Al and Ga evaporation is unavoidable and hence Al and Ga were added in excess of ∼3–5% to compensate the loss. The ingots thus homogenized were subsequently annealed in evacuated and sealed quartz ampoules at ∼950 °C for 24 h followed by an additional soak at 750 °C for 2–3 days. Powder x-ray diffraction (XRD) patterns of all compositions were recorded using a Rigaku Miniflex diffractometer (Rigaku, Tokyo, Japan) to check the phase purity. Powder XRD patterns of various compositions are given in Fig. 1, which confirm the single phase nature of these compositions. Compositional analysis of several compounds was carried out using the energy dispersive x-ray spectrometer (EDS) attached with a scanning electron microscope (JSM-7500F, JEOL, Tokyo, Japan) and is given in Table I. Rectangular bars cut from the ingots were used for the measurements of resistivity, Seebeck coefficient, and thermal conductivity in a cryostat. The linear four-probe and differential methods were adopted to measure the resistivity and Seebeck coefficient, respectively. The steady state method was used to measure the thermal conductivity. Since the steady state method measures total thermal conductivity, the lattice part of thermal conductivity is obtained by subtracting the electronic part K e = L oT/ρ, where L o (2.45 × 10⁸ V2/K2) is the Lorentz number. Hall coefficients were measured on thin slabs (thickness ∼1 mm) using a commercial unit (Versalab, Quantum Design, San Diego, CA). The magnetic field (H) was swept from −3 to +3 Tesla while the Hall resistance was monitored. From Hall coefficients (R H), carrier concentration (p/n) was calculated using R H = 1/pe or 1/ne, where e is the electronic charge and p and n stand for the concentration of holes and electrons, respectively. This is a good approximation for degenerate carriers with one type of carrier dominating in the transport.Reference Fistul’21 For certain compositions, particularly n-doped high resistive samples, H versus Hall resistance sweep was found to be nonlinear and hence carrier density was not calculated.
Powder x-ray diffraction for selected compositions. The peaks are indexed by assuming an orthorhombic unit cell of space group Fddd. For other compositions, similar patterns were recorded.
Energy dispersive x-ray analysis of chemical composition of various compounds.
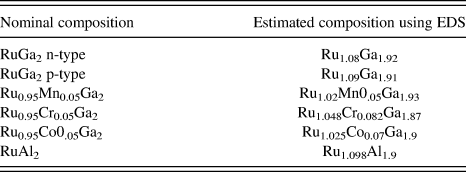
EDS, energy dispersive x-ray spectrometer.
III. RESULTS AND DISCUSSIONS
A. Resistivity
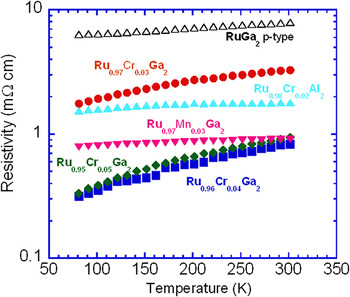
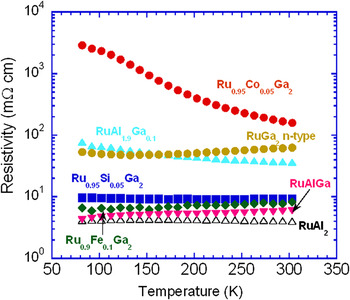
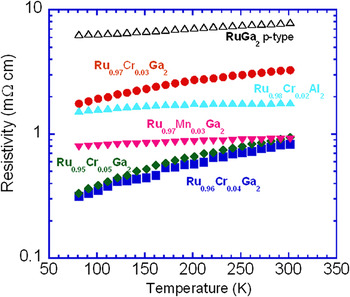
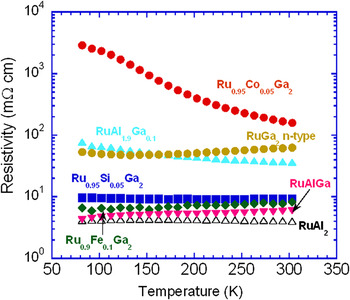
Resistivity (ρ) plots for various compositions are given in Figs. 2 and 3. The temperature dependence of ρ for these compositions is reminiscent of a highly doped semiconductor. This is consistent with the prediction of a pseudogap in the parent compounds RuAl2 and RuGa2. Indeed, at the Fermi level (EF), the band structure calculations give density of states (DOS) only around 1.1 × 10⁻⁵ states/Ry cell for RuGa2; for RuA12, this value is slightly larger around 1.7 × 10⁻⁵ states/Ry cell.Reference Manh, de Laissardiere, Julien, Mayou and Cyrot-Lackmann17 The variation of ρ among various compositions is the result of the substitution of various elements such as Cr, Mn, Co, and Si. One can expect that Cr and Mn can act as p-type and Co and Si as n-type doping agents. The effect of doping can also arise due to the nonstoichiometry, which is unavoidable in these compositions due to the preferential evaporation of Al or Ga. In general, for n-doped samples, ρ values are rather high (∼4–10 mΩ·cm), depending upon the composition. The highest resistivity (2.9 Ω·cm at 80 K) is observed for n-doped Ru0.95Co0.05Ga2. Among all the n-type samples, highest resistivity is measured for Ru0.95Co0.05Ga2. It is possible that the carrier concentration is perhaps the lowest for Ru0.95Co0.05Ga2. In contrast, for p-doped samples, the ρ values are less than ∼1 mΩ·cm. Only in weakly doped p-type samples, such as Ru0.7Cr0.3Ga2, p-type RuGa2, and Ru0.98Cr0.02Al2, is the resistivity ∼2 mΩ cm or larger. RuAl1.9Ga0.1 and RuAlGa have not been doped intentionally. Hence, it is not surprising that high resistivity ∼6 mΩ·cm for RuAlGa and ∼37 mΩ·cm for RuAl1.9Ga0.1 have been observed at 300 K. One interesting observation is that, for a comparable level of substitution, the resistivity of n-doped samples is larger by an order of magnitude than the resistivity of p-doped samples.
The temperature dependence of resistivity plotted on logarithmic scale for various p-doped samples showing the degenerate semiconductor behavior of all compositions.
The temperature dependence of resistivity of various n-doped samples. The y-axis is on logarithmic scale.
B. Seebeck coefficient
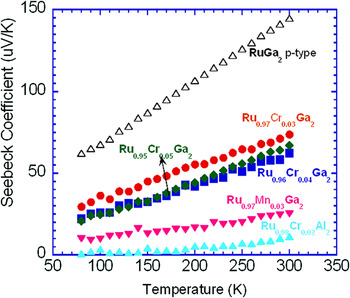
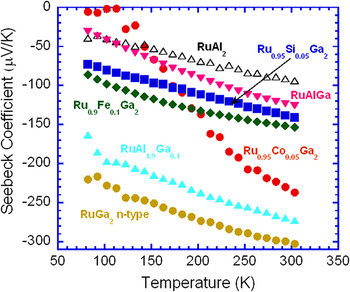
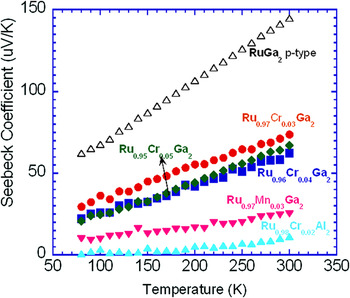
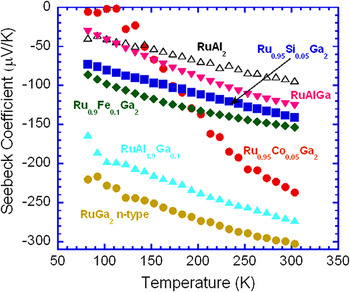
Seebeck coefficient (α) plots are given in Figs. 4 and 5. For all compositions, α steadily increases with temperature. Based on the sign of Seebeck coefficients, it appears that Mn and Cr act as p-type dopants, whereas Si and Co act as n-type dopants. Pure RuGa2 is a p-type compound with α reaching the highest value of ∼145 μV/K at 300 K. Although Mn substitution reduces the Seebeck coefficient readily to ∼26 μV/K in Cr substituted samples, α decreases systematically suggesting the systematic variation of carrier concentration. In the case on n-type samples, large negative α values approximately −250 V/K have been observed at 300 K. In Ru0.9Fe0.1Ga2, RuAlGa, and RuAl1.9Ga0.1, where the doping effect is not expected, observation of large negative α values are consistent with the prediction of larger effective mass (m*) for electrons. Above Fermi level, high DOS accompanied by a low carrier velocity has been obtained in the band structure calculations; further, DOS rises much more rapidly above EF than on the unoccupied side of the EF, predicting relatively smaller effective mass for holes.Reference Springborg and Fischer19 Soft x-ray emission and absorption spectroscopy reveals the presence of a gap in the DOS near EF.Reference Fournée, Belin-Ferré, Trambly de Laissardière, Sadoc, Volkov and Poon20 Large α values support the existence of a pseudogap and all compositions (n or p type) behave like degenerate semiconductors.
The temperature dependence of Seebeck coefficient (α) of various p-type samples showing the systematic variation of α with composition.
The temperature dependence of Seebeck coefficient (α) of various n-type samples showing the strong composition dependence of α.
In terms of Fermi integrals F x (η), the Seebeck coefficient of a degenerate semiconductor can be given byReference Fistul’21
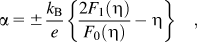
where k B is the Boltzmann constant, e is the electronic charge, and η (= EF/k BT) is the reduced Fermi energy measured from the band edge. Using the Fermi integral F 1/2 (η), the carrier concentration can be given by

where m* is the effective mass, h is Planck’s constant, and p/n is the carrier concentration. By combining these two equations, the effective mass can be calculated if the carrier concentration is known.
C. Carrier concentration and mobility
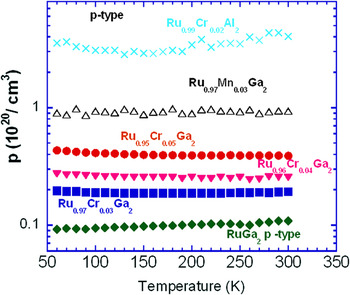
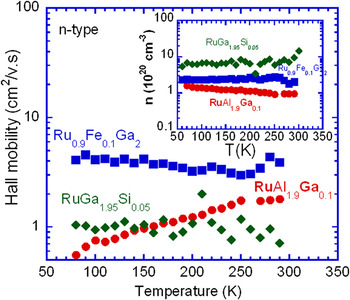
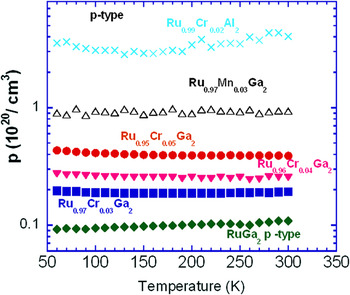
Carrier concentration and mobility for p- and n-doped samples are given in Figs. 6–8. As we see, the carrier concentration is rather large ∼1020/cm3 for both p- and n-type samples and is temperature independent. For n-type samples, carrier concentration (n) ranges from 1 × 10²⁰/cm3 to 4 × 10²⁰/cm3, whereas p-type samples shows much wider carrier concentration ranging from 0.1 × 10²⁰/cm3 to 4 × 10²⁰/cm3. This suggests that various elements substituted in the parent compounds indeed change the carrier concentration. As mentioned earlier, the effective mass was calculated by combining the Eqs. (1) and (2). The effective mass thus calculated was indeed found to be much larger for n-type than p-type samples. For n-type samples, m* is ∼3–5 m o where m o is the free electron mass, and for p-type samples, m* is around 0.4 m o. Hence, it is not a surprise that for a same level of carrier concentration, the Seebeck coefficient is larger for n-type samples.
Carrier concentration (p) versus T plots of various p-type samples.
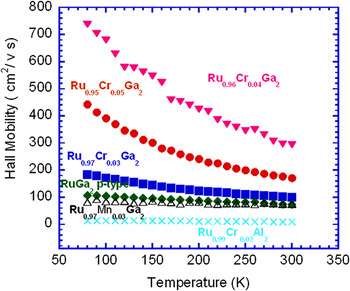
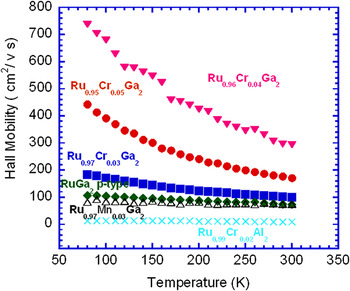
Carrier mobility (μH) versus T plots of various p-type samples.
Carrier mobility and concentration (n) of n-type samples as a function of temperature (T). Note that the y-axis is drawn on logarithmic scale.
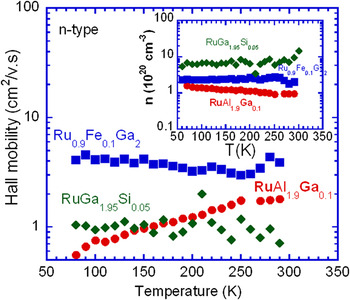
The carrier mobility calculated using the expression μ H = R H/ρ is given in the inset of Fig. 8 for n-type samples. In these samples, the mobility is relatively smaller ∼1–4 cm2/V·s, whereas for p-type samples (Fig. 7), substantially larger mobility ∼10–300 cm2/V·s has been observed depending upon the composition or doping level. Although mobility is almost temperature independent in n-type samples, mobility decreases with increasing T in p-type samples. At 80 K, for Ru0.86Cr0.4Ga2, μ H reaches as high as 750 cm2/V·s. Strong disparity in mobility is one of the interesting features we observed in this system. This is again consistent with the band structure calculation predictions of a higher mobility for holes.
D. Lattice thermal conductivity
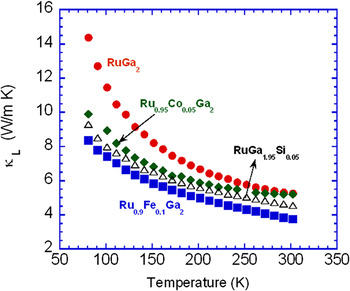
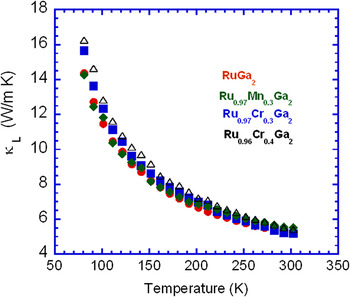
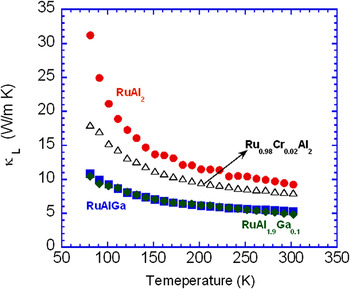
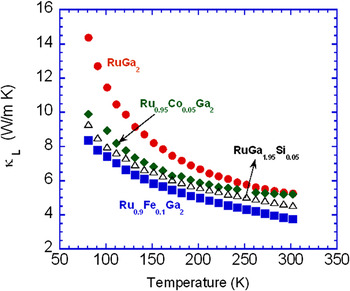
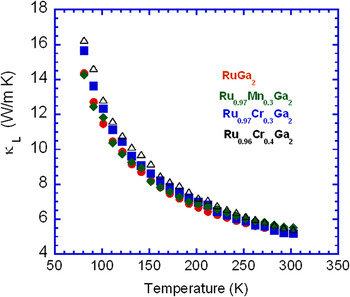
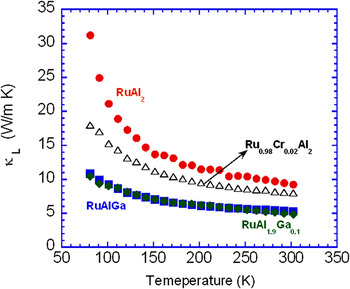
The lattice part of thermal conductivity κ L(T) is given in Figs. 9–11. For all compositions, κ L(T) decreases with increasing temperature. This is expected for crystalline materials. Although κ is larger for RuAl2, heavier RuGa2 exhibits smaller κ at all temperatures between 80 and 300 K. Further, the temperature dependence can be fitted to κ ∼ 1/Tδ with δ ∼0.8–0.75. For compounds substituted with small amounts of Cr and Mn, the temperature dependence of κ can be closely fitted to κ ∼ 1/T 0.8–0.9. This suggests that the dominant scattering mechanism in all these compounds is the Umklapp (U-process) process. In contrast, for heavily substituted compositions Ru0.9Fe0.1Ga2, RuAl1.9Ga0.1, and RuGaAl, not only κ attains smaller values but also the exponent δ attains smaller values in the range of ∼0.5–0.6.
Variation of lattice thermal conductivity (κ L) with temperature for RuGa2 along with Fe, Co, and Si substituted compositions.
Variation of lattice thermal conductivity (κ L) with temperature for RuGa2 along with Mn and Cr substituted compositions.
Variation of lattice thermal conductivity (κ L) with temperature for RuAl2 and various heavily substituted compositions.
For the phonon U-process, the lattice thermal conductivity at higher temperatures can be given byReference Slack, Ehrenreich, Seitz and Turnbull22
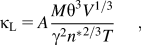
where M is the mean atomic mass, θ is the Debye temperature, V is the mean atomic volume, n* is the number of atoms in the primitive cell, γ is the Gruneisen constant, and A is a constant. Hence, 1/T dependence is expected for pure U-process. Note that for compounds with higher mean atomic mass, κ L generally decreases due to dominant decreasing contribution from θ 3. Also note that presence of large number of atoms in the unit cell decreases the thermal conductivity. In addition to the U-process, in heavily substituted semiconductors, impurity scattering will be present. The impurity scattering is due to the presence of atoms of different mass and volume in the lattice. In the case of mass fluctuation scattering, the thermal conductivity is rather weakly temperature dependent and is given byReference Wood23

where T m is the melting point, d is the density, M* is the degree of mass fluctuation. Because of larger amount of substitution, impurity scattering can contribute substantially in RuAlGa, RuAl1.9Ga0.1, and Ru0.9Fe0.1Ga2. Hence, it is not surprising that κ is low and weakly temperature dependent in these highly substituted alloys. In contrast, in pure and lightly substituted compositions, the impurity scattering is negligible and hence larger κ and a stronger temperature dependence of κ with δ ∼0.8 is observed.
IV. CONCLUDING REMARKS
To summarize, the parent compounds, RuAl2 and RuGa2 have been substituted with various p- and n-type elements. Resistivity and Seebeck coefficient vary with composition suggesting that substitution of various elements have indeed caused a doping effect. Depending upon the compositions, while resistivity varies in the range of ∼1–100 mΩ·cm at 300 K, Seebeck coefficient varies in the range of ∼10–250 μV/K. It is interesting to note that, compared to p-type samples, n-type samples exhibit rather higher resistivity by an order of magnitude. In the high resistivity Ru0.95Co0.05Ga2 sample, it is possible that the carrier concentration is perhaps lower than that of undoped n-type RuGa2. The Seebeck coefficient is also larger for n-type samples. Larger α is due to the larger effective mass that has been calculated for n-type samples. The hole concentration can be changed by an order of magnitude by substituting Cr and Mn in RuGa2. For a similar carrier concentration level, the hole mobility is much larger (approximately by two orders of magnitude) in comparison to the electron mobility at 300 K. Thermal conductivity shows characteristics of mixed scattering, particularly in heavily substituted compositions.
ACKNOWLEDGMENTS
We thank Kevin Leikert for helping us in the synthesis of RuAl2-based compositions. We also thank Kevin Zhou for EDS composition analysis. This work was supported as part of the Center for Revolutionary Materials for Solid State Energy Conversion, an Energy Frontier Research Center, funded by the U.S. Department of Energy, Office of Science, Office of Basic Energy Sciences under Award No. DE-SC0001054.