Introduction
The diagnosis of neurodegenerative disorders with primarily cognitive or behavioral symptoms is sometimes difficult in clinical practice, especially when at an early stage. There can be uncertainty as to whether some memory deficit might still be within age-related normal limits, or whether some strange behavior might just represent a personality variant or a psychological reaction to some adverse experience. Also, depression is quite common in old age and might be associated with some degree of cognitive impairment. Standard radiological techniques with visual interpretation of brain computed tomography (CT) and magnetic resonance imaging (MRI) scans usually serve the primary purpose of excluding rare diseases, like slowly growing brain tumors, chronic encephalitis or normal pressure hydrocephalus, which can mimic neurodegenerative diseases. Against this background, the field has gradually been moving towards evaluation of functional imaging techniques as diagnostic tools that might allow a positive identification of neurodegenerative disease, especially at an early stage before onset of irreversible severe disability, rather than exclusion of other diseases. Recently, these perspectives for diagnostic improvement have been highlighted by proposals for diagnosis of prodromal Alzheimer's disease (AD), which are based on non-specific symptoms such as a significant memory deficit together with a positive biomarker of AD (Dubois et al., Reference Dubois2007).
Perfusion single photon emission computed tomography (SPECT) and 18F-2-fluoro-D-deoxyglucose (fludeoxyglucose)-positron emission tomography (FDG-PET) were the first functional imaging techniques to become available for tomographic imaging of brain function. Over more than 25 years, their relation with cognitive and behavioral symptoms and underlying histopathology and molecular pathology has been explored in scientific studies. Clinical researchers have also studied their diagnostic sensitivity and specificity in various settings and with various reference techniques, and their utility has been recognized by their inclusion in diagnostic guidelines for dementia (Hort et al., Reference Hort2010). This brief review aims to summarize the results of that research and provide a perspective in the current context of competing methods and the increasing demand for specific and reliable tools for early diagnosis.
Perfusion SPECT
The first tracer to be widely used for measuring regional cerebral blood flow (rCBF) using nuclear medicine methods was the gamma-emitting isotope Xenon-133 (Lassen and Ingvar, Reference Lassen and Ingvar1963). Those early studies firmly established that rCBF is closely coupled to neuronal function: increase of rCBF due to increased neuronal function is observed during functional activation and in the extreme of focal epilepsy; coupled decreases are observed in AD and other neurodegenerative diseases. On the other hand, a substantial impairment of rCBF due to vascular occlusion can induce impaired neuronal function, as is most obviously seen in ischemic stroke.
Xenon-133 is freely diffusible in brain tissue and rCBF was calculated from wash-in and wash-out kinetics, which is not practical with the rotating gamma cameras that subsequently became standard equipment for single photon emission CT (SPECT). Tracer trapping was therefore used as an alternative principle for imaging of the regional distribution of blood flow in analogy to the experimental microsphere technique (Hossmann et al., Reference Hossmann, Hossmann and Takagi1978). Two tracers became widely commercially available for that purpose: 99mTc-hexamethylpropylene amine oxime (HMPAO) and 99mTc-cysteinate dimer (ECD). After intravenous injection they distribute in tissue approximately in proportion to rCBF and are then trapped by their chemical properties and some metabolic processes that are considered not to be affected by most brain diseases (Neirinckx et al., Reference Neirinckx, Burke, Harrison, Forster, Andersen and Lassen1988). Imaging can then be performed within a relatively liberal time window after tracer injection (Juni et al., Reference Juni1998).
FDG-PET
PET utilizes very short-lived positron-emitting isotopes. Through their annihilation by electrons in tissue, they ultimately cause the emission of two gamma photons (511 kEV) in opposite directions, which allow the reconstruction of the tracer distribution in tissue with high sensitivity and accuracy. Many tracers have been labeled with positron-emitting isotopes for functional and molecular brain imaging in humans (Herholz and Heiss, Reference Herholz and Heiss2004). FDG is the most widely available PET tracer. The net uptake rate of FDG into the brain is approximately proportional to that of regional cerebral glucose metabolism. The examination is usually performed at resting state (low ambient noise, dimmed light, no cognitive activation) and images are typically acquired 40–60 minutes after intravenous injection of FDG (Varrone et al., Reference Varrone2009a).
Cerebral glucose metabolism is closely coupled to neuronal function (Sokoloff, Reference Sokoloff1977). Glucose is the main substrate for energy production, which is required to maintain the neuronal ion gradients for neuronal activity. Coupling to synaptic activity is also mediated by the neuron–astrocyte glutamate shuttle (Pellerin and Magistretti, Reference Pellerin and Magistretti1994; Kasischke et al., Reference Kasischke, Vishwasrao, Fisher, Zipfel and Webb2004). Thus, the impairment of synaptic function in AD leads to a regional reduction of glucose metabolism that is similar to the reduction of rCBF.
Main findings
Many studies have demonstrated consistently that glucose metabolism and blood flow is impaired in temporo-parietal association cortices, with the angular gyrus and the cuneus with the posterior cingulate cortex usually being the earliest and most severely affected (for review see Devous, Reference Devous2002; Herholz, Reference Herholz2003). The frontal association cortex may also be involved, but more variably so, usually to a lesser degree and only during progression of AD. There may be a distinct hemispheric asymmetry, which usually corresponds to the predominant cognitive deficits (language impairment in the dominant and visuo-spatial disorientation in the sub-dominant hemisphere). In contrast to other dementia types, glucose metabolism in basal ganglia, primary motor and visual cortex, and cerebellum is usually well preserved. Quantitative regional analysis reveals that metabolism and blood flow are also decreased in the mesial temporal lobe (Mosconi et al., Reference Mosconi2005), but this is difficult to recognize when reading scans because in these brain areas normal rCBF and metabolism is already lower than in most other cortical areas. Typically, the mesial temporal changes are associated with substantial atrophy, which is likely to contribute to the apparent decrease due to partial volume effects (Villain et al., Reference Villain2008). The regional distribution of metabolic and blood flow impairment generally reflects AD clinical symptoms, with impairment of memory and associative thinking and, with progressive disease, also higher-order sensory processing and planning of action, but relative preservation of primary motor and sensory function.
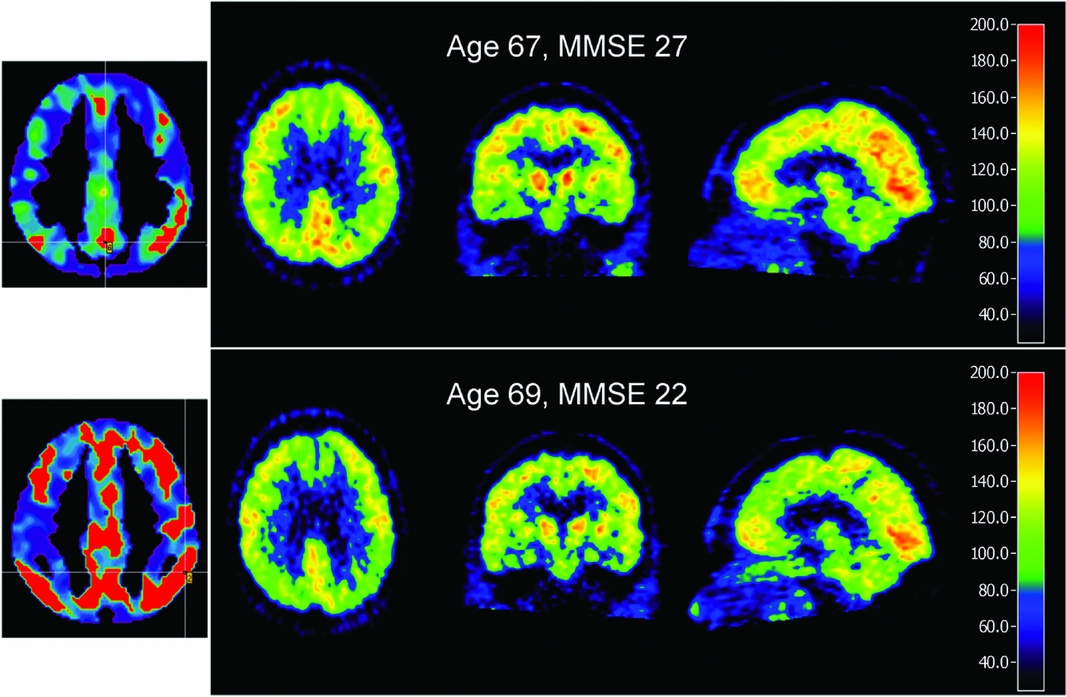
Longitudinal studies have demonstrated that the severity and extent of metabolic impairment in temporal and parietal cortex increase with dementia progression, and frontal reductions become more evident (Jagust et al., Reference Jagust, Friedland, Budinger, Koss and Ober1988; Mielke et al., Reference Mielke, Herholz, Grond, Kessler and Heiss1994). The annual decrease of metabolism in association cortices is 5–6% (Smith et al., Reference Smith1992; Landau et al., Reference Landau2009). Asymmetrical metabolic impairment and associated predominance of language or visuospatial impairment tend to persist during progression (Grady et al., Reference Grady, Haxby, Schlageter, Berg and Rapoport1986; Haxby et al., Reference Haxby1990) (Figure 1). Symptoms associated with frontal impairment can include executive dysfunction, depression, behavioral abnormalities and lack of insight (Holthoff et al., Reference Holthoff2005).
FDG-PET progression from mild cognitive impairment (top row) to dementia in Alzheimer's disease (bottom row). Brain areas with significantly reduced metabolism are marked in red on the left-most images (module PALZ; PMOD Technologies, Zurich, Switzerland). The other images show the original FDG-PET scans in three selected orthogonal slices (scaled to same intensity in reference regions, pons and cerebellum).

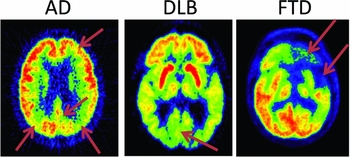
When using these techniques in research or for clinical diagnosis, there are several technical advantages of PET over SPECT. Higher sensitivity results in a better signal-to-noise ratio of the images and lower radiation exposure to patients. The physical characteristics of the radiation allow better correction for attenuation and scatter and thus better quantitative accuracy and comparability between scanners and centers. PET can also achieve higher spatial resolution down to 2 mm at acceptable image noise, permitting accurate quantification also in small and atrophic brain structures (Varrone et al., Reference Varrone, Sjoholm, Eriksson, Gulyas, Halldin and Farde2009b). Compared to these clear technical advantages, the differences in diagnostic accuracy for AD have been less pronounced. In studies with pathological confirmation of diagnosis, sensitivity and specificity typically were in the range of 70–90% (for review see Devous, Reference Devous2002). For PET, multicenter studies have been conducted, demonstrating a sensitivity of 80–95% for diagnosis of AD (Mosconi et al., Reference Mosconi2008; Haense et al., Reference Haense, Herholz, Jagust and Heiss2009). PET also provides significant power to predict progression from mild cognitive impairment to AD, thus contributing to the diagnosis of prodromal AD (Herholz, Reference Herholz2010). In direct comparison, the sensitivity of SPECT in AD has been about 10% lower than PET (Herholz et al., Reference Herholz2002b), while it has demonstrated diagnostic utility in various settings (Johnson et al., Reference Johnson1998; Talbot et al., Reference Talbot, Lloyd, Snowden, Neary and Testa1998; O'Brien et al., Reference O'Brien, Eagger, Syed, Sahakian and Levy1992; Jagust et al., Reference Jagust2001; Staffen et al., Reference Staffen2006). Both techniques can discriminate between frontotemporal dementia (FTD) and AD (Foster et al., Reference Foster2007; McNeill et al., Reference McNeill2007) and demonstrate functional impairment of the primary visual cortex as a diagnostic sign in dementia with Lewy bodies (DLB) (Lobotesis et al., Reference Lobotesis2001; Minoshima et al., Reference Minoshima, Foster, Sima, Frey, Albin and Kuhl2001) (Figure 2).
Typical regional metabolic impairment patterns in the three major degenerative dementia types (arrows): bilateral parietal, posterior cingulate, and mild frontal in Alzheimer's disease (AD); primary visual cortex (and extended bilateral temporal, not marked by an arrow) in dementia with Lewy bodies (DLB); severe asymmetric frontal and temporal pole in fronto-temporal dementia (FTD).

Future perspectives
The close relation between these functional imaging techniques and clinical symptoms can be considered both a strength and a weakness. It supports the clinical validity of the techniques, but at the same time limits the amount of additional information that the imaging gives to comprehensive clinical assessment. Thus, its diagnostic utility could possibly be seen as competing with a clinical specialist service supported by comprehensive neuropsychological assessment, but to my knowledge the relative costs and merits have not yet been analyzed systematically. The close relation with symptoms and disease progression, and the technical robustness and quantitative accuracy also suggest that FDG-PET can serve as a surrogate marker in therapeutic trials (Alexander et al., Reference Alexander, Chen, Pietrini, Rapoport and Reiman2002; Hirono et al., Reference Hirono, Hashimoto, Ishii, Kazui and Mori2004), and that capacity has been utilized repeatedly (Heiss et al., Reference Heiss, Kessler, Mielke, Szelies and Herholz1994; Mega et al., Reference Mega2005; Kadir et al., Reference Kadir2008; Tzimopoulou et al., Reference Tzimopoulou2010).
Cognitive neuroscience has received a big boost from functional MRI (fMRI), using blood oxygen level dependent (BOLD) contrast to identify areas that are activated under specific task or deprivation conditions. Apart from rare conditions, when contraindications to MR exist, this has largely replaced PET functional activation studies in the past 20 years. However, as much as fMRI has benefited cognitive research, it has so far been disappointing with respect to diagnostic capabilities, probably because the BOLD signal and the task conditions are subject to large interindividual variability that can be dealt with in statistical comparisons between study groups but are not appropriate for individual diagnosis. It remains to be seen whether recent developments, such as rCBF measurements by arterial spin labeling (ASL) and resting state fMRI network analysis, may overcome these limitations and emerge as serious competitors to FDG-PET and perfusion SPECT in a clinical diagnostic setting. Similar considerations also apply to advanced electrophysiological techniques based on electroencophalography (EEG) or magnetoencephalography (MEG), which so far lack diagnostic specificity.
Advanced image processing methods for structural MRI have revealed that most brain areas that show functional impairment in PET/SPECT will also develop cortical atrophy (for review see Frisoni et al., Reference Frisoni2007), and in the hippocampus atrophy even appears to lead (Villain et al., Reference Villain2010). To conduct such morphometric MR studies in a multicenter setting and longitudinally requires a high level of machine tuning and quality control, even more so than with PET. The Alzheimer's Disease Neuroimaging Initiative (ADNI) is conducting a longitudinal multicenter study that is expected to clarify the relative merits of morphometric MR and FDG-PET in direct comparison (Trojanowski et al., Reference Trojanowski2010). Diffusion tensor imaging (DTI) is detecting early changes in white matter fiber tracts, which are likely to complement the cortical abnormalities revealed by morphometric MR and FDG-PET, while their relative diagnostic power remains to be clarified.
Eventually, we expect the commercial provision of amyloid tracers for PET, providing an intriguing perspective for very early detection of the formation of fibrillary amyloid plaques in human brain, which is thought to precede the clinical manifestation of AD by about ten years (Rowe et al., Reference Rowe2010). In contrast to all other techniques, amyloid PET is not primarily aimed at brain alterations that are more or less directly related to symptoms, but represents a new kind of imaging that reveals a clinically silent (at least initially) molecular target. It is therefore likely to provide a larger amount of diagnostic information in addition to clinical assessment than FDG-PET and the other techniques discussed so far. Whether – and under which conditions – that information is clinically useful remains to be clarified.
Overall, the advances made in the field of brain imaging and their contribution to the understanding of the human pathophysiology of AD and other neurodegenerative dementias have been enormous. The main challenge is now to turn that progress into therapeutic progress. There is a very good chance that this might be successful because progress in the therapeutic area will require a new type of clinical trial that aims at preventing or delaying dementia, rather than fighting the symptoms of manifest dementia (Aisen et al., Reference Aisen2011). FDG-PET and other imaging techniques can provide the necessary capability for diagnosing AD before the onset of dementia, which has not been practical in the past. Thus, we should address what is required to make this academic dream a widespread reality.
There is a substantial restriction on the availability of PET scanners in many countries. However, since FDG-PET has become a widely recognized routine tool for cancer diagnosis, this limitation is likely to be gradually overcome and the capacity of scanners for clinical trials should soon be sufficient, at least in developed countries. The same applies to the cost and availability of FDG, which is increasingly being provided by competing commercial suppliers. The most severe restriction currently is probably a shortage of trained staff (physicians, radiographers and technicians) to acquire and analyze the scans. Many nuclear medicine and radiology specialists will have conducted rather few brain scans in the past decade when oncological diagnostic procedures became the main activity in most nuclear medicine departments. This is a challenge of which the nuclear medicine professional organizations are aware, and they are expected to increase their activities in appropriate training programs. Image analysis and interpretation should also involve other disciplines from clinical neurosciences to maximize the diagnostic gain by comprehensive linkage of clinical and image-derived information.
There is a need for standardization of data acquisition and interpretation. The visual interpretation of FDG-PET and perfusion SPECT requires detailed knowledge of brain functional anatomy, which is not always being automatically provided in a standard nuclear medicine training curricula. However, modern image processing techniques, such as spatial transformation, into a common reference space, and quantitative comparison with a reference database with display of results in a standardized and easily interpretable format such as statistical parametric mapping (SPM) (Dougall et al., Reference Dougall, Nobili and Ebmeier2004) and stereotactic surface projection (SSP) (Minoshima et al., Reference Minoshima, Frey, Koeppe, Foster and Kuhl1995; Ishii et al., Reference Ishii2006), have provided excellent support for increasing the reporting standards, even for less experienced readers. Further assistance is provided by automated procedures that provide measures of disease severity (Herholz et al., Reference Herholz2002a), and diagnostic discriminators based on pattern recognition, principal component analysis and machine learning algorithms are being explored as expert systems to assist with image interpretation (Habeck et al., Reference Habeck2008; Salas-Gonzalez et al., Reference Salas-Gonzalez2009; Merhof et al., Reference Merhof2011).
Conflict of interest
None.