Introduction
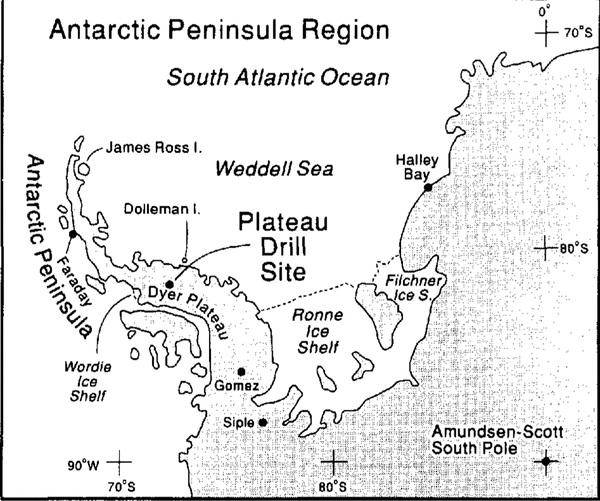
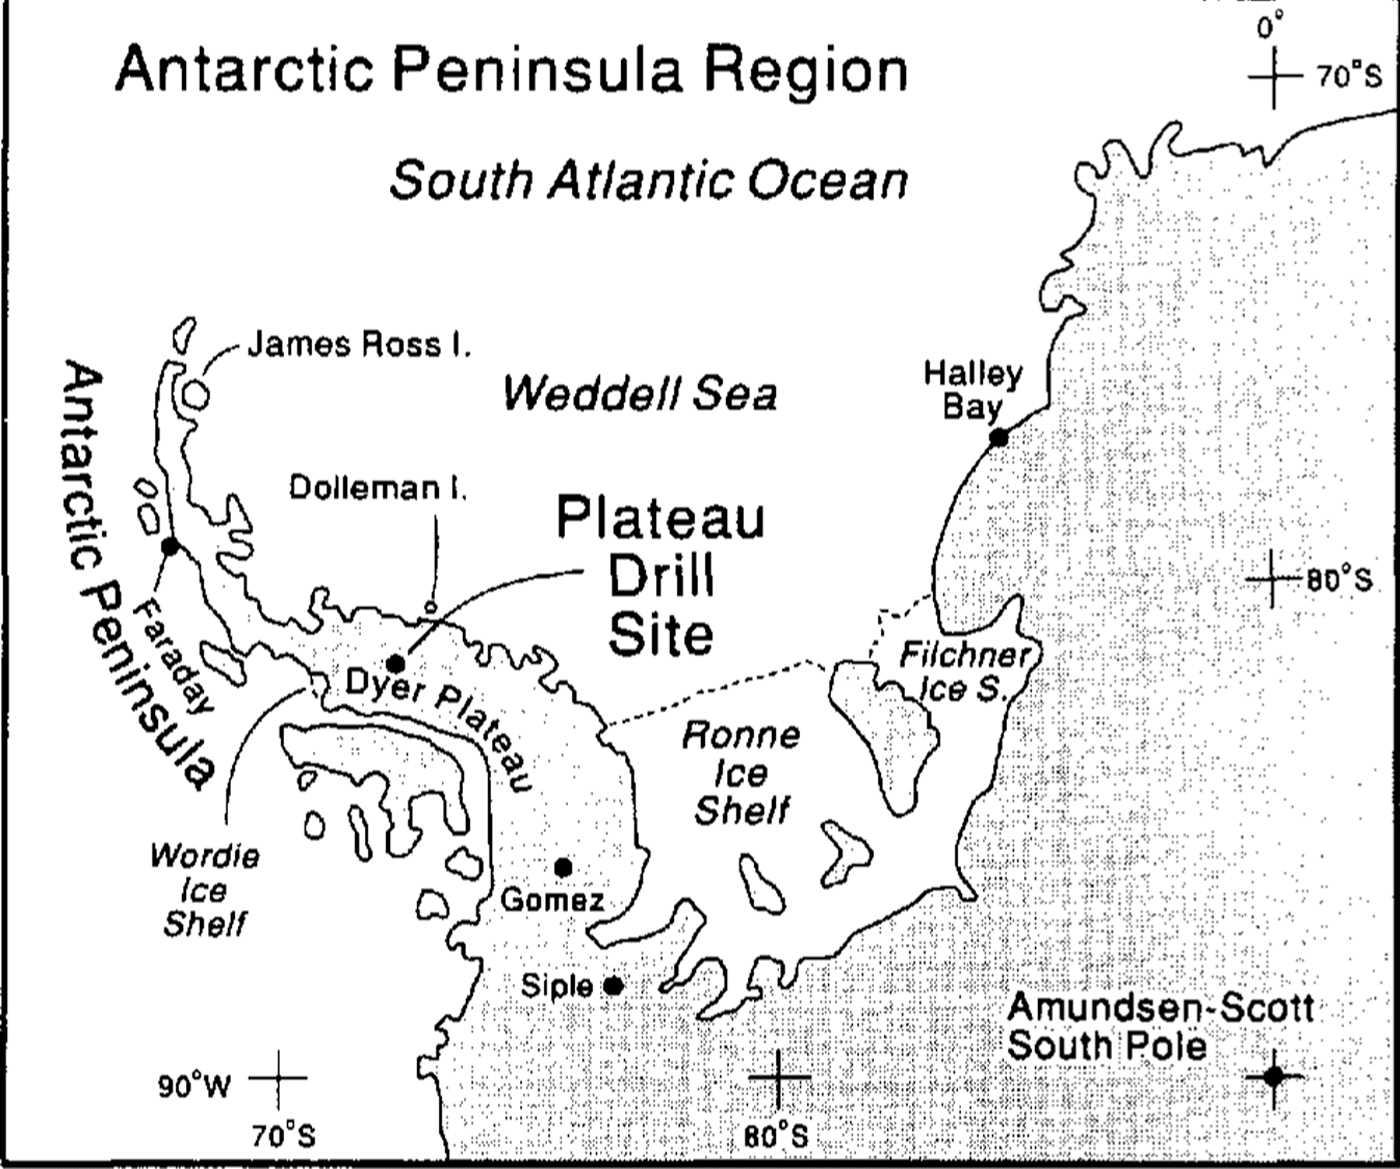
A co-operative glaciological climatological ice-core drilling program was conducted on Dyer Plateau (70°40′16″S; 64°52′30″W; 2002 m a.s.l.; mean annual temperature: -21°c) between 1988 and 1992. The program draws upon the expertise of each group to establish a 480 year paleoenvironmental history of the Antarctic Peninsula region (Fig. 1). In 1988–89, a geophysical program was initiated and two ice cores were drilled to a depth of 108 m at a location 6 km west of the divide. In 1989 90, two cores were recovered 1 m apart on the crest of Dyer Plateau (core 1—233.8 m and core 2 — 235.2 m) and two 50 m cores were drilled 4 km east of the divide. In 1989–90, the geophysical measurements were expanded to encompass the new core locations as well as potential future drill sites (paper in preparation by C. Raymond and others). Ice-core quality varied from excellent (long, continuous pieces) in the upper 112 m to very poor (fractured and wafered) below 190 m. The history presented here is from the top 112 m of core 1 (AD 1761–1990) and the lower part (112–190m) of core 2 (AD 1504–1760). The complementary sections of both cores are being analyzed at the British Antarctic Survey (BAS) as part of this joint project.
The Antarctic Peninsula area is a climatically complex and sensitive region which extends northward across the cirum-polar trough (Reference SchwerdtfegerSchwerdtfeger, 1984). This is a major area for sea-ice production and thus meteorological conditions are strongly affected by variations in sea-ice cover over the adjacent oceans and the Weddell Sea. This project is part of a continuing effort to construct a global climate synthesis for the last 1000 years. with special emphasis upon the character and temporal synchroneity of the “presumed” most recent Neoglacial event often called the “Little Ice Age” (LIA)Footnote * . Identifying and understanding the linkages between climatic variations in lower latitudes and those in the polar regions should enhance our ability to identify and understand the mechanisms responsible for globally significant climate fluctuations. The Antarctic Peninsula is a key site for climatic and environmental reconstructions from ice cores and provides a critical link between records from the interior of Antarctica and those emerging from South America. First, a comprehensive climate history for the peninsula region must be reconstructed — a formidable task given the meteorological and oceanic complexity of the area.
The Location of the Dyer Plateau drill site in the Antarctic Peninsula region is illustrated along with other geographic features mentioned in the text.
Ice-core analyses
Visual stratigraphy and density (Fig. 2) were measured immediately in the field. The borehole temperature profile was determined using two thermistors with calibration resistances at 0°, -15°,-30° and -50°C. Borehole temperatures, measured 1 year after retrieval of the core, range from a minimum of -21.36°C at 53 m to a maximum of -19.89°C at 230 m (Fig. 2). All ice cores were returned frozen for physical and chemical analyses in the laboratories at the Byrd Polar Research Center (BPRC) and the British Antarctic Survey.
Samples were cut continuously along the entire length of the core and each sample was analyzed for microparticle concentration (MPC) and size distribution, oxygen-isotopic ratios (δ18O), liquid conductivity (LC) and concentrations of selected inorganic anions. MPC, δ180, LC and anions were measured at BPRC. All measurements except δ18O were conducted under Class 100 Clean Room conditions. The concentration and size distribution of particles with diameters ≥0.63μm ml-1 sample were measured using a model TA-II Coulter Counter (Reference ThompsonThompson, 1977). Conductivity of liquid samples was measured with a Beckman model RC-16C conductivity bridge. The concentrations of the major anions of chloride (Cl-), sulfate SO4 2- and nitrate (NO3 ) were determined with a Dionex model 2010i chromatograph equipped with an AS4A anion separator column.
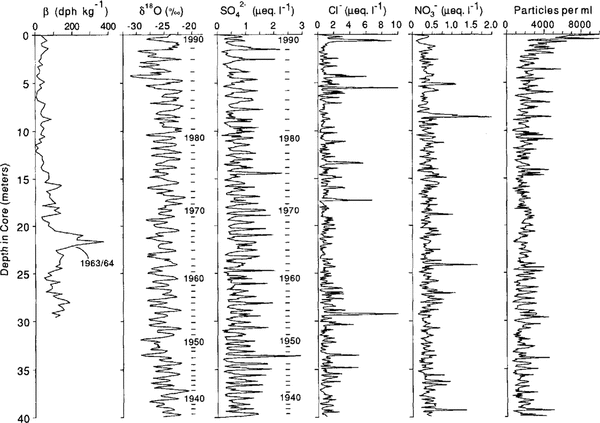
Total β radioactivity is routinely used to identify known time-stratigraphic horizons associated with past atmospheric thermonuclear tests (Reference CrozazCrozaz, 1969). Samples with masses between 250 and 350 g were cut from the upper 30 m of the core. These were acidified, melted and pumped through ion-exchange filters, after which total radioactivity was measured by a Tennelee LB 1000 Series low-background β counting system. When identified, these radioactive horizons allow verification of seasonally varying parameters and provide confirmation of the dating of layers younger than 1954 (Reference Picciotto and WilgainPicciotto and Wilgain, 1963). Figure 3 illustrates the β radioactivity profile along with SO4 2- and δ18O for each sample in the upper 40 m of core I which encompass the last 53 years. Note that the first major increase in ßradio activity occurs in 1963-64, coincident with 1964 identified by counting annual variations in SO4 2- and δ18O.
The high annual accumulation rate of 0.44 m (water equivalent) allowed each annual layer to be cut into an average of 15 samples near the top and six samples at 181 m. This sampling scheme resulted in 4136 samples each for MPC and δ18O and 3850 samples for anions. These analyses reveal well-preserved, annual variations in both SO4 2- and δ18O which make dating the core straightforward. Figure 3 illustrates that SO4 2-shows the better seasonality than δ18O and the lack of well-defined seasonality in the concentrations of Cl-, NO3 - and dust content. Identification of known volcanic events (discussed later) lends further support to the time-scale. A precise time-scale is the first step in developing high-resolution histories of atmospheric dust content, δ18O, atmospheric chemistry and net annual accumulation.
The temperature profile was measured in the 1989- 90 Dyer Plateau borehole and densities were measured to 100 m along core 1.

The continuous analyses of δ18O, SO4 2-, C1,.NO3, and insoluble particulates (diameters ≥ 0.63µm) are illustrated for the upper 40 m (1937—90) of core 1 on Dyer Plateau. The excellently preserved seasonal variations in δ18O and SO4 2-, confirmed by the 1963-64, horizon, provide a precise time-scale to AD 1500.

Results
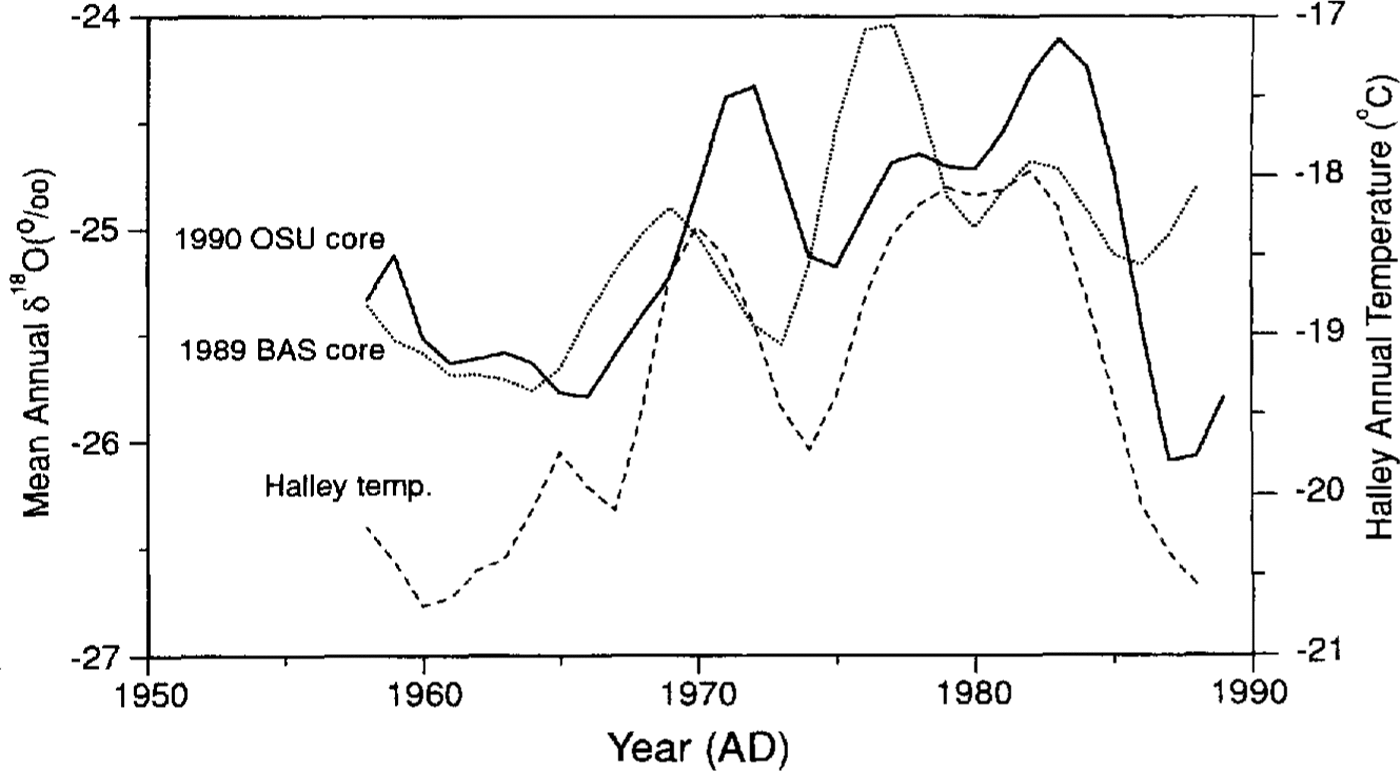
As with any ice core, these histories reflect a combination of local, regional and larger-scale processes. of most interest are the regional and larger-scale components which ideally should be integrated with other Antarctic Peninsula histories to ascertain a broader picture of the climate history of the region. Comparing records from an array of sites also highlights spatial differences which may reflect more localized processes. A recent paper by Reference Jones, Marsh, Wigley and PeelJones and others (1993) discussed the complexity of the meteorological regime in the peninsula region, the large spatial variability of climate parameters such as temperature and the mediocre relationship between δ18O and temperature (R≈0.5). The annual averages of δ18O from two Dyer Plateau cores, the 1989 90 OSU core drilled at the plateau crest and the 1988-89 BAS core drilled 6 km west, arc illustrated in Figure 4. Included are the annual (August to the following July) average temperatures from Halley Bay, located on the coast to the east across the Weddell Sea. These three histories are smoothed with a 5 year Gaussian filter and reveal that in general the average δ18O records do capture much of the large-scale features of the temperature history at Halley Bay (see R2 values given in Table 1). Jones and others noted the necessity to analyze additional cores from the peninsula and to include the analyses of both δ18O and δD in future studies.
The Dyer Plateau record presented here provides information from an additional site which is 6° further south and 360 m higher than James Ross Island, 1600 and 870 m higher than Dolleman Island or the Gomez site, respectively, and 6.53.5°C colder (annual average) than any other peninsula drill site (Reference peel, Bradley and JonesPeel, 1992). At this time δD measurements have not been made but are planned in the near future.
Coefficients of determination (R2) for a linear relationship among annually averaged δ18O from two Dyer Plateau ice cores and mean annual temperatures at Halley Bay. All annual averages were smoothed with a 5 year Gaussian filter

The 1958–89 annual averages of δ18O from two Dyer Plateau cores, the 1989–90 OSU core and the 1988–89 BAS core, are compared with the annual average temperatures (August to the following July) from Halley Bay. All three records were smoothed with a 5 year Gaussian filter. The OSU core was drilled at the plateau crest and the BAS core was drilled 6 km to the west.

In 1985 a 302 m core was drilled at Siple Station (75°55′S, 84°15′W, 1054 m a.s.l.) at the base of the Antarctic Peninsula (Fig. 1). As on Dyer Plateau the excellent preservation of seasonal changes in δ18O and SO4 2-(Reference Mosley-Thompson, Dai, Thompson, Grootes, Arbogast and PaskievitchMosley-Thomson and others, 1991) provided a 550 year history of environmental conditions (Reference Mosley-Thompson, Thompson, Grootes and GundestrupMosley-Thompson and others, 1990). To expand our view of the climate and environment of the peninsula area, the Dyer Plateau records are presented with comparable ones from Siple Station. This comparison highlights more regionally extensive trends dominated by larger-scale processes and also isolates differences.
Oxygen-isotopic analyses
δ18O records reflect in varying degrees (I) the air temperature at which condensation occurs, (2) atmospheric processes occurring between the water-vapor source (oceans) and the deposition site, (3) local conditions which dominate during firnification, and (4) the surface elevation and latitude of the depositional site (see Reference Dansgaard, Johnsen, Clausen and GundestrupDansgaard and others, 1973; Reference BradleyBradley, 1985, for review). The correlation of atmospheric temperatures with δ18O and its spatial representativeness are still under discussion; nevertheless,δ18O is used widely as a climate proxy, particularly for temperature (Reference Jouzel, Merlivat, Petit and LoriusJouzel and others, 1983; Reference Thompson, Thompson, Dansgaard and GrootesThompson and others, 1986, Reference Thompson, Thompson, Dansgaard and Grootes1989); Reference JohnsenJohnsen and others, 1992; Reference peel, Bradley and JonesPeel, 1992). As shown in Figure 4, the recent δ18O history appears to reflect the major temperature trends in the Weddell Sea sector (Table 1)
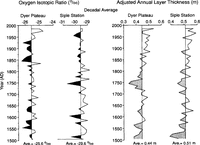
The decadal averages of δ18O for Dyer Plateau and Siple Station (Fig. 5) reveal the absence of a prolonged cool period from 1450 to 1850, consistent with earlier δ18O histories from James Ross Island (Reference Aristarain, Jouzel and PourchetAristarain and others, 1986) and Dolleman Island (Reference peel, Bradley and JonesPeel, 1992). This climate scenario is different from that found in δ18O records from East Antarctica or from sites removed from the Weddell Sea sector (Reference Mosley-Thompson, Bradley and JonesMosley-Thompson, 1992) where cooler than normal conditions were more prevalent prior to 1850, The Dyer Plateau δ18O history suggests a marked cooling between 1840 and 1850, after which cooler than normal conditions prevailed for a century, This century-long cool period is not evident at Siple Station at the base of the peninsula. On the other hand, the Siple Station δ18O -record, like that from Dyer Plateau, reveals no prolonged cool period prior to 1850 (Fig. 5). The lack of a marked cool period on Dyer Plateau in the middle of the peninsula and at Siple Station, along with those from Several lower-elevation, lower-latitude peninsula sites (Reference peel, Bradley and JonesPeel, 1992), provides an emerging view of the climate of the last half-millennium in the peninsula region which is quite different from that in East Antarctica. The Dyer Plateau δ18O record (fig. 5) indicates an isotopic warming beginning in 1930 and extending to the present (the warming at Siple Station is more modest). On Dyer Plateau the last two decades have been among the “isotopically” warmest three decades (the other being 1831 40) in the last five centuries. Instrumental records indicate that the warming since 1950 appears to be regionally significant throughout the peninsula. for example, from 1943 to 1992 temperatures at Faraday have warmed nearly 2.5°C (Jones and others, 1993). Further evidence of this warming is reflected in the rapid disintegration of the Wordie Ice Shelf from ≈2000 km in 1966 to w 700 km2 in 1989 (Reference Doake and VaughanDoake and Vaughan, 1991). Reference SplettstoesserSplettstoesser (1992) reported the recent retreat of Northeast Glacier on Stonington Island about 65 miles [105 km] north of the Wordie Ice Shelf. These observations, along with δ18O (proxy) records, indicate a recent and continuing warming trend in the peninsula region.
Decadal averages of δ18O and reconstructed layer thicknesses on Dyer Plateau are illustrated with concurrent histories from Siple Station located at the base of the Antarctic Peninsula.

Annual layer thicknesses
Annual layer thicknesses provide a history of the net mass accumulating in a given year but do not reflect precipitation amounts directly. Unfortunately, layers thin as they are buried by subsequent accumulation and as they are stretched when the ice flows outward from the crest of the plateau. One objective of the complementary geophysical study is to provide information about the flow characteristics of the ice around the borehole to adjust measured annual layer thicknesses for such thinning. One important assumption is that the surface vertical velocity is equal to the short-term accumulation rate of 1.16 m a-1(mean density = 400 kg m3 ) obtained from stake measurements for the period 1989 92. Another assumption is that the velocity and density profiles have remained constant over time. A detailed discussion of the final annual layer reconstruction is in preparation by C. Raymond and others; however, the trend in these reconstructed thicknesses (Fig. 5) is not expected to change, although the final thicknesses may vary slightly.
Figure 5 illustrates the decadal averages of the reconstructed annual layer thicknesses (A n) for both the Dyer Plateau and Siple Station cores. No long-term (480 year) trend is evident at either site, although several short-term (multi-decadal) trends appear to be synchronous (R2 = 0.247, significant at the 99% level; Table 2). From AD 1500 to ≈1700, A n increased slightly at both sites after which A n decreased to a minimum at 1750. This minimum is more pronounced at Dyer Plateau than at Siple Station. Since 1750, A n has increased gradually at both sites although more strongly at Dyer Plateau than at Siple Station. This net accumulation increase since 1750 is in general agreement with those on James Ross and Dolleman Islands (see Reference peel, Bradley and JonesPeel, 1992;.Reference Jones, Marsh, Wigley and PeelJones and others, 1993). As noted by Reference Jones, Marsh, Wigley and PeelJones and others (1993), in this region, the δ18O and A n histories are not correlated as expected assuming precipitation increases with temperature. The 180 and An records from both Dyer Plateau and Siple Station further support this inconsistency; specifically, an isotopically cool period (≈1800–1930) is associated with increasing net accumulation. This pattern, apparently widespread in the peninsula, indicates a more complex relationship among moisture sources, atmospheric temperature and humidity, and net snow accumulation than is commonly assumed. As the peninsula is a meteorologically complex region, it poses a great challenge for accurate interpretation of ice core proxy data.
Coefficients of determination (R2 )* are given for a linear relationship between measured ice-core constituents in a core from Siple Station and one from Dyer Plateau, Antarctica

Dust content and excess sulfate
The 480 year histories of dust deposition at Dyer Plateau and Siple Station (Fig. 6) are quite similar ( R2 = 0.475, significant at the 99.9% level; Table 2) with consistently low concentrations from AD 1500 until the mid-19th century. There are two prominent dust features at both sites: (I) the gradual increase in dust content since 1850 and (2) the prominent dust event from 1598 to 1600. The increase in dust since 1850 is perplexing in view of the concurrent decrease in temperature (δl8O) and increase in net accumulation. These observations raise the question whether the increased dust reflects: (I) a more dusty atmosphere, resulting from (a) more effective entrainment processes, (b) increased source area as ice retreat in the peninsula region exposed more bedrock or (c) a semi permanent displacement of primary circulation features which resulted in the southward advection of dust, and/or (2)entrainment of dust in the more porous upper firn layers during drilling and transportation. The lack of a similar increase in the concentrations of the three major anions (Cl–, SO4 2- and NO3 -) suggests that the dust increase is probably not associated with contamination but does reflect a real increase in atmospheric dustiness.
Decadal averages of total dust content (diameters ≥ O.63 µm ml-1) and excess sulfate (EXS) on Dyer Plateau are illustrated with concurrent histories from Siple Station located at the base of the Antarctic Peninsula

As particulates are deposited by both wet and dry processes, it is difficult to separate their contributions without a continuous, multi-year, in situ snow and air sampling program. Previous studies in East Antarctica (Reference Mosley-Thompson, Bradley and JonesMosley-Thompson, 1992) and South America (Reference Thompson, Thompson, Dansgaard and GrootesThompson and others, 1986) reported increased particulate deposition during cooler periods.
The second prominent dust feature is an abrupt and large dust increase from 1598 to 1600. In 1599, dust content increased by nearly a factor of 10 at both Dyer Plateau and Siple Station. Figure 6 also illustrates for both cores the excess sulfate (EXS) or non-sea-salt sulfate (NSS), adjusted using Cl- to estimate the sea-salt component (Dai and others, 1991). EXS is substantially elevated from 1599 to 1601, suggesting that the sulfate arrived at both sites 1 year after the particulates. The origin of this event is unknown. Although the 1600 eruption of Huaynaputina in southern Peru is prominent in the Quelccaya records (Reference Thompson, Thompson, Dansgaard and GrootesThompson and others, 1986) and has been noted in EXS in Greenland (these authors) It is unlikely that these particulates originated from Huaynaputina. Given the large concentrations, their origin is probably local. It is possible that Huaynaputina contributed to the elevated EXS in 1601 but it cannot be the source for EXS which first arrived in 1598. Huaynaputina has yet to be identified conclusively in Antarctic ice-core records. Ascertaining whether the dust is of volcanic origin is a logical next step as well as inspecting other Antarctic records for this potential “marker horizon”. The EXS histories from Dyer Plateau and Siple Station ( R2 = 0.583, significant at the 99.9% level; Table 2) along with EXS histories from Greenland will contribute to the development of a global volcanic history for the last five centuries.
The EXS histories for Siple Station and Dyer Plateau (Fig. 6) reveal a number of known volcanic events as well as some unidentified events. Identification of known events provides time-scale confirmation. In addition, the recent background concentration of EXS may be compared with that from the pre-industrial era to determine whether Antarctic snow is yet contaminated by Northern Hemisphere industrial activities. To make this comparison, years of known volcanism (Fig. 6) were removed from the record prior to averaging. In the Dyer Plateau core the ratio of excess SO4 2- from 1851 to 1990 to that from 1600 to 1850 is 1.18/1.l5 (μeq L-1) suggesting virtually no change in the EXS source since 1850. A similar calculation for EXS at Siple Station gives a ratio of 1.32/1.24, indicating a slight increase in EXS since 1850; however, this difference (0.09 μeq L-1 ) is very near the analytical precision of the analyses and may be meaningless.
Conclusions
The emerging paleoclimate history from Dyer Plateau is providing further insight into the regional history of the Antarctic Peninsula. When viewed along with a comparable history from Siple Station, certain regional characteristics become evident. These include relatively normal conditions (e.g. no LIA) from 1500 to 1850 with cooler conditions from 1850 to the mid-20th century. Cooler conditions were associated with a gradual increase in the flux of insoluble dust and an increase in net accumulation. No major increase in excess sulfate aerosols is found which suggests no anthropogenic contribution to snow in this region.
The prominent warming since 1950 on Dyer Plateau is consistent with other observations in the region, particularly those on the western side of the peninsula. This warming in the last few decades is not evident in δ18O histories from the East Antarctic plateau. These regional differences are not unlike those one would find in the meteorological histories of globally dispersed stations. A comparison of the decadal averages for the last 500 years from different ice cores reveals marked differences.
Figure 2 in Reference ThompsonThompson and others (1993) compares five such histories: Camp Century, Greenland; Dunde ice cap, China; Quelccaya ice cap, Peru; and Siple and South Pole Stations, Antarctica. These five, in addition to the Dyer Plateau record presented here and another record emerging from the Guliya ice cap in western China (Reference ThompsonThompson and others, 1993; and unpublished data), reveal that the recent warming has been most pronounced at the high elevation, non-polar sites (Dunde, Guliya and Quelccaya ice caps) and in the Antarctic Peninsula. Up to 1980, no warming was evident at the South Pole. At Siple Station the cooler conditions in the last century have been replaced by a warming trend in the last two decades which is rising just above the long-term average. Thus, the recent “globally averaged warming” is not evident at all latitudes. These ice-core histories are particularly valuable as they provide a longer-term perspective from which the significance of any recent changes may be evaluated.
Acknowledgements
We thank the personnel from the Byrd Polar Research Center and the British Antarctic Survey who participated in the field program, and Bruce Koci of the Polar Ice Coring Office (PICO) which is supported under a contract from the U.S. National Science Foundation. We gratefully acknowledge the logistical support by the staff and BAS Air Unit at Rothera Station. K. Doddroe typed the manuscript and J. Nagy prepared the figures. This project was supported by U.S. National Science Foundation grants DPP–8716384 and ATM–90084–7 to The Ohio State University and U.S. National Science Foundation grant DPP–8716243 to the University of Washington, and support to the British Antarctic Survey was provided by the U.K. Natural Environment Research Council. We thank P. D. Jones for his insightful comments and valuable suggestions. This is contribution Number 872 of the Byrd Polar Research Center.